Sustainable joint solventless coproduction of glycerol carbonate and ethylene glycol via thermal transesterification of glycerol

Jesús Estebana, Elena Fuentea, María González-Miquelb, Ángeles Blancoa, Miguel Ladero*a and Félix García-Ochoaa
aDepartment of Chemical Engineering, Complutense University of Madrid, Avda. Complutense s/n. 28040, Madrid, Spain. E-mail: mladero@quim.ucm.es; Fax: +34-913944179; Tel: +34-913944164
bSchool of Chemical Engineering and Analytical Science, The University of Manchester, The Mill Sackville Street, M139PL, Manchester, UK

Received 28th July 2014 , Accepted 7th October 2014

First published on 8th October 2014


Abstract

This study focuses on the thermal reaction between glycerol and ethylene carbonate to obtain glycerol carbonate and ethylene glycol under solventless homogeneous operation, the process being a transcarbonation of glycerol or a glycerolysis of ethylene carbonate. As the two reagents constitute an immiscible system at 40 °C evolving into a single phase at 80 °C, the evolution of phases with temperature was studied by focused beam reflectance measurement. As the biphasic system was inert, runs were completed under a monophasic regime from 100 to 140 °C with molar ratios of ethylene carbonate to glycerol of 2 and 3, achieving quantitative conversion of glycerol, as corroborated by a thermodynamic study. Second order potential kinetic models were proposed and fitted to the data. Finally, a comparison with analogous catalytic approaches was made, showing that this process performs better material-wise.

Introduction

Due to the high production of glycerol (Gly) from biodiesel processes, its valorisation has been the subject of a thorough study.1 Many valuable products have been obtained based on syntheses from glycerol, among which are solketal, 1,3-propanediol, dihydroxyacetone and glycerol carbonate (GlyCarb).2

GlyCarb has received increasing interest as a potential bio-based product.3 It has shown outstanding properties in many applications as surfactant and solvent.4 Its use as a green-based solvent has been credited in Li-ion batteries,5 analytical applications,6 cosolvent with ionic liquids7 or as a solvent in immobilized liquid membranes for selective carbon dioxide separation from CO2/N2 mixtures.8 Moreover, its inclusion in building materials has proven effective for rapid hardening, reducing shrinkage of the material and improving compressive strength.9

Moreover, GlyCarb can also be regarded as a building block. Atom transfer radical polymerization initiators can be synthesized to yield polymers with end-functional five-membered cyclic carbonate groups for application as coatings, macromolecular surfactants and adhesives.10 GlyCarb has substituted the less environmentally friendly glycidol in the synthesis of hyperbranched polyethers.11 By acylation of GlyCarb, several esters have been obtained with surfactant features as well as thermal and oxidation stability.12 Secondary amines also react with it to produce alkyl glycerol carbamates used as thickeners in surface-active preparations.13

Traditional production of GlyCarb used to be accomplished with phosgene. Nevertheless, this hazardous method has been substituted by alternative procedures. Reaction of glycerol with urea at 140 to 150 °C under vacuum conditions and catalysts like rare earth metal oxides, La2O3, Zn and Mn sulphates or calcined Zn hydrotalcites yields 86% GlyCarb in the best case scenario.14–19 Direct addition of CO2 was tested with tin-based catalysts under solventless conditions at 180 °C and 5 MPa;20 in the presence of methanol as solvent, conditions were lowered to 80 °C and 3.5 MPa improving the yield of the process.21 Even supercritical conditions (40 °C, 10 MPa) with basic ion exchange resins and zeolites22 were tried. In none of these cases the yields achieved were higher than 35%.21 Similarly, carbonylation via the addition of CO and O2 mixtures with a palladium-based catalyst has been undertaken with a yield as high as 92% and almost total selectivity.23

However, the most followed trend is the use of organic carbonates to perform the transesterification of glycerol, known for over fifty years,24 due to the high yield obtained at low temperature. Particularly, transesterification to GlyCarb with dialkyl carbonates has been much more widely covered11,25–31 than that with ethylene carbonate (EtCarb), with fewer references being found until the present date.19,22,32,33 As presented in Scheme 1, an additional advantage of the latter reaction is that ethylene glycol (MEG) is obtained as well, being this a product extensively used as antifreeze and other applications. This substance is obtained by hydrolysis of ethylene oxide (EO), giving MEG and oligoglycols. The best procedure seems to be Shell's OMEGA process, in which EO is carbonated and subsequently hydrated to yield 99.5% MEG, a further effort to reach the most valuable product and the maximum achievable exploitation of feedstock.34–37


image file: c4ra11209a-s1.tif
Scheme 1 Transesterification reaction of Gly and EtCarb.

At temperatures above the melting point of EtCarb (36 °C), the two reactants of the proposed reaction constitute a liquid–liquid dispersion up to a certain temperature. In order to study heterogeneous systems, focused beam reflectance measurement (FBRM) has been successfully applied. This technique has been used to measure particle and droplet sizes in suspensions of solids in liquids,38 flocculation processes39 and liquid–liquid dispersions.40,41 An in situ monitoring of the evolution of the dispersion with temperature is herein proposed to determine the phase changing behaviour of the system.

According to literature, thus far, GlyCarb synthesis has only been pursued through catalytic procedures, with the concomitant need for removing the catalyst from the final product and/or regenerating it after a certain operation time. Hence, the aim of this work is to develop a novel and more sustainable solventless thermal process at atmospheric pressure and low to moderate temperatures. A thermodynamic study of the reaction at the conditions tested is presented together with a kinetic model for this thermal reaction.

Results and discussion

Assessment of the miscibility of the liquid phases

Prior to experimentation aimed at obtaining the kinetic model, experiments were performed to monitor the evolution of the biphasic system with temperature. Assessment of the evolution of the ab initio biphasic system was made following a variable that gives an idea of the decrease of the size of the droplets within the emulsion. Said variable was the mean chord length of the droplets and the number of counts per second, parameters whose value decrease as temperature increases from 40 to 80 °C, as shown in Fig. 1.
image file: c4ra11209a-f1.tif
Fig. 1 Evolution of the mean chord length and droplet count per second with temperature. Conditions: stirring speed (SS) of 750 rpm and Gly at a EtCarb to Gly molar ratio (M) of 3.

Values of the mean chord length at 40 °C are in the millimetre range, while at temperatures equal or higher than 75 °C they are in the micrometer range. At 80 °C, the mean chord length was negligible, indicating that the size of the droplets was smaller than the detection limit of the FBRM (1 µm), so it can be inferred that EtCarb and Gly gradually dissolved in each other so that the dispersion system evolved into a single phase above 80 °C. This is confirmed by the exponential reduction of the number of counts or events per second detected by the FBRM.

To observe the influence of the number of phases in the reacting system and the temperature, some preliminary runs were conducted at different temperatures allowing batches of the reagents (molar ratio of EtCarb to Gly equal to 2) to interact under agitation for 24 hours (data not shown). No products were detected while operating at temperatures within which the system showed liquid–liquid biphasic behaviour, at 75 °C and lower temperatures. Only the presence of products was observable when operating at 80 °C, though the conversion X only amounted to 9.3% after the mentioned period of time. Thus, it can be said that the system was almost inert while in a liquid–liquid biphasic state and the thermal reaction only took place at appreciable rate under homogeneous conditions and temperature equal to or higher than 100 °C. At atmospheric pressure and 140 °C, some evaporation phenomena were observed, thus being this the highest temperature selected for further studies.

Thermodynamic study

The purpose of this study was to determine whether the thermodynamic equilibrium constant value was high enough to predict that the behaviour of the reaction was shifted towards the products as well as to assess its endo- or exothermicity. A thermodynamic study of this type has previously been reported, yet the calculations were made at lower temperatures than those investigated in the present paper. However, the methodology presented therein served as a basis to develop a thermodynamic evaluation for the scenarios approached in this study.42

Application of the well-known Kirchhoff laws for reaction enthalpy and entropy as functions of temperature leads to values of these thermodynamic functions at 80 to 140 °C. Gibb's free energy values have been estimated from the mentioned functions and the equilibrium constants from Gibbs free energy at the temperature values were also computed (Appendix 1). For the mentioned calculations to be performed, several literature references were consulted.43–49 The main results are summarized in Table 1. It can be seen from the value of the equilibrium constant at temperatures equal to or higher than 100 °C that the global reaction is shifted towards the products, while reaction enthalpies imply endothermicity. The influence of the entropy in the equilibrium is decisive, being the most influential term in Gibb's free energy, with a higher impact as temperature rises. For this system, the following equations relate the thermodynamic functions and the equilibrium constant with temperature:

 
ΔH0r = 166.21 − 0.1556T[K] (1)
 
ΔS0r = −9193 + 30.49T[K] (2)
 
ΔG0r = 4862 − 14.93T[K] (3)
 
K = 10−5[thin space (1/6-em)]e0.037T[K] (4)

Table 1 Enthalpy, entropy standard Gibbs free energy of reaction and chemical equilibrium constant of the transesterification of EtCarb and Gly at the temperatures tested in this work
Temperature (°C) ΔH0r (kJ mol−1) ΔS0r (J mol−1 K−1) ΔG0r (kJ mol−1) K
100 108.26 2186.66 −707.37 14.42
110 106.53 2487.25 −846.08 20.78
120 104.91 2790.85 −991.89 30.04
130 103.41 3097.22 −1144.77 43.55
140 102.04 3406.11 −1304.69 63.29


Runs for 48 hours were performed at temperatures in the 100 to 140 °C interval and at EtCarb to Gly molar ratios of 2 and 3, in order to reach equilibrium conditions in the relevant operational range. In parallel, calculation of values of conversion at equilibrium was performed from the equilibrium constant at each temperature using eqn (5).

 
image file: c4ra11209a-t1.tif(5)
where xi, νi and γi refer to the molar fraction, stoichiometric coefficient and activity coefficient, respectively. The activity coefficients depend on the composition of the mixture, i.e., the molar fraction of each component, and they can be related to the conversion X. Thus, the conversion at equilibrium can be computed. Two scenarios were contemplated, namely: ideal and real thermodynamic behaviour. In the former, γi were considered equal to one, while in the second these parameters were calculated for all compositions, temperatures and EtCarb to Gly molar ratios by applying a COSMO-RS (COnductor like Screening MOdel for Real Solvents) approach using the software COSMOtherm version C3.0 Release 12.01 with its implicit parameterization BP_TZVP_C30_01201. Activity coefficients are displayed in tables in Appendix 2.

Experimental conversion values for Gly, with their absolute errors, are shown in Fig. 2, together with the computed conversions for the ideal and real liquid approaches. It can be inferred that the system approaches total conversion as the temperature rises and the EtCarb to Gly molar ratio increases, in agreement with the equilibrium constant values. At the same time, although activity coefficients are far from the unit, especially in the case of glycerol and glycerol carbonate, the effect of the high concentration of reagents and products in solution is almost negligible. Moreover, computed values for conversion at equilibrium are in agreement with experimental values, given the absolute error intervals for the latter.


image file: c4ra11209a-f2.tif
Fig. 2 Experimental and calculated conversion of Gly at initial molar ratios of EtCarb to Gly of 2 (a) and 3 (b).

Transesterification runs

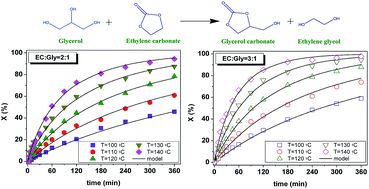
Once the FBRM study allowed for the determination of the operational range in which the system is homogeneous, a series of experiments were completed in order to study the kinetics of the reaction. A total of 10 experiments were conducted at a fixed agitation speed of 750 rpm with temperature ranging between 100 and 140 °C (in intervals of 10 °C) and initial molar ratios of EtCarb to Gly of 2 and 3. Fig. 3 shows the evolution of the conversion in the kinetic runs and fitting of the selected kinetic model.
image file: c4ra11209a-f3.tif
Fig. 3 Experimental results of the kinetic runs of the heat-driven transesterification of EtCarb and Gly and prediction using Model 3. Conditions: Temperature varied from 100 to 140 °C using (a) M = 2 and (b) M = 3 and agitation was kept constant at 800 rpm.

For kinetic model fitting purposes, the software Aspen Custom Modeler was employed. In this program, an algorithm for non-linear regression based on the Levenberg–Marquardt method was applied simultaneously with the numerical integration of the proposed kinetic equation corresponding to each model through a fourth-order Runge–Kutta method.

Initially, correlation of each model was realized at individual temperatures. After obtaining the value of the kinetic constant (or constants) at each temperature, estimates of Ea/R parameters were retrieved, from which simultaneous correlation or each kinetic model to all data at all temperatures was performed to obtain the multivariable fitting parameters.

Table 2 compiles the diverse kinetic models utilized to fit to the experimental data gathered that were proposed in this work. Model 1 was defined as a potential model of first order with respect to EtCarb, keeping the concentration of Gly constant, and a part of the apparent kinetic constant thereof obtained. Model 2 considered an analogous situation, in which only the concentration of Gly was regarded as influential to the kinetic model, becoming the concentration of EtCarb a part of the apparent constant. These models imply that one of the reagents is the main component of the phase were the reaction takes place; the other phase is mainly composed by the other reagent. The dispersed phase droplets would be forming a nanoemulsion, so an FBRM analysis would be not able to detect it (The FBRM herein employed had a lower limit of 1 µm for the diameter of the detected particle).

Table 2 Summary of the kinetic models assessed to fit to experimental data obtained from the thermal transesterification of EtCarb and Gly
Model number Rate equations
1 r = k1CEtCarb = k1CEtCarb0(MX)
2 r = k2CGly = k2CGly0(1 − X)
3 r = k3CGlyCEtCarb = k3CGly02(1 − X)(MX)
4 r = k4CGlyCEtCarbk5CMEGCGlyCarb = k4CGly02(1 − X)(MX) − k5(CGly0X)2


Model 3 describes an overall second order potential kinetic model, with partial first orders with respect to the concentrations of the reactants. Successful fitting of this type of model for the transesterification of dimethyl carbonate and ethanol has been reported.50 Likewise, second order potential kinetic models have been applied to esterification reactions.51,52 Finally, Model 4 still considers a reversible second order potential model. Said situation would be described with a reverse reaction from the products to the reactants. The latter model was tested after some results from the equilibrium runs suggested a conversion slightly lower than one for EtCarb to Gly molar ratio of 2 and temperature varying from 100 to 120 °C.

To select one of the proposed models, statistical criteria defined in the experimental section were used, as well as physicochemical criteria as the value of activation energies.

Table 3 compiles the statistical and fitting parameters calculated after multivariable correlation of all data. Regarding the parameters of the models, a definition of the dependence of the kinetic constants kj with temperature was made following a modified Arrhenius equation suitable for computational purposes:

 
image file: c4ra11209a-t2.tif(6)
where kj0 and Eaj/R are the preexponential factors of the kinetic constants and the ratio between activation energy and the ideal gas constant, respectively.

Table 3 Kinetic and statistical parameters obtained for each kinetic model for the thermal transesterification of glycerol and ethylene carbonate
Model Parameter Value ±Error F95 AIC RMSE VE (%)
1 ln[thin space (1/6-em)]k10 2.64 0.98 718 −3.90 0.14 77.61
Ea1/R 3656 388
2 ln[thin space (1/6-em)]k10 13.04 0.67 4407 −5.62 0.06 96.01
Ea1/R 7154 263
3 ln[thin space (1/6-em)]k10 11.72 0.25 34426 −7.69 0.02 99.50
Ea1/R 7436 100
4 ln[thin space (1/6-em)]k10 11.22 0.29 25335 −8.08 0.02 99.67
Ea1/R 7217 116
ln[thin space (1/6-em)]k20 21.64 3.73
Ea2/R 5143 1472


The activation energies range from 30 kJ mol−1 to around 60 kJ mol−1. The activation energies of processes controlled by the chemical reaction step usually acquire values between 40 and 200 kJ mol−1. These figures can be expected for a homogeneous reacting system.

Due to the value of Ea1/R being below this interval and the poor degree of fitting shown, especially concerning the variation explained (VE), Model 1 was dismissed. Model 2 showed better agreement between experimental and predicted values, increasing significantly the adjusted Fischer parameter (F) and VE. Correlation of Models 3 and 4 lead to a further marked enhancement of all statistical criteria. Nevertheless, as inferred from the results in Table 3, there is no clear evidence that Model 3 is better than Model 4 or vice versa: while F is higher for Model 3 and RMSE has a similar value, VE and AIC show both slightly worse values in terms of goodness of agreement than those obtained for Model 4. In any case, as stated, second order models had been proposed in literature to describe comparable chemical reactions,50–52 and these results further probes the observations in the FBRM studies: the system is homogeneous.

Nonetheless, taking into account results from the thermodynamic studies, it can be said that only the direct reaction takes place when the molar ratio of EtCarb to Gly is equal or higher than 3, while at lower values, the influence of the reverse reaction is considerable, mainly at temperatures of 120 °C or lower. This leads to select Model 3 as the most adequate to represent the transesterification of glycerol and ethylene carbonate in the more common situation of M ≥ 3, and to select Model 4 as the most precise for lower values of the reagent's molar ratio. In Fig. 3, the reasonable fitting of Model 3 to experimental results can be observed.

Finally, Fig. 4 shows the evolution of the relative error of the prediction for Model 3, with a positive value implying an underestimation of such model with respect to the observed data. While the relative error is higher at short times than afterwards, partly due to the absolute values of the variable X being much smaller, no clear trend in regards of an under or overestimation can be observed for the two sets of experiments; thus, this is further proof for the validation of the model, acceptable even for M = 2 if experimental error bars showed in Fig. 3 are taken into account.


image file: c4ra11209a-f4.tif
Fig. 4 Evolution of the error of prediction of Model 3 with respect to the experimental measures operating with (a) M = 2 and (b) M = 3 Conditions: fixed agitation speed of 750 rpm.

Metrics to green chemistry of the process

Given the more and more important view on the sustainability of chemical processes, the advantages of this process have been evaluated with a metrics to green chemistry approach. For this purpose, certain sustainability parameters as described by Constable et al. (2002)34 have been computed for this work as well as for the other references found in literature.

First, it can be said that the atom economy and the carbon efficiency, as defined in the experimental section of this work (eqn (14) through (16)) of the transesterification of Gly and EtCarb to give GlyCarb and MEG are virtually 100%, and the E-factor value is equal to zero in all cases if only the synthetic process herein studied is considered. None of the references cited the use of any solvents and the catalysts employed, where applicable, could be subject to reutilization. The process studied is a one-step solventless reacting system in all cases.

Regarding the comparison between the thermal process herein reported and the catalytic ones found in literature, mass productivity (MP) and reaction mass efficiency (RME) were computed on the basis of a reference experiment (at 100 °C and a molar ratio of EtCarb to Gly of 2). The same parameters were calculated for the experiments that achieved the best yields to products in the other references.

Table 4 compiles the mentioned calculations along with the operating conditions and catalysts described in the other references. The values of MP and RME show that the process herein proposed performs better than the rest. This can be ascribable to the fact that no catalyst was used and virtually total conversion was achieved. When catalysts were used, yields to the products were lower given the activity limitations to the completion of the reaction; whereas in the thermal process, the final yield to product (equal, being this an elemental reaction, to the conversion of glycerol in percentage) is only restricted by thermodynamic considerations, not by mass transfer or deactivation of the catalyst. Also, the values of MP and RME herein obtained apply to batch processes, where no recycling of the molar excess of EtCarb used in is contemplated. Should this excess be recycled, the values of these sustainability parameters could be further improved in all cases.

Table 4 Comparative study of the mass productivity and reaction mass efficiency for various transesterifications of EtCarb and Gly performed in batches
Reference YGC (%) Catalyst Reaction conditions MP (%) RME (%)
a At atmospheric pressure except otherwise specified.b Supercritical conditions.
19 91.0 Al–Mg mixed oxide derived from hydrotalcite with Al/Mg molar ratio of 0.25 T = 50 °C; M = 2; 7 wt% of catalyst with respect to the total weight of reactantsa 45.92 61.80
22 32.2 Purosiv zeolite P = 13 MPa; T = 74 °C; M = 0.63; 125% wt% of catalyst with respect to total weight of reactantsb 11.70 24.68
33 83.8 Tri-n-butylamine supported on MCM-41 molecular sieve T = 80 °C; M = 2; 3.1% wt% of catalyst with respect to the total weight of reactantsa 44.92 56.29
This work 96.9 None: thermal reaction T = 140 °C; M = 2a 50.26 66.37


Experimental section

Materials

The following materials were utilized throughout the present study: extra pure glycerol (assay grade 99.88%) from Fischer Chemical and ethylene carbonate (synthesis grade, purity > 99%), from Scharlau. Citric acid ACS reagent (purity ≥ 99.5%) by Sigma-Aldrich was employed as an internal standard in HPLC analysis. Ethylene glycol (99.8%, anhydrous) and glycerol carbonate (purity ≥ 99.5%), both from Sigma-Aldrich, were used for calibration purposes.

Preliminary studies of the immiscible liquid–liquid system by means of FBRM

A commercially available FBRM system (Lasentec FBRM M500LF) was used for this purpose, whose operating principle is based on scanning a highly focused laser beam at a fixed speed across a non-continuous phase in a fluid phase and measuring the time duration of the backscattered light. The product of the duration of the reflection from each droplet and the velocity of the scanning laser, which is known, determines the chord length. Multiple measurements are retrieved per unit time and are classified in intervals of size according to the length. A schematic outline of this device may be found elsewhere.39

Procedure for performing kinetic runs

To carry out runs to obtain kinetic data for the system in study, reaction conditions regarding agitation speed and temperature were set and controlled in the apparatus depicted in Fig. 5. This device consists of two vessels, each with their individual agitation and heating systems controlled by PID controllers. The presence of the two vessels was a measure to ensure a constant temperature during addition of reagents and reaction. Thus, reagents were heated to the desired temperature in different vessels rather than jointly so as to initiate the thermal reaction at the exact temperature of the experiment instead of having it started by the time the set temperature was reached. When both reached the desired temperature, EtCarb was added to the vessel in which Gly was being heated in order to avoid any loss of reagent given its viscosity. Samples were acquired at several time values throughout experimentation.
image file: c4ra11209a-f5.tif
Fig. 5 Schematic representation of the device employed for the kinetic experiments.

Analytical methods

Samples were diluted in a 5 g L−1 citric acid (internal standard) solution for HPLC analysis in a JASCO 2000 series device, equipped with a refraction index detector. A constant flow rate of 0.5 mL min−1 of acid Milli-Q water (0.005 N H2SO4) was used as mobile phase. Separation was realized using a Rezex ROA-Organic Acid H+ (8%) column (150 × 7.80 mm) at 60 °C.

Mathematical analysis

Comparison of models and the final selection of the most appropriate were made following physical and statistical criteria. The main physical criterion when fitting models to all experimental data was an adequate value for each activation energy. Statistical criteria include narrow error intervals for the model constants computed and reasonable values for information and goodness-of-fit criteria.

Fischer's F is based on a null hypothesis which accounts for the adequacy of the model to the observed values of the variable compared to given values of F at 95% confidence (or other). It is defined according to the following equation

 
image file: c4ra11209a-t3.tif(7)
in which N is the total number of data, P is the number of parameters, SQR is the sum of quadratic residues, defined as (yi,expyi,calc)2, and yi,exp and yi,calc refer to the experimental and calculated values of the fitted variable, respectively. When defined as in eqn (7), this parameter reflects goodness-of-fit at the lowest number of predictors or constants of the model possible, being better when its value is high.

Furthermore, the Akaike's information criterion (AIC) has been regarded given that it has previously been applied as a standard of judgment for kinetic model discrimination.53,54 This parameter relates the amount of experimental data available to the number of parameters of the model proposed and is defined following eqn (8), being the model better when the AIC value, always negative, is lower:55

 
image file: c4ra11209a-t4.tif(8)

In addition to the F and AIC, the residual mean squared error (RMSE) has been regarded as measure of the difference of the values of the variable being evaluated predicted by the model to those obtained experimentally considering, once again, the number of data available together with the parameters.54 As this parameter is related to the sum of variances, the better the model fits to data, the lower the value of RMSE is:

 
image file: c4ra11209a-t5.tif(9)

Finally, if the variation between adjacent data is considered, the percentage of variation explained (VE) also gives information of the quality of fit for each measured variable, being best when all experimental trends are well explained by the tested model (a value near or equal to 100%). It is quantified using eqn (10):

 
image file: c4ra11209a-t6.tif(10)
where SSQj and SSQmeanj are defined according to eqn (11) and (12), respectively:
 
image file: c4ra11209a-t7.tif(11)
 
image file: c4ra11209a-t8.tif(12)
and
 
image file: c4ra11209a-t9.tif(13)

In eqn (11) through (13), ζl is the heteroscedasticity parameter, which is a measure of the type of error in the measured variable. When the value of this parameter is not fixed, as such was the case, Aspen Custom Modeler considers ζl = 1 by default.

Definitions

Conversion (X): The explanation of the results obtained was based on the conversion X defined as follows rather than the concentrations of the components given that only one key component is necessary when the reacting system considered consists of one reaction. This variable can be defined given that all the reactants and products of the transesterification reaction can be quantified by the analytical method presented above. Subsequently, the conversion is defined as the ratio of the average of the extents of reaction of the reactants and products related to the initial concentration of Gly, which is always the limiting reactant.
 
image file: c4ra11209a-t10.tif(14)
in which Ci, Ci0 denote the concentration of each component at a definite time and initially, CGly0 is the initial concentration of Gly, νi refers to the stoichiometric coefficient and n is the total number of components.

Green metrics parameters

The following definitions adapted from Constable et al. (2002)34 were followed as a means to measure the degree of sustainability of the process under study as well as those found in literature.

The atom economy (AE) is defined as the ratio of the summation of the molecular weights of the desired products to that of the reagents utilized.

 
image file: c4ra11209a-t11.tif(15)

The E-factor computes the mass of waste generate per unit mass of the products.

 
image file: c4ra11209a-t12.tif(16)

The carbon efficiency (CE) regards the amount of carbon that transits from the reactants to the desired end products.

 
image file: c4ra11209a-t13.tif(17)

The mass productivity (MP) accounts for the mass of the actual product in relation to the total mass of material utilized in the process.

 
image file: c4ra11209a-t14.tif(18)

Finally, the reaction mass efficiency (RME) considers the total actual mass of the products to the mass of reagents used.

 
image file: c4ra11209a-t15.tif(19)

Conclusions

Simultaneous synthesis of glycerol carbonate and ethylene glycol was found to take place in the absence of any catalyst at temperatures higher than 80 °C, though significant reactivity exists only at 100 °C or higher temperature. This process can be envisaged as a glycerol transcarbonation with an organic carbonate or as an ethylene carbonate glycerolysis.

It was observed by means of a FBRM probe that the system constituted a dispersion-like liquid–liquid biphasic system from 25 °C to 80 °C, decreasing the droplet size and number as temperature increased, till it was monophasic.

A thermodynamic study determined that the reaction was almost irreversible at 100 °C or higher temperature. A kinetic study served to determine by statistical means that an overall second order potential model, accounting only for the direct reaction, represents adequately the transesterification of ethylene carbonate and glycerol in these conditions.

Finally, a comparative study with other references found in literature regarding the sustainability of the process was conducted; proving that the thermal process herein studied could play an attractive role when taking into account the sustainability of the process, according to common green metric parameters.

Nomenclature

Components

EtCarbEthylene carbonate
MEGEthylene glycol
GlyCarbGlycerol carbonate
GlyGlycerol

Nomenclature

AEAtom economy (eqn (15))
AICAkaike's information criterion
CConcentration of the components at a given time (mol L−1)
CECarbon efficiency (eqn (17))
CpSpecific heat capacity (J mol−1 K−1)
Eaj/RRatio of activation energy and the ideal gas constant (K)
FFischer's F statistical parameter at 95% confidence
FBRMFocused beam reflectance measurement
HEnthalpy (kJ mol−1)
HPLCHigh-performance liquid chromatography
KThermodynamic constant of equilibrium
k1…5Kinetic constants for the tested models
kj0Preexponential factor of the kinetic constant
lReferenced individual variable in eqn (11)–(13).
MInitial molar ratio of dimethyl carbonate to glycerol
MPMass productivity (eqn (17))
NTotal number of components
NTotal number of data to which a model is fitted
PNumber of parameters of a proposed model
rReaction rate (mol L−1 min−1)
RIdeal gas constant (J mol−1 K−1)
RMEReaction mass efficiency
RMSEResidual mean squared error
SEntropy (J mol−1 K−1)
SQRSum of quadratic residues
SSStirring speed (rpm)
TTemperature (K)
VEVariation explained (%)
xMolar fraction
XConversion, as defined by eqn (14)

Greek letters

γActivity coefficient
δVariation
ζHeteroscedasticity parameter
νStoichiometric coefficient of the component i
ωAgitation rate (rpm)

Subscripts

0Relative to the start of the reaction, time equals zero
catRelative to the catalyst
fRelative to formation (enthalpy)
iRelative to component i
jRelative to reaction j (j = 1, direct reaction; j = 2, reverse reaction)
rRelative to reaction (enthalpy and entropy)

Superscripts

0Relative to standard conditions

Acknowledgements

The authors would like to express their gratitude to the Ministerio de Ciencia e Innovación of the Government of Spain for financial support of the project CTQ 2010-15460.

References

  1. M. Pagliaro and M. Rossi, The future of glycerol. New uses for a versatile new material, RSC Publishing, Cambridge, 2008 Search PubMed.
  2. A. Behr, J. Eilting, K. Irawadi, J. Leschinski and F. Lindner, Green Chem., 2008, 10, 13–30 RSC.
  3. M. O. Sonnati, S. Amigoni, E. P. T. de Givenchy, T. Darmanin, O. Choulet and F. Guittard, Green Chem., 2013, 15, 283–306 RSC.
  4. H. Hensen, T. Loehl, H. Tesmann and J. Kahre, Patent DE19756454, 1999.
  5. C.-H. Chen, Y. E. Hyung, D. R. Vissers and K. Amine, US20030157413 A1, 2002.
  6. P. Lameiras, L. Boudesocque, Z. Mouloungui, J.-H. Renault, J.-M. Wieruszeski, G. Lippens and J.-M. Nuzillard, J. Magn. Reson., 2011, 212, 161–168 CrossRef CAS PubMed.
  7. M. Benoit, Y. Brissonnet, E. Guélou, K. De Oliveira Vigier, J. Barrault and F. Jérôme, ChemSusChem, 2010, 3, 1304–1309 CrossRef CAS PubMed.
  8. A. S. Kovvali and K. K. Sirkar, Ind. Eng. Chem. Res., 2002, 41, 2287–2295 CrossRef CAS.
  9. C. Magniont, G. Escadeillas, C. Oms-Multon and P. De Caro, Cem. Concr. Res., 2010, 40, 1072–1080 CrossRef CAS PubMed.
  10. D. V. Palaskar, P. S. Sane and P. P. Wadgaonkar, React. Funct. Polym., 2010, 70, 931–937 CrossRef CAS PubMed.
  11. G. Rokicki, P. Rakoczy, P. Parzuchowski and M. Sobiecki, Green Chem., 2005, 7, 529–539 RSC.
  12. Z. Mouloungui and S. Pelet, Eur. J. Lipid Sci. Technol., 2001, 103, 216–222 CrossRef CAS.
  13. D. Herault, A. Eggers, A. Strube and J. Reinhardt, Patent DE10110855-A1, 2003.
  14. J. W. Yoo and Z. Mouloungui, Nanotechnology in Mesostructured Materials, 2003, vol. 146, pp. 757–760 Search PubMed.
  15. A. Dibenedetto, A. Angelini, M. Aresta, J. Ethiraj, C. Fragale and F. Nocito, Tetrahedron, 2011, 67, 1308–1313 CrossRef CAS PubMed.
  16. V. Calvino-Casilda, G. Mul, J. F. Fernandez, F. Rubio-Marcos and M. A. Banares, Appl. Catal., A, 2011, 409, 106–112 CrossRef PubMed.
  17. F. Rubio-Marcos, V. Calvino-Casilda, M. A. Banares and J. F. Fernandez, J. Catal., 2010, 275, 288–293 CrossRef CAS PubMed.
  18. M. Aresta, A. Dibenedetto, F. Nocito and C. Ferragina, J. Catal., 2009, 268, 106–114 CrossRef CAS PubMed.
  19. M. J. Climent, A. Corma, P. De Frutos, S. Iborra, M. Noy, A. Velty and P. Concepción, J. Catal., 2010, 269, 140–149 CrossRef CAS PubMed.
  20. M. Aresta, A. Dibenedetto, F. Nocito and C. Pastore, J. Mol. Catal. A: Chem., 2006, 257, 149–153 CrossRef CAS PubMed.
  21. J. George, Y. Patel, S. M. Pillai and P. Munshi, J. Mol. Catal. A: Chem., 2009, 304, 1–7 CrossRef CAS PubMed.
  22. C. Vieville, J. W. Yoo, S. Pelet and Z. Mouloungui, Catal. Lett., 1998, 56, 245–247 CrossRef CAS.
  23. J. Hu, J. Li, Y. Gu, Z. Guan, W. Mo, Y. Ni, T. Li and G. Li, Appl. Catal., A, 2010, 386, 188–193 CrossRef CAS PubMed.
  24. J. B. Bell, L. Silver and V. A. Currier, Patent US2915529, 1959.
  25. J. Li and T. Wang, React. Kinet., Mech. Catal., 2011, 102, 113–126 CrossRef CAS.
  26. J. R. Ochoa-Gomez, O. Gomez-Jimenez-Aberasturi, B. Maestro-Madurga, A. Pesquera-Rodriguez, C. Ramirez-Lopez, L. Lorenzo-Ibarreta, J. Torrecilla-Soria and M. C. Villaran-Velasco, Appl. Catal., A, 2009, 366, 315–324 CrossRef CAS PubMed.
  27. A. Takagaki, K. Iwatani, S. Nishimura and K. Ebitani, Green Chem., 2010, 12, 578–581 RSC.
  28. M. G. Alvarez, A. M. Segarra, S. Contreras, J. E. Sueiras, F. Medina and F. Figueras, Chem. Eng. J., 2010, 161, 340–345 CrossRef CAS PubMed.
  29. Y. Patel, J. George, S. M. Pillai and P. Munshi, Green Chem., 2009, 11, 1056–1060 RSC.
  30. M. G. Álvarez, A. M. Frey, J. H. Bitter, A. M. Segarra, K. P. de Jong and F. Medina, Appl. Catal., B, 2013, 134–135, 231–237 CrossRef PubMed.
  31. M. G. Álvarez, M. Plíšková, A. M. Segarra, F. Medina and F. Figueras, Appl. Catal., B, 2012, 113–114, 212–220 CrossRef PubMed.
  32. Z. Mouloungui, J. Yoo, C. Gachen, A. Gaset, G. Vermeersch and J. W. Yoo, FR2733232-A, EP739888-A, EP739888-A1, FR2733232-A1, 2000.
  33. H.-J. Cho, H.-M. Kwon, J. Tharun and D.-W. Park, J. Ind. Eng. Chem., 2010, 16, 679–683 CrossRef CAS PubMed.
  34. D. J. C. Constable, A. D. Curzons and V. L. Cunningham, Green Chem., 2002, 4, 521–527 RSC.
  35. J. W. van Hal, J. S. Ledford and X. Zhang, Catal. Today, 2007, 123, 310–315 CrossRef CAS PubMed.
  36. K. M. C. C. Kawabe, EP 1125915 A1, 2005.
  37. K. M. C. C. Kawabe, US 09/271,435, 2000.
  38. A. R. Heath, P. A. Bahri, P. D. Fawell and J. B. Farrow, AIChE J., 2006, 52, 1987–1994 CrossRef.
  39. A. Blanco, E. Fuente, C. Negro and J. Tijero, Can. J. Chem. Eng., 2002, 80, 734–740 CAS.
  40. J. A. Boxall, C. A. Koh, E. D. Sloan, A. K. Sum and D. T. Wu, Ind. Eng. Chem. Res., 2009, 49, 1412–1418 CrossRef.
  41. W. Wang, J. Liu, P. Wang, J. Duan and J. Gong, Chem. Eng. Sci., 2013, 91, 173–179 CrossRef CAS PubMed.
  42. J. Li and T. Wang, J. Chem. Thermodyn., 2011, 43, 731–736 CrossRef CAS PubMed.
  43. J. Dean, Lange's Handbook of Chemistry, New York, 1999 Search PubMed.
  44. S. P. Verevkin, V. N. Emel'yanenko, A. V. Toktonov, Y. Chernyak, B. Schaeffner and A. Boerner, J. Chem. Thermodyn., 2008, 40, 1428–1432 CrossRef CAS PubMed.
  45. S. P. Verevkin, A. V. Toktonov, Y. Chernyak, B. Schaeffner and A. Boerner, Fluid Phase Equilib., 2008, 268, 1–6 CrossRef CAS PubMed.
  46. I. Vasilev and A. Korkhov, Transactions on Chemistry and Chemical Technology, 1974, 36, 103–105 Search PubMed.
  47. N. N. Ezhova, I. G. Korosteleva, N. V. Kolesnichenko, A. E. Kuz'min, S. N. Khadzhiev, M. A. Vasil'eva and Z. D. Voronina, Pet. Chem., 2012, 52, 91–96 CrossRef CAS.
  48. B. Poling, J. Prausnitz and J. O'Connell, The properties of gases and liquids, New York, 2001 Search PubMed.
  49. V. Ruzicka and E. S. Domalski, J. Phys. Chem. Ref. Data, 1993, 22, 619–657 CrossRef CAS PubMed.
  50. T. Keller, J. Holtbruegge, A. Niesbach and A. Górak, Ind. Eng. Chem. Res., 2011, 50, 11073–11086 CrossRef CAS.
  51. R. Alenezi, G. A. Leeke, J. M. Winterbottom, R. C. D. Santos and A. R. Khan, Energy Convers. Manage., 2010, 51, 1055–1059 CrossRef CAS PubMed.
  52. A. T. Williamson and C. N. Hinshelwood, Trans. Faraday Soc., 1934, 30, 1145–1148 RSC.
  53. J. J. Knol, J. P. H. Linssen and M. A. J. S. van Boekel, Food Chem., 2010, 120, 1047–1057 CrossRef CAS PubMed.
  54. M. Ladero, M. de Gracia, J. J. Tamayo, I. L. d. Ahumada, F. Trujillo and F. Garcia-Ochoa, Chem. Eng. J., 2011, 169, 319–328 CrossRef CAS PubMed.
  55. H. Akaike, IEEE Trans. Autom. Control, 1974, 19, 716–723 CrossRef.

Footnote

Electronic supplementary information (ESI) available. See DOI: 10.1039/c4ra11209a

This journal is © The Royal Society of Chemistry 2014
Click here to see how this site uses Cookies. View our privacy policy here.