Topotactic synthesis and photocatalytic performance of one-dimensional ZnNb2O6 nanostructures and one-dimensional ZnNb2O6/KNbO3 hetero-nanostructures

Xingang Kong*ad, Zhanglin Guoa, Puhong Wenb, Liyun Caoa, Jianfeng Huanga, Cuiyan Lia, Jie Feia, Fen Wanga and Qi Fengc
aSchool of Materials Science and Engineering, Shaanxi University of Science and Technology, Weiyang, Xi'an, Shaanxi 710021, PR China. E-mail: yezhu_1983@163.com
bDepartment of Chemistry and Chemical Engineering, Baoji University of Arts and Science, 1 Gaoxin Road, Baoji, Shaanxi 721013, PR China
cDepartment of Advanced Materials Science, Faculty of Engineering, Kagawa University, 2217-20 Hayashi-cho, Takamatsu-shi, 761-0396 Japan
dAnhui Deli Household Glass Co., Ltd., Fengyang Gate Taiwan Industrial Park, Anhui 223121, PR China

Received 18th September 2014 , Accepted 21st October 2014

First published on 27th October 2014


Abstract

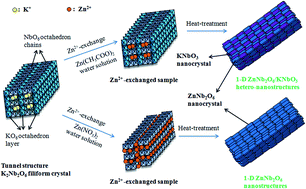
This paper introduces one-dimensional ZnNb2O6/KNbO3 hetero-nanostructures and one-dimensional ZnNb2O6 nanostructures. These nanostructures are synthesized via in situ topotactic structural transformation reaction using the tunnel structure K2Nb2O6 filiform crystal as precursor. Firstly, Zn2+ ions intercalate into K2Nb2O6 crystal by exchanging K+ ions from the K2Nb2O6 crystal with Zn2+ from Zn(NO3)2 or Zn(CH3COO)2 aqueous solution, to form two different Zn2+-exchanged samples, and then these Zn2+-exchanged samples topotacticly transform into one-dimensional ZnNb2O6/KNbO3 hetero-nanostructures and ZnNb2O6 nanostructures during heat-treatment. The formation reaction and structure of these samples were characterized by X-ray diffraction (XRD), field-emission scanning electron microscopy (FE-SEM), transmission electron microscopy (TEM), selected-area electron diffraction (SAED), and energy-dispersive spectroscopy (EDS). Photocatalytic experiments showed that one-dimensional ZnNb2O6/KNbO3 hetero-nanostructures and ZnNb2O6 nanostructures have excellent photocatalytic performance for the degradation of methylene blue (MB), rhodamine B (RhB), and methyl orange (MO).

Introduction

The soft chemical process is a useful and unique method for preparation and design of function inorganic materials.1–3 This process typically comprises two steps: the first step is the preparation of a framework precursor with layered or tunnel structure and insertion of template ions or molecules into the interlayer space by ion-exchange reaction, and the second step is the transformation of the template-inserted precursor into a desired structure by the soft chemical method, such as solvothermal treatment, ion-exchange treatment and low temperature heat-treatment. The crystal structure of the product can be controlled by the used template, and the product particle morphology is dependent on the morphology of the used precursor. This method has been utilized for the synthesis and design of metal oxides and nanocomposites with controlled structure, morphology, and chemical composition.4–6

Chemical composition, structure, morphology, and grain size of semiconductor materials as photocatalysts are some key issues that influence the photocatalytic capability.7–9 Because photocatalytic reactions are typically surface-based processes and the photocatalytic efficiency is closely related to the morphology and micro-structure of the material. One-dimensional (1D) nanostructures and hetero-nanostructures such as wires, belts and tubes have attracted considerable attention for photocatalytic applications due to their distinct electronic, optical and chemical properties, which differ from their bulk counterparts.10–12

Among all the semiconductor photocatalysts reported, some niobates showed certain photocatalytic performance, such as KNbO3,13 NaNbO3,14 K4Nb6O17,15 CaNb2O6,16 pyrochlore type K2Nb2O6,17 Sn2Nb2O7,18 Nb4+ self-doped K4Nb6O17,19 SnNb2O6–graphene nanocomposite20 and so on. ZnNb2O6, with a columbite structure, has received a great deal of attention due to its microwave dielectric, photoluminescence and photocatalytic properties.21,22 Most studies have found that ZnNb2O6 show photocatalytic activity for water splitting and degradation of diverse organic pollutants.22–24 Currently, its main synthesis approaches includes traditional solid-state,21 sol–gel,23 hydrothermal24 and molten-salt method.25 Until now, however, 1D nanostructures and hetero-nanostructures ZnNb2O6 have not been reported because these methods mentioned above are difficult to simultaneously control chemical composite, grain size, morphology and nanostructure.

In our previous study of controlling morphology and chemical composition, we used the layered structure titanate H1.07T1.73O4·nH2O particles with plate-like morphology as precursor to prepare some plate-like particles (BaTiO3, Ba0.9Ca0.1TiO3, Ba0.5(Bi0.5K0.5)0.5TiO3) by the soft chemical process.26,27 In the soft chemical process, the layered structure of HTO precursor is transformed into the perovskite structure by an in situ topotactic transition reaction, and the precursor morphology is remained after the reaction. In this paper, therefore, an in situ topotactic structural transformation synthesis of 1D nanostructures ZnNb2O6 and hetero-nanostructures ZnNb2O6/KNbO3 is described in detail and their formation reaction mechanism is clarified. In addition, the photocatalytic activities of these materials are discussed.

Experimental section

Preparation of K2Nb2O6 precursor

The starting material of the tunnel structure potassium niobate K2Nb2O6·nH2O fibrous crystal was prepared using the method described in literature.28 5 g of Nb2O5 and 30 mL of 3 mol L−1-KOH water solution were placed in a Teflon-lined, sealed stainless-steel vessel with an inner volume of 85 mL, and then hydrothermally treated at 200 °C for 2 h under stirring conditions. After the hydrothermal treatment, a potassium hexaniobate clear solution was obtained. Potassium hexaniobate was precipitated out from this solution by adding the ethanol into the solution. The precipitate was filtered, washed with ethanol, and then dried at room temperature. 0.5 g of potassium hexaniobate and 30 mL of 0.5 mol L−1-KOH water–ethanol (volume ratio = 1/1) solution were added into a Teflon-lined, sealed stainless-steel vessel with an inner volume of 85 mL, and then solvothermally treated at 230 °C for 12 h under stirring conditions. After the solvothermal treatment, the tunnel structure K2Nb2O6·nH2O fibrous crystal sample was filtered, washed with distilled water, and then dried at room temperature.

Preparation of ZnNb2O6 and ZnNb2O6/KNbO3

0.5 g of K2Nb2O6·nH2O samples were respectively put into 200 mL of 0.5 mol L−1-Zn(CH3COO)2 and 0.5 mol L−1-Zn(NO3)2 aqueous solution, then stirred and ion-exchanged for 24 h at room temperature. The ion-exchange treatment was performed twice for the complete exchange. After ion-exchange, the products were filtered, washed with distilled water, and dried at room temperature. The Zn2+-exchanged samples were obtained. Finally, the Zn2+-exchanged samples were heat-treated at 570 °C for 2 h, to respectively obtain ZnNb2O6 and ZnNb2O6/KNbO3 samples.

Physical analysis

The crystal structure of the sample was investigated using a powder X-ray diffractometer (Shimadzu, Model XRD-6100) with Cu Kα (λ = 0.15418 nm) radiation. The size and morphology of the particles were observed using scanning electron microscopy (SEM) (Hitachi, Model S-900). Transmission electron microscopy (TEM) observation and selected-area electron diffraction (SAED) were performed on a JEOL Model JEM-3010 system at 300 kV, and the powder sample was supported on a micro grid. Chemical composition analysis was carried out with energy dispersive spectroscopy (EDS) (JEOL Model JED-2300T) on the TEM system. Thermo gravimetric and differential thermal analyses (TG-DTA) were conducted on a DTG-60Hthermogravimetric analyzer (SHIMADZU). UV-vis absorption spectra were recorded on a UV/vis/NIR Spectrophotometer (LAMBDA950, PerkinElmer).

The photocatalytic performance of samples were evaluated by degradation of methylene blue (MB), rhodamine B (RhB), and methyl orange (MO) under xenon lamp irradiation. In each experiment, 50 mg of samples were added into the solution (50 mL, 10 mg L−1). The suspensions were magnetically stirred in dark for 40 min to ensure the establishment of an adsorption–desorption equilibrium. Then, the solution was exposed to the lamp irradiation under magnetic stirring. At different irradiation time intervals, 6 mL of the solution was collected with centrifugation. The concentration of the remnant dye in the collected solution was monitored by UV-vis spectroscopy (Unico UV-2600) each 5 or 10 min.

Result and discussion

Zn2+-exchange of tunnel structure K2Nb2O6

In the previous study,28 we have reported a tunnel structure K2Nb2O6, which is composed of NbO6 double chains and KO6 octahedron layers with the K+ occupying the tunnel sites, and a single crystal with filiform shape. Similar to the most metal oxides with tunnel structure, e.g. zeolites, tunnel structure manganese oxides,29,30 layered niobates of KNb3O8 and K4Nb6O17,31,32 K+ ions in the tunnel structure K2Nb2O6 can be exchanged with other cation by ion-exchange treatment.

Fig. 1 is the XRD patterns of samples obtained by the ion-exchange of K2Nb2O6 with Zn2+ ion. The precursor K2Nb2O6 possessed a characteristic peak of tunnel structure at 2θ = 10° nearby and the fine crystallinity (Fig. 1a). When the K2Nb2O6 precursor was respectively treated by ion-exchange in 0.5 mol L−1-Zn(NO3)2 and 0.5 mol L−1-Zn(CH3COO)2 aqueous solution, the Zn2+-exchanged samples were formed (Fig. 1b and c). Although the crystallinity of Zn2+-exchanged samples decreased, they retained the tunnel structure because of existing the characteristic peak at 2θ = 10° nearby in their XRD patterns (Fig. 1b and c). The FE-SEM result reveals that the Zn2+-exchanged samples all retained the filiform morphology of precursor after the Zn2+-exchange process (Fig. 2).


image file: c4ra10713f-f1.tif
Fig. 1 XRD patterns of (a) the tunnel structure K2Nb2O6 and the Zn2+-exchanged samples obtained in (b) Zn(NO3)2 and (c) Zn(CH3COO)2 solution, respectively.

image file: c4ra10713f-f2.tif
Fig. 2 FE-SEM images of (a) the tunnel structure K2Nb2O6 niobate and the Zn2+-exchanged samples obtained in (b) Zn(NO3)2 and (c) Zn(CH3COO)2 solution, respectively.

The chemical composite analysis result revealed that the mole ratio of K, Zn and Nb was 0.4/0.6/1 in the Zn2+-exchanged sample obtained in Zn(CH3COO)2 aqueous solution. This indicated that K+ ions in the K2Nb2O6 precursor cannot be completely exchanged with Zn2+ ions in Zn(CH3COO)2 aqueous solution. This is similar to the our previous report that K+ ions in the K2Nb2O6 precursor cannot be completely exchanged by Li+ ions in LiCl aqueous solution.28 In the Zn2+-exchanged sample obtained from Zn(NO3)2 aqueous solution, however, no K component is detected, and the mole ratio of Zn and Nb is 0.99/1. This reason is that the 0.5 mol L−1-Zn(CH3COO)2 aqueous solution close to neutral (pH = 6.7 by actual measurement), whereas the Zn(NO3)2 aqueous solution is acidity (pH = 4.1 by actual measurement), meanwhile, the KO6 octahedral layers in the tunnel structural framework is not steady and easily reacted with H+ in the acid environment,28 resulting in the KO6 octahedral layers dissolved out. These results suggested that the acid-base property in the ion-exchange system have an effect on the K+ exchange process of K2Nb2O6. But Zn2+ ion can react with OH, forming Zn(OH)2 precipitate at alkaline condition, we did not systematically research the pH effect over Zn2+-exchange reaction system.

Structure transition reaction

The tunnel structure K2Nb2O6 filiform crystal can topotacticly transform into the pure perovskite KNbO3 (noted as KNbO3-HT) filiform crystal via heat-treatment (Fig. 3a).28 Therefore, we heat-treated the Zn2+-exchanged samples according to their TG-DTA curves (Fig. 4). Two types of Zn2+-exchanged samples obtained respectively in the Zn(CH3COO)2 and Zn(NO3)2 solution showed the different exothermic peaks without weight loss around 528 and 560 °C, which correspond to the phase transformations. Thus, the heat-treatments were processed at 570 °C.
image file: c4ra10713f-f3.tif
Fig. 3 XRD patterns of (a) the KNbO3 sample obtained by heat-treating the tunnel structure K2Nb2O6 sample, the samples obtained by heat-treating the Zn2+-exchanged samples from (b) Zn(CH3COO)2 and (c) Zn(NO3)2 solution, and (d) the ZnNb2O6 sample obtained by solid-state method.

image file: c4ra10713f-f4.tif
Fig. 4 TG-DTA curves of the Zn2+-exchanged samples from (a) Zn(CH3COO)2 and (b) Zn(NO3)2 solution, respectively.

Fig. 3 presented the XRD patterns of the heat-treated samples. It is found that the mixed phase of columbite ZnNb2O6 (JCPDS file no. 37-1371) and perovskite KNbO3 (JCPDS file no. 32-0822) were formed after the heat-treatment of the Zn2+-exchanged sample obtained in Zn(CH3COO)2 solution (Fig. 3b). While the Zn2+-exchanged sample obtained in Zn(NO3)2 solution transformed into a pure columbite phase ZnNb2O6 (noted as ZnNb2O6-HT) (JCPDS file no. 37-1371) after the heat-treatment (Fig. 3c). The chemical composite analysis indicated that the mole ratios of K, Zn and Nb are the same in samples before and after the heat-treatment. Above results suggested that the Zn2+-exchanged niobate samples can transform into the columbite ZnNb2O6 by soft chemical heat-treatment process.

The FE-SEM images revealed that the mixed phase sample and the ZnNb2O6-HT sample still keep the filamentous morphology of precursor after the heat-treatment (Fig. 5). It can be clearly seen that the mixed phase filamentous particle was constructed from nanocube with a size of ∼20 nm (Fig. 5a), meaning a polycrystalline. And the ZnNb2O6-HT filamentous particle was also a polycrystalline which consists of the needle-like nanocrystals with a size of ∼10 nm (Fig. 5b). Nevertheless, the solid-state method can only synthesized ZnNb2O6 sample (ZnNb2O6-solid) with sphere morphology and a size of 500 nm (Fig. 5c). These results suggested that the filamentous morphology of products depends on the filiform morphology of the tunnel structure K2Nb2O6 precursor. Therefore, the transformation reactions from tunnel structure K2Nb2O6 to columbite structure ZnNb2O6 and perovskite structure KNbO3 were topotactic structural transition reactions.


image file: c4ra10713f-f5.tif
Fig. 5 FE-SEM images of the samples obtained by heat-treating the Zn2+-exchanged samples from (a) Zn(NO3)2 and (b) Zn(CH3COO)2 solution, and (c) the ZnNb2O6 sample obtained by solid-state method.

Nanostructure study

Similar to the SEM results, the TEM images also showed that the mixed phase sample and the ZnNb2O6-HT sample have filamentous shapes (Fig. 6). In HRTEM image of the mixed phase sample (Fig. 6b), it can be observed the lattice image of ZnNb2O6 structure with lattice spacing of d(002) = 0.368 and the lattice image of KNbO3 structure with lattice spacing of d(110) = 0.286, in addition a grain boundary existing between the (002) plane of the ZnNb2O6 phase and the (110) plane of the KNbO3 phase. It was demonstrated that the columbite ZnNb2O6 and the perovskite KNbO3 phases coexisted in one filamentous particle. Therefore, it can be confirmed that the mixed phase polycrystalline fiber was a ZnNb2O6/KNbO3 nanocomposite (noted as ZnNb2O6/KNbO3-HT), meaning a 1-D hetero-nanostructures.
image file: c4ra10713f-f6.tif
Fig. 6 TEM (a) and HRTEM image (b) of the samples obtained by heat-treating the Zn2+-exchanged samples from Zn(CH3COO)2 solution, and TEM image(c) and SAED pattern (d) of the samples obtained by heat-treating the Zn2+-exchanged samples from Zn(NO3)2 solution.

It was interesting that although the ZnNb2O6-HT sample was a polycrystalline fiber, it showed a SAED pattern similar to a ZnNb2O6 single crystal (Fig. 6c). In SAED pattern of ZnNb2O6-HT sample (Fig. 6d), the d-values of diffraction spots were 0.254 and 0.369 nm, which corresponded to the (440) and (002) planes of the ZnNb2O6 structure, respectively. This indicated that all the needle-like nanocrystals in each fiber were arranged in the same crystal-axis orientation, meaning perfectly oriented polycrystalline fiber, and the fiber-axis direction directs to the [110]-axis direction of the ZnNb2O6 structure. In our previous report,28 the fiber axis direction of precursor was [010]-axis direction of the K2Nb2O6 tunnel structure. It implied that the [010]-axis direction of K2Nb2O6 tunnel structure transformed into the [110]-axis direction of ZnNb2O6 columbite structure and there was a corresponding relation between them. Therefore, the polycrystalline ZnNb2O6-HT fiber was a 1-D nanostructures with [110]-crystal-axis orientation.

The above results revealed that ZnNb2O6/KNbO3 1-D hetero-nanostructures and ZnNb2O6 1-D nanostructures with crystal-axis orientation can be fabricated by the topotactic structural transformation of the tunnel structure K2Nb2O6 fiber.

Formation reaction mechanism

A schematic representation of the formation mechanism of one-dimensional ZnNb2O6 nanostructures and ZnNb2O6/KNbO3 hetero-nanostructures in the two-step soft chemical process was given in Fig. 7. When the ion-exchange treatment of tunnel structure K2Nb2O6 filiform crystal was operated in near neutral Zn(CH3COO)2 solution, firstly Zn2+ ions intercalate into K2Nb2O6 crystal by the exchange K+ in tunnel pathway of K2Nb2O6 crystal with Zn2+ ions, and then these Zn2+ ions and KO6 layer react with NbO6 double chains to form the ZnNb2O6/KNbO3 composite phase by an in situ topotactic structural transformation reaction during heat-treatment.27,29 Nevertheless, in Zn(NO3)2 solution, not only K+ ions in tunnel but also in KO6 layer of K2Nb2O6 crystal were exchanged out by Zn2+ ions. It is well known that the Zn(NO3)2 aqueous solution presents acidity and the KO6 layer of K2Nb2O6 crystal is not steady in this acidic system and easily reacted with H+ ions and dissolved, leading that the Zn2+ ions filled among the NbO6 double chains. In the heat-treatment process, the Zn2+ ions reacted with the NbO6 double chains and formed the pure ZnNb2O6 phase by in situ topotactic structural transformation reaction. Since the topotactic structural transformation reaction occurs in ion-exchanged sample, ZnNb2O6/KNbO3 hetero-nanostructures and ZnNb2O6 nanostructures, as shown in Fig. 5, were respectively formed and all remained the one-dimensional fibrous shape of precursor. The mechanism described above suggests that the acid–base property of the system during ion-exchange can determine the selective formation of 1-D ZnNb2O6 nanostructures and 1-D ZnNb2O6/KNbO3 hetero-nanostructures.
image file: c4ra10713f-f7.tif
Fig. 7 Formation mechanism of one-dimensional ZnNb2O6 nanostructures and ZnNb2O6/KNbO3 hetero-nanostructures from K2Nb2O6.

UV-vis absorption spectra analysis

Fig. 8a showed the UV-vis diffuse reflectance spectra of samples. It can be noticed that all of the samples exhibited absorption bands in the UV light region. The sphere ZnNb2O6-solid sample showed strong absorption in the UV-light regions (250−320 nm). The filiform ZnNb2O6-HT sample presented slight red-shift of absorption edge (270−350 nm) relative to ZnNb2O6-solid sample, and its color is the light orange, but ZnNb2O6-solid sample presents the white color (Fig. 8b and c). The reason is that the nanocrystal size of ZnNb2O6-HT sample is smaller than that of ZnNb2O6-solid sample (Fig. 5b and c) and the nanocrystal in ZnNb2O6-HT sample possess a higher internal stress of the nanocrystals relative to that of ZnNb2O6-solid sample, resulting in a red shift of the absorption edge.33 Theoretically, although a generally received opinion is that the ubiquitous blue shift of the absorption edge of nanocrystals is the result of the quantum size effect owing to the downsized crystals. The absorption of KNbO3-HT filamentous crystal sample was in the UV-light regions of 280–380 nm, but the filiform ZnNb2O6/KNbO3-HT sample showed the step-like absorption curve within wavelength regions of 250–400 nm, which was related to its nanocomposite structure.34 And its color was also the light orange (Fig. 8d). The differences in optical absorption of the different samples may be ascribed to their filiform shape and nanostructure.7–9
image file: c4ra10713f-f8.tif
Fig. 8 UV-vis diffuse reflectance spectra (a) and photos of (b) ZnNb2O6-solid sample, (c) ZnNb2O6-HT sample, and (d) ZnNb2O6/KNbO3-HT sample.

Photocatalytic performance

Fig. 9 displayed the temporal evolution of the spectral changes during the photodegradation of RhB over ZnNb2O6-solid sample under UV-light illumination. It can be seen that the absorbance of RhB at the maximum absorption wavelength (551 nm) was gradually decreased with the prolongation of the irradiation time, which was because the chromophoric structure of the dye was destroyed. After 100 min, the major absorption band displayed blue-shift, indicating the de-ethylation of RhB molecules.35
image file: c4ra10713f-f9.tif
Fig. 9 Time-dependent UV-vis absorption spectra of the RhB solution in the presence of the ZnNb2O6-solid sample.

Fig. 10 showed the photocatalytic performance (C/C0) versus UV-light irradiation time of samples for the degradation of methylene blue (MB), rhodamine B (RhB), and methyl orange (MO). The KNbO3-HT sample and the ZnNb2O6-solid sample displayed the degradation efficiency of about 80% for MB after UV-light irradiation for 40 min. Nevertheless, the ZnNb2O6-HT sample took about 10 min to reach the degradation efficiency of about 88% for MB. It is surprise that the ZnNb2O6/KNbO3-HT sample need only 5 min to reach to the degradation efficiency of about 90% for MB. It was found that the photocatalytic activities of both ZnNb2O6-HT and ZnNb2O6/KNbO3-HT sample were superior to that of KNbO3-HT and ZnNb2O6-solid samples for the degradation of MB. The similar results were also observed in the UV-light degradation process of RhB and MO (Fig. 9b and c). The reason is that the smaller the particle size, the higher the photocatalytic efficiency.7,8 These small nanocrystals in ZnNb2O6-HT and ZnNb2O6/KNbO3-HT samples are generally beneficial for surface-based photocatalysis. More importantly, the hetero-nanostructure of ZnNb2O6/KNbO3-HT samples may be responsible for its highest photocatalytic activity because the synergetic effect on photocatalytic performance may occur in the grain boundary between ZnNb2O6 nanocrystal and KNbO3 nanocrystal in 1D hetero-nanostructures.9,36,37 Herein, we cannot give its band gap structures for discussing the detailed photocatalytic mechanism, because our experimental conditions are restricted.


image file: c4ra10713f-f10.tif
Fig. 10 Photocatalytic degradation of (a) MB, (b) RhB, and (c) MO under UV-light irradiation using the KNbO3-HT sample, the ZnNb2O6-solid sample, the ZnNb2O6-HT, and the ZnNb2O6/KNbO3-HT sample.

Conclusion

The 1-D ZnNb2O6/KNbO3 hetero-nanostructures and 1-D ZnNb2O6 nanostructures were successfully synthesized by in situ structural transformation reaction. Firstly Zn2+ ions intercalate into K2Nb2O6 crystal by the exchange K+ ions in of K2Nb2O6 crystal with Zn2+ in Zn(CH3COO)2 or Zn(NO3)2 aqueous solution, respectively forming two types of Zn2+-exchanged samples. And then these Zn2+-exchanged samples topotacticly transformed into 1-D ZnNb2O6/KNbO3 hetero-nanostructures and 1-D ZnNb2O6 nanostructures during heat-treatment, respectively. These Zn2+ ions and KO6 layer react with NbO6 double chains to form the ZnNb2O6 and KNbO3 phase by an in situ topotactic structural transformation reaction during heat-treatment. 1-D ZnNb2O6/KNbO3 hetero-nanostructures and 1-D ZnNb2O6 nanostructures display excellent photocatalytic performance for the degradation MB, RhB and MO under ultraviolet irradiation. It is believed that the topotactic structural transformation process is an efficient method for designing and preparing other new types of nanostructures or hetero-nanostructures functional materials.

Acknowledgements

This work was financially supported by the Natural Science Basic Research Plan in Shaanxi Province of China (Program no. 2013JQ6012), the China Postdoctoral Science Foundation (Program no. 2013M542314), the research starting foundation from Shaanxi University of Science and Technology (BJ12-22), the Natural Science Foundation of China (no. 21173003& no. 51472153), and Innovation Team Assistance Foundation of Shaanxi Province (Grant no. 2013KCT-06).

References

  1. Q. Feng, M. Hirasawa and K. Yanagisawa, Chem. Mater., 2001, 13, 290 CrossRef CAS.
  2. Q. Feng, C. Honbu, K. Yanagisawa and N. Yamasaki, Chem. Lett., 1998, 757 CrossRef CAS.
  3. Q. Feng, C. Honbu, K. Yanagisawa and N. Yamasaki, Chem. Mater., 1999, 11, 2444 CrossRef CAS.
  4. J. Gopalakrishnan, S. Uma, K. K. Rangan and N. S. P. Bhuvanesh, P INDIAN AS-CHEM SCI, 1994, 106, 609 Search PubMed.
  5. Y. Komori, Y. Sugahara and K. Kuroda, Chem. Mater., 1999, 11, 3 CrossRef CAS.
  6. T. Sasaki, M. Watanabe, Y. Fujiki and Y. Kitami, Chem. Mater., 1994, 6, 1749 CrossRef CAS.
  7. Z. Jiang, Y. Tang, Q. Tay, Y. Zhang, O. Malyi, D. Wang, J. Deng, H. Zhou, X. Chen and Z. Chen, Adv. Energy Mater., 2013, 3, 1368 CrossRef CAS.
  8. A. Kubacka, M. Fernandez and G. Colon, Chem. Rev., 2011, 112, 1555 CrossRef PubMed.
  9. H. Tong, S. Ouyang, Y. Bi, N. Umezawa, M. Oshikiri and J. Ye, Adv. Mater., 2012, 24, 229 CrossRef CAS PubMed.
  10. Y. Bi and J. Ye, Chem.–Eur. J., 2010, 16, 10327 CrossRef CAS PubMed.
  11. Y. Bi and J. Ye, Chem. Commun., 2009, 43, 6551 RSC.
  12. S. Chatterjee, K. Bhattacharyya, P. Ayyub and A. Tyagi, J. Phys. Chem. C, 2010, 114, 9424 CAS.
  13. H. Shi, X. Li, D. Wang, Y. Yuan, Z. Zou and J. Ye, Catal. Lett., 2009, 132, 205 CrossRef CAS PubMed.
  14. Q. Ding, Y. Yuan, X. Xiong, R. Li, H. Huang, Z. Li, T. Yu, Z. Zou and S. Yang, J. Phys. Chem. C, 2008, 112, 18846 CAS.
  15. H. Hayashi, Y. Hakuta and Y. Kurata, J. Mater. Chem., 2004, 14, 2046 RSC.
  16. Y. Zhang, C. Liu, G. Pang, S. Jiao, S. Zhu, D. Wang, D. Liang and S. Feng, Eur. J. Inorg. Chem., 2010, 8, 1275 CrossRef.
  17. J. Wu, C. Zhou, Y. Zhao, L. Shang, T. Bian, L. Shao, F. Shi, L. Wu, C. Tung and T. Zhang, Chin. J. Chem., 2014, 32, 485–490 CrossRef CAS.
  18. C. Zhou, Y. Zhao, T. Bian, L. Shang, H. Yu, L. Wu, C. Tung and T. Zhang, Chem. Commun., 2013, 49, 9872–9874 RSC.
  19. C. Zhou, Y. Zhao, L. Shang, Y. Cao, L. Wu, C. Tung and T. Zhang, Chem. Commun., 2014, 50, 9554–9556 RSC.
  20. L. Yuan, M. Yang and Y. Xu, Nanoscale, 2014, 6, 6335–6345 RSC.
  21. S. Ji, S. Choi, J. Jang, E. Kim and J. Lee, J. Phys. Chem. C, 2009, 113, 17824 CAS.
  22. W. Wu, S. Liang, Z. Ding, H. Zheng and L. Wu, Solid State Sci., 2011, 13, 2019 CrossRef CAS PubMed.
  23. Y. Hsiao, T. Fang and L. Ji, Mater. Lett., 2010, 64, 2563 CrossRef CAS PubMed.
  24. J. Dai, C. Zhang, L. Shi, W. Song, P. Wu and X. Huang, Ceram. Int., 2012, 38, 1211 CrossRef CAS PubMed.
  25. L. Guo, J. Dai, J. Tian, Z. Zhu and T. He, Mater. Res. Bull., 2007, 42, 2013 CrossRef CAS PubMed.
  26. X. Kong, Y. Ishikawa, K. Shinagawa and Q. Feng, J. Am. Ceram. Soc., 2011, 94, 3716 CrossRef CAS PubMed.
  27. X. Kong, D. Hu, Y. Ishikawa, Y. Tanaka and Q. Feng, Chem. Mater., 2011, 23, 3978 CrossRef CAS.
  28. X. Kong, D. Hu, P. Wen, T. Ishii, Y. Tanaka and Q. Feng, Dalton Trans., 2013, 7699 RSC.
  29. Q. Feng, H. Kanoh and K. Ooi, J. Mater. Chem., 1999, 9, 319 RSC.
  30. P. Misaelides, Microporous Mesoporous Mater., 2011, 144, 15 CrossRef CAS PubMed.
  31. M. Bizeto, A. Shiguihara and V. Constantino, J. Mater. Chem., 2009, 19, 2512 RSC.
  32. H. Lin, T. Lee and C. Sie, Int. J. Hydrogen Energy, 2008, 33, 4055 CrossRef CAS PubMed.
  33. J. Huang, C. Xia, L. Cao and X. Zeng, Mater. Sci. Eng., B, 2008, 150, 187 CrossRef CAS PubMed.
  34. G. Tan, L. Zhang, H. Ren, S. Wei, J. Huang and A. Xia, ACS Appl. Mater. Interfaces, 2013, 5, 5186 CAS.
  35. L. Zhou, W. Wang, L. Zhang, H. Xu and W. Zhu, J. Phys. Chem. C, 2007, 111, 13659 CAS.
  36. W. Lu, J. Xiang, B. Timko, Y. Wu and C. M. Lieber, Proc. Natl. Acad. Sci. U. S. A., 2005, 102, 10046 CrossRef CAS PubMed.
  37. J. Xiang, W. Lu, Y. Hu, Y. Wu, H. Yan and C. M. Lieber, Nature, 2006, 441, 489 CrossRef CAS PubMed.

This journal is © The Royal Society of Chemistry 2014
Click here to see how this site uses Cookies. View our privacy policy here.