A highly sensitive method for simultaneous determination of the quaternary ammonium pesticides chlormequat and mepiquat in pears and potatoes by modified QuEChERS-high performance liquid chromatography-tandem mass spectrometry

Jieying Gao, Jian Wang, Ming Zuo, Li Ma, Yue Cui, Ting Yang and Min Ding*
Key Laboratory of Clinical Laboratory Diagnostics, Ministry of Education, College of Laboratory Medicine, Chongqing Medical University, Chongqing, 400016, P. R. China. E-mail: dingmin@cqmu.edu.cn; Fax: +86-23-68485992; Tel: +86-23-68485240

Received 18th September 2014 , Accepted 4th December 2014

First published on 15th December 2014


Abstract

A highly sensitive high-performance liquid chromatography-tandem mass spectrometry (HPLC-MS/MS) method for simultaneous determination of the quaternary ammonium pesticides chlormequat (CQ) and mepiquat (MQ) in pears and potatoes was developed and fully validated. The modified QuEChERS method was employed for sample preparation. A hydrophilic interaction liquid chromatography (HILIC) column was used for the chromatographic separation of highly polar analytes. The detection was performed by a triple quadrupole mass spectrometer with an electrospray ionization (ESI) source in positive ion mode by multiple reaction monitoring (MRM). The detailed fragmentation mechanisms of targeted analytes in MS/MS system were studied on the theoretical level using density functional theory (DFT) calculations. The limits of detection (LODs) were 0.021 μg kg−1 and 0.21 μg kg−1 for CQ and MQ, respectively. The mean recoveries of CQ and MQ were in the range of 83.4–119.4% with RSD less than 7.0%. The developed method was applied to the analysis of CQ and MQ in actual samples from different retail outlets in China, implying its potential in fast monitoring of CQ and MQ residues.

Introduction

Chlormequat (2-chloroethyltrimethylammonium, CQ) and mepiquat (1,1′-dimethy-lpyperidinium, MQ) are two quaternary ammonium pesticides widely used as plant growth inhibitors. CQ and MQ are usually used together for controlling unwanted longitudinal shoot growth, improving fruit setting and increasing yield of fruit and vegetables.1 However, toxicological studies showed that CQ and MQ have adverse effects on animal reproduction.2,3 The report from the National Institute for Occupational Safety and Health (NIOSH) indicated that CQ has been classified as a suspected endocrine disruptor.4 Due to their potential toxicity, the European Union (EU) has established a maximum residue level (MRL) of 0.05 mg kg−1 for both targeted analytes in fruit and vegetables, except that the MRL for CQ in pears is higher (0.1 mg kg−1).5 A more stringent MRL has been introduced in the “positive list system” of Japan for MQ, 0.01 mg kg−1 in all fruit and vegetables.6 Although there is no uniform MRL for these two analytes in fruit and vegetables in China currently, the residue behavior of CQ and MQ has caused great concern in the scholarly community.7

High-performance liquid chromatography coupled with mass spectrometry (HPLC-MS) or tandem MS (HPLC-MS/MS) has been used to simultaneously analyze CQ and MQ residues in different matrices.8–11 Because of the high polarity of quaternary ammonium compounds, hydrophilic interaction liquid chromatography (HILIC) column or strong cationic exchange (SCX) column was chosen to improve the retention and separation of CQ and MQ, which could remove the need for the use of ion-pairing reagents in the mobile phase in earlier studies.12,13 Especially, HILIC column has been recently used for simultaneous quantification of CQ and MQ in food samples, obtaining satisfactory chromatographic resolution.14 However, further study is required to develop a solid method suitable for the routine analysis of these two quaternary ammonium pesticides through the optimization of sample preparation procedure.

Of the published HPLC-MS or HPLC-MS/MS methods mainly solid phase extraction (SPE) was used for CQ and MQ in various matrices.8,11,13–17 Although the SPE was sensitive and accurate, the procedure was relatively tedious and time/solvent-consuming. In recent years, a QuEChERS (quick, easy, cheap, effective, rugged, and safe) method which was originally developed by Anastassiades et al.18 in 2003 has been widely accepted for sample preparation in pesticide residue analysis. This method was considered to be a streamlined approach that involves two steps: extraction of targeted analytes from the matrix and clean-up by dispersive solid-phase extraction (DSPE) to pull out interfering matrix materials from the sample extract. To widen the applicability of the method, some modifications to the original QuEChERS method were introduced for different kinds of pesticides in food commodities.19–26 But up to now, few HPLC-MS/MS method has been published using QuEChERS as sample preparation procedure for simultaneous determination of quaternary ammonium pesticides CQ and MQ.25

In the present study, we aim to develop an HPLC-MS/MS method designed for simultaneous determination of quaternary ammonium pesticides CQ and MQ in fruit and vegetables. Pear and potato were chosen as representative of frequently occurring fruits and vegetables, respectively. The sample preparation employed a modified QuEChERS method which required small volumes of organic solvent and binary sorbents to achieve high recovery and satisfactory reproducibility. A HILIC column was used for the chromatographic separation to improve the retention and resolution of highly polar CQ and MQ. The detailed fragmentation mechanisms of targeted analytes in MS/MS system were provided for the first time by the use of computational techniques. Our method was simple, fast, sensitive and cost-effective, and could be used as a routine method for analyzing CQ and MQ residues.

Experimental

Chemicals and reagents

The native standards of chlormequat chloride (CQ, purity > 99.1%) and mepiquat chloride (MQ, purity > 98.6%) were purchased from Sigma Chemical (St. Louis, MO, USA). The labeled standard d4-chlormequat chloride (d4-CQ, isotopic purity > 99.8%), as internal standard (IS), was purchased from Dr Ehrenstorfer GmbH (Augsburg, Germany). PSA sorbent (60 μm), GCB sorbent (60 μm), C18EC sorbent (60 μm) and anhydrous magnesium sulfate (MgSO4, purity > 98.5%) were purchased from Agilent Technologies (Santa Clara, CA, USA). HPLC-grade methanol (MeOH) and acetonitrile (MeCN) were purchased from Fisher Scientific (Houston, TX, USA). Water (18 M cm−1) was purified by use of a MilliQ™ System (Millipore, Milford, MA, USA). Nylon syringe filters (0.22 μm) were purchased from Jinteng Experiment Equipment Co., Ltd (Tianjin, China).

Calibration standards preparation

The stock solutions of individual CQ, MQ and IS were prepared with 50[thin space (1/6-em)]:[thin space (1/6-em)]50 v/v MeCN–water at the concentrations of 1 mg mL−1, and stored at −20 °C. The working solution of IS was further diluted at the concentrations of 2 μg mL−1 before use. The working solutions, each a mixture of an equal concentration of CQ and MQ, ranging from 5 ng mL−1 to 12.5 μg mL−1, were prepared by performing serial dilutions of the 12.5 μg mL−1 solution. Matrix-matched calibration standards were freshly made by adding the working solutions to mixed blank sample extracts at 0.1, 0.5, 1, 5, 10, 50, 100 and 250 ng mL−1 (corresponding to 0.07, 0.35, 0.7, 3.5, 7, 35, 70 and 175 μg kg−1) before each analytical run.

Sample collection and preparation

Samples of pear and potato were purchased from different supermarkets in China. The samples were cut into slices, ground and homogenized, and stored at −20 °C. Mixed blank matrices were chosen for validation experiments of the developed method.

To a 50 mL polypropylene (PP) centrifuge tube, 5.00 ± 0.01 g of blended sample matrix, 35 μL of IS and 3.5 mL of MeCN were added and vortex-mixed for 30 s. Then the phase partition was induced by addition of 3 g of MgSO4. The tube was immediately shaken for 1 min to prevent coagulation of MgSO4 and centrifuged for 10 min at 6000×g. For the sample clean-up, 1 mL of MeCN extract were placed into the 2 mL centrifuge tube containing 25 mg of PSA sorbent, 25 mg of GCB and 125 mg of MgSO4, shook for 1 min and centrifuged at 13[thin space (1/6-em)]300×g for 10 min. The resulting supernatants were filtered using a 0.22 μm nylon syringe filter for LC-MS/MS analysis.

HPLC-MS/MS analysis

Chromatographic separation was carried out by an Agilent 1260 HPLC system (Agilent Technologies, Waldbronn, Germany) equipped with an autosampler, a binary pump and a vacuum degasser. The analytical column was an XBridge™ HILIC column (150 mm × 2.1 mm, 3.5 μm; Waters, Milford, MA, USA), kept at 35 °C. The analytes were separated with isocratic elution using MeOH (A, 35%) and 20 mM CH3COONH4 containing 0.1% HCOOH (B, 65%) for 3.5 min. The flow rate was 0.23 mL min−1 and injection volume was 5 μL.

For the MS/MS analysis, an Agilent 6410 Triple Quadrupole mass spectrometer (Agilent Technologies, Wilmington, DE, USA) with an ESI (electrospray ionization) source was employed. The source was operated in positive ion mode by multiple reaction monitoring (MRM). Each MRM transition was assigned a dwell time of 30 ms. The nebulizer was operated at 45 psi. The nitrogen drying gas flow rate and temperature were kept at 12 L min−1 and 350 °C, respectively. The data acquisition was performed using Agilent MS workstation Mass hunter 1.0 software.

Results and discussion

Optimization of QuEChERS method

Mono-factor experiments. The QuEChERS method usually involves extraction and clean-up procedure for analyzing pesticide residues in fruit and vegetables. For the extraction process, the choice of a suitable extraction solvent facilitates to obtain the satisfactory recovery for analytes while discriminating matrix co-extracts to the maximum possible extent. The effects of MeOH and MeCN on the extraction efficiency were firstly evaluated because they had been used as solvents for the extraction of both analytes and obtained satisfactory recovery.8,11,14,25 In this study, in comparison with MeOH, MeCN gave the larger peak area of targeted analytes, exhibiting its preference for the extraction of pesticides with a wide polarity range including highly polar compounds.21 Furthermore, previous study revealed that the addition of HCOOH to adjust the pH of sample matrices to a desired range could improve the MS signal response of analytes.11 So the effect of HCOOH as an additive to MeCN was assessed. With the increase of the volume of HCOOH, the peak area of targeted analytes reduced, which was in agreement with that obtained previously in potato matrix.23 As a result, MeCN was used alone as the optimal extraction solvent in this study.

In the clean-up step, different sorbents are used to pull out matrix interfering substances such as polar organic acids, sugars, lipids, carotinoids and chlorophyll. At the same time, MgSO4 is added to remove excess water and improve analyte partitioning. Three common sorbents used in pesticides residue analysis contain PSA (primary secondary amine), C18EC (octadecysilane, end-capped) and GCB (graphitized carbon black). PSA is used as a weak anion exchanger to remove polar organic acids, sugars and pigments from the matrices. Both C18EC and GCB are non-polar sorbents and suitable for the adsorption of non-polar and medium-polar compounds from the polar samples. Especially, GCB is effective in the removal of hydrophobic interaction-based compounds, such as carotinoids and chlorophyll. In this study, seven combinations (see Fig. 1) of three above sorbents were respectively used to evaluate their effects on the purification efficiency. Fig. 1(a) and (b) showed the peak areas of CQ and MQ standards in solvent, respectively. The peak area of analyte in spiked sample extract closer to that in solvent indicated the better purification efficiency. According to the results of both analytes, PSA + GCB was considered to be the most favorable sorbent for clean-up among the seven examined combinations. On the other hand, when the sample was spiked prior to preparation (see Fig. 1(e) and (f)), the peak area for CQ was the highest when the PSA + GCB sorbent was used, which demonstrated high extraction efficiency as well as good purification efficiency, even though a comparative peak area was observed for MQ. Hence, PSA + GCB was chosen as a binary sorbent for the subsequent studies.


image file: c4ra10698a-f1.tif
Fig. 1 Effect of different sorbents combination for targeted compounds in potato matrix (n = 3) (black lines, CQ; red lines, MQ; dot lines, standards in solvent; solid lines, standards spiked after preparation; dash lines, standards spiked before preparation).
Orthogonal design experiments. Based on the results of mono-factor experiments described above, the QuEChERS method was further optimized by orthogonal design to estimate the effect of the additive amount of five factors in extraction and purification steps for targeted compounds in two matrices. The minimum orthogonal matrix method was selected as L16(45) for five design variables and four levels. Detailed experimental conditions for each project were listed in Table 1 to determine the important factors that led to the best possible response. According to the range (R) and coefficient of variation (CV) data in Table 1, the order of effect of five factors on the peak area of CQ was MeCN > MgSO4 (in extraction step) > MgSO4 (in purification step) > GCB > PSA, while the order of effect of five factors on the peak area of MQ was MeCN > GCB > MgSO4 (in extraction step) > MgSO4 (in purification step) > PSA. This result pointed out that the volume of MeCN added in extraction step was more important than that of other factors. It could be demonstrated that the optimal condition was: MeCN 2.5 mL, MgSO4 (in extraction step) 3.0 g, PSA 25 mg, GCB 25 mg and MgSO4 (in purification step) 125 mg.
Table 1 Effect of the additive amount of five factors in extraction and purification steps for targeted compounds in potato matrix by L16(45) orthogonal projects (n = 3)
No. Extraction Purification Peak area
MeCN (mL) MgSO4 (g) PSA (mg) GCB (mg) MgSO4 (mg) CQ MQ
1 2.5 (I) 2.0 (I) 25 (I) 25 (I) 75 (I) 46[thin space (1/6-em)]778 ± 987 68[thin space (1/6-em)]979 ± 1983
2 2.5 2.5 (II) 50 (II) 50 (II) 100 (II) 50[thin space (1/6-em)]130 ± 1259 69[thin space (1/6-em)]637 ± 1172
3 2.5 3.0 (III) 75 (III) 75 (III) 125 (III) 61[thin space (1/6-em)]171 ± 2118 78[thin space (1/6-em)]106 ± 2438
4 2.5 3.5 (IV) 100 (IV) 100 (IV) 150 (IV) 43[thin space (1/6-em)]051 ± 1987 44[thin space (1/6-em)]061 ± 2043
5 5.0 (II) 2.0 50 75 150 32[thin space (1/6-em)]808 ± 2744 36[thin space (1/6-em)]355 ± 677
6 5.0 2.5 25 100 125 39[thin space (1/6-em)]545 ± 994 47[thin space (1/6-em)]059 ± 930
7 5.0 3.0 100 25 100 42[thin space (1/6-em)]202 ± 1183 51[thin space (1/6-em)]416 ± 683
8 5.0 3.5 75 50 75 39[thin space (1/6-em)]745 ± 2892 48[thin space (1/6-em)]860 ± 1160
9 7.5 (III) 2.0 75 100 100 24[thin space (1/6-em)]767 ± 3495 26[thin space (1/6-em)]621 ± 2121
10 7.5 2.5 100 75 75 26[thin space (1/6-em)]820 ± 2138 30[thin space (1/6-em)]428 ± 1918
11 7.5 3.0 25 50 150 30[thin space (1/6-em)]616 ± 1923 38[thin space (1/6-em)]077 ± 1556
12 7.5 3.5 50 25 125 30[thin space (1/6-em)]570 ± 1271 36[thin space (1/6-em)]893 ± 1163
13 10.0 (IV) 2.0 100 50 125 22[thin space (1/6-em)]602 ± 552 24[thin space (1/6-em)]328 ± 234
14 10.0 2.5 75 25 150 24[thin space (1/6-em)]742 ± 2746 29[thin space (1/6-em)]199 ± 1523
15 10.0 3.0 50 100 75 22[thin space (1/6-em)]034 ± 2229 27[thin space (1/6-em)]228 ± 1239
16 10.0 3.5 25 75 100 24[thin space (1/6-em)]523 ± 470 30[thin space (1/6-em)]682 ± 916
[thin space (1/6-em)]
Peak area CQ
I/4 50[thin space (1/6-em)]283 31[thin space (1/6-em)]739 35[thin space (1/6-em)]365 36[thin space (1/6-em)]073 33[thin space (1/6-em)]844    
II/4 38[thin space (1/6-em)]575 35[thin space (1/6-em)]309 33[thin space (1/6-em)]886 35[thin space (1/6-em)]773 35[thin space (1/6-em)]405    
III/4 28[thin space (1/6-em)]193 39[thin space (1/6-em)]006 37[thin space (1/6-em)]606 36[thin space (1/6-em)]330 38[thin space (1/6-em)]472    
IV/4 23[thin space (1/6-em)]475 34[thin space (1/6-em)]472 33[thin space (1/6-em)]669 32[thin space (1/6-em)]349 32[thin space (1/6-em)]804    
R 26[thin space (1/6-em)]808 7267 3938 3981 5668    
CV (%) 33.9 8.5 5.2 5.3 7.0    
[thin space (1/6-em)]
Peak area MQ
I/4 65[thin space (1/6-em)]196 39[thin space (1/6-em)]071 46[thin space (1/6-em)]199 46[thin space (1/6-em)]622 43[thin space (1/6-em)]874    
II/4 45[thin space (1/6-em)]922 44[thin space (1/6-em)]081 42[thin space (1/6-em)]528 45[thin space (1/6-em)]225 44[thin space (1/6-em)]589    
III/4 33[thin space (1/6-em)]005 48[thin space (1/6-em)]707 45[thin space (1/6-em)]696 43[thin space (1/6-em)]893 46[thin space (1/6-em)]596    
IV/4 27[thin space (1/6-em)]859 40[thin space (1/6-em)]124 37[thin space (1/6-em)]558 36[thin space (1/6-em)]242 36[thin space (1/6-em)]923    
R 37[thin space (1/6-em)]337 9636 8641 10[thin space (1/6-em)]380 9673    
CV (%) 38.7 10.2 9.2 10.8 9.8    


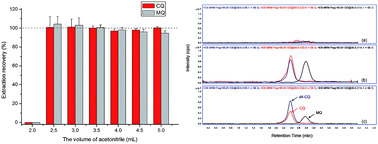
However, as a dominant factor, the optimal volume of MeCN (2.5 mL) needed to be refined because of its location on the terminal of four examined levels. Therefore, under the optimal condition of other factors, the effect of the volume of MeCN on the extraction recovery was further examined by varying the volume from 2.0 to 5.0 mL. As shown in Fig. 2, there was no signal when the volume of MeCN was below 2.5 mL because a small amount of MeCN was absorbed into the 5 g food sample itself. This implied that the phase partition could not be induced when the volume of MeCN was too small. Although the recoveries of both analytes lied between 90% and 110% when the volume was changed from 2.5 to 5.0 mL, better reproducibility, reflected in lower relative standard deviations (RSDs < 5%), was obtained when the volume was more than 3.5 mL. Especially, when the volume of MeCN was 3.5 mL, the recovery was closest to 100% with a satisfactory RSD less than 3%. Hence, 3.5 mL was selected as the optimal volume of MeCN added in the extraction step.


image file: c4ra10698a-f2.tif
Fig. 2 Effect of the volume of MeCN added in the extraction step for targeted compounds in potato matrix (n = 3).

Optimization of LC parameters

The choice of chromatographic column is the primary issue which affects the retention behavior and resolution of CQ and MQ. These two highly hydrophilic compounds were retained weakly in reversed-phase systems, which made their separation difficult. This has been clearly demonstrated in Xue's work25 that used reversed-phase C18 column for the HPLC separation of CQ, MQ and other four plant growth regulators. In this study, an XBridge™ HILIC column, using polar materials as stationary phase, was selected to separate CQ and MQ. Improved retention and resolution was achieved for the analytes with similar physical and chemical properties by partitioning and weak cation exchange.

On the HILIC column, the separation was carried out with aqueous–organic mobile phases. The effects of MeCN and MeOH as organic solvents were firstly evaluated using 20 mM CH3COONH4 containing 0.1% HCOOH. Compared to MeCN, MeOH possessed improved peak shape and reproducibility of the retention time of the analytes. Moreover, the volumes of MeOH in the mobile phase were investigated by varying the volume ratio from 20% to 40%. When the volume of MeOH was 20%, CQ and MQ could not be separated although the total run time (2 min) was short. With the increase of the volume of MeOH, the resolution of the analytes enhanced while the retention time elongated. A satisfactory separation was observed when the volume of MeOH increased to 35% with a relatively short run time of 3.5 min. Typical chromatograms of mixed blank extract, mixed blank extract spiked with 14 μg kg−1 of the analytes, and an actual sample were depicted in Fig. 3. The retention time of CQ and MQ were 2.37 and 2.71 min, respectively.


image file: c4ra10698a-f3.tif
Fig. 3 Typical chromatograms of mixed blank potato (a), mixed blank potato plug standard solutions (b), and a potato sample (c).

Fragmentation mechanisms of targeted analytes

The precursor and product ion pairs of quantification and confirmation and the collision energy for CQ and MQ were summarized in Table 2. CQ and MQ were charged cationic species in solution, leading to the precursor molecular ion [M]+ at m/z 122.0 and 114.1, respectively. The MS/MS parameters were optimized to achieve the highest relative abundance of product ion. At the collision energy of 31 V, the fragment ions at m/z 58.1 ([M − (CH2)2Cl − H]+) and 63.0 ([M − NCH2(CH3)2]+) were the base peaks in the mass spectra of CQ. The most abundant product ion of 58.1 (m/z) was used as a quantification ion and the next most abundant of 63.0 (m/z) was used as a confirmation ion. For MQ, the fragment ions at m/z 98.1 ([M − CH3 − H]+) and 58.1 ([M − CH(CH2)2CH3]+) were the base peaks at the collision energy of 30 V. The most abundant product ion of 98.1 (m/z) was used as a quantification ion and the next most abundant of 58.1 (m/z) was used as a confirmation ion.
Table 2 The fragmentation process of precursor ions to give quantification (Q) and confirmation (C) product ions, the collision energy (CE)a, the activated Gibbs free energy (ΔG)b, and the reaction energy (ΔGr)c
Analyte Precursor TS Product CE ΔG ΔGr
a Collision energy (CE) is in V.b Activated Gibbs free energy (ΔG) is defined as the free energy barrier of TS1 to precursor or TS2 to IM1, in kcal mol−1.c Reaction energy (ΔGr) is defined as the relative free energy of product to precursor, in kcal mol−1.
CQ-Q/CQ-C image file: c4ra10698a-u1.tif image file: c4ra10698a-u2.tif image file: c4ra10698a-u3.tif −31 60.2 −10.2
MQ-Q image file: c4ra10698a-u4.tif image file: c4ra10698a-u5.tif image file: c4ra10698a-u6.tif −30 91.8 −1.8
MQ-C (step 1) image file: c4ra10698a-u7.tif image file: c4ra10698a-u8.tif image file: c4ra10698a-u9.tif −30 60.5 0.8
MQ-C (step 2) image file: c4ra10698a-u10.tif image file: c4ra10698a-u11.tif image file: c4ra10698a-u12.tif −30 60.5 30.2


Then the fragmentation mechanisms of both analytes were studied by use of computational techniques to elucidate detailed fragmentation behaviors of precursor ions. The calculations were performed by Gaussian 03 program.27 Density functional theory B3LYP method28–30 in conjunction with the 6-31+G(d,p) basis set31 was employed to fully optimize the geometric structures of all the precursor ions, transition states (TS), intermediates (IM) and product ions in fragmentation pathways of both analytes, and to calculate the harmonic vibrational frequencies to characterize the nature of the transition state with only one imaginary frequency or stationary point as true minimum with no imaginary. Meanwhile, the transition state associated with the correct reactant and product was verified by the intrinsic reaction coordinate (IRC) calculations.32 Optimized Cartesian coordinates of all stationary points were given in the ESI. The fragmentation process of precursor ions, the activated Gibbs free energies (ΔG) and the reaction energy (ΔGr) were summarized in Table 2.

As shown in Table 2, for CQ, the quantification product ion at m/z 58.1 and confirmation product ion at m/z 63.0 could be simultaneously generated via one fragmentation pathway of the precursor ion [M]+ with the cleavage of N(1)–C(2) and C(1)–H(1) bonds. Although thermodynamics data showed that this process could spontaneously occur, reflected in a negative reaction energy (−10.2 kcal mol−1), the extra collision energy was needed to surmount a free energy barrier of ca. 60 kcal mol−1. For MQ, the quantification product ion at m/z 98.1 and confirmation product ion at m/z 58.1 were produced via two different fragmentation pathways. One is a concerted mechanism with the cleavage of C(1)–H(1) bond and simultaneous formation of methane to offer the quantification product ion. Another one is a stepwise mechanism with the initial formation of a five-membered ring intermediate and subsequent ring-opening reaction giving rise to the confirmation product ion. A higher free energy barrier of 91.8 kcal mol−1 for MQ-Q resulted in its lower ionization efficiency compared to CQ-Q at nearly equal collision energy, which may explain why the LOD of the method for MQ was weak than that for CQ (see Section “Accuracy, precision, LOD and LOQ” for details). Although the free energy barrier in fragmentation pathway of MQ-C compared favorably with that of MQ-Q, the strong endothermic characteristic (the reaction energy being 30.2 kcal mol−1) made the occurrence of reaction difficult. Correspondingly, the signal intensity of MQ-C was lower than that of MQ-Q. Our calculations clarified the detailed fragmentation mechanisms of both analytes, offering the quantification and confirmation product ions which were in nice agreement with the experimental observation.

Method validation

Linearity and matrix effect. Matrix-matched standard curve was constructed in triplicate by plotting the peak-area ratio of analytes over IS (y) versus the concentration of analytes (x) in the calibration samples. The linearity of the method was tested by analyzing the standard solutions and the different matrices. The results were summarized in Table 3 and showed that the calibration curves were linear within the range of 0.07–175 μg kg−1 for CQ and 0.7–175 μg kg−1 for MQ.
Table 3 Linear regression parameters of calibration curve of CQ and MQ in solvent and two matrices
Analyte Matrix Regression equation Calibration range (μg kg−1) R2 LOD (μg kg−1) MEa (%)
a Matrix effect (ME) is defined as (slope of matrix-matched curve − slope of solvent-based curve)/slope of solvent-based curve; 0% = no matrix effect.
CQ Solvent y = 0.1167x + 0.0373 0.07–175 1.0000 0.021
Pear y = 0.1355x + 0.0045 0.07–175 1.0000 0.021 16.1
Potato y = 0.1490x + 0.0033 0.07–175 0.9999 0.021 27.7
MQ Solvent y = 0.0951x − 0.0536 0.7–175 0.9999 0.21
Pear y = 0.1140x + 0.0134 0.7–175 0.9997 0.21 19.9
Potato y = 0.2144x − 0.0649 0.7–175 1.0000 0.21 125.4


Matrix effect (ME) was evaluated by comparing the slopes obtained in the calibration with matrix-matched standards (Smatrix) and those obtained with solvent-based standards (Ssolvent), and expressed by

 
image file: c4ra10698a-t1.tif(1)

The ME value lower than 0 indicated signal suppression while the ME value higher than 0 indicated ionization enhancement. In Table 3, minor enhancement effects for both analytes in pear matrix were observed (both ME < 20%). But there were significant ionization enhancements for CQ (ME = 27.7%) and MQ (ME = 125.4%) in potato matrix, which may due to strong competition between excessive polar carbohydrates and targeted analytes for the chromatographic retention and subsequent ionization. In view of this, matrix-matched calibration was required for quantification in this study.

Accuracy, precision, LOD and LOQ. According to the guidelines on residue analysis of pesticide,33 the accuracy and precision of the method were estimated by means of recovery experiments. The accuracy was expressed by the recovery (%) of spiked samples while the precision was expressed as the relative standard deviation (RSD, %). Quantification of above recovery samples was carried out using matrix-matched calibration. As shown in Table 4, the mean recoveries of CQ and MQ in two matrices ranged from 83.4% to 119.4% with RSD less than 7.0%. These results were satisfactory which had achieved the requirement of SANCO/12495/2011 guideline (mean recovery between 70 and 120% with RSD less than 20%).
Table 4 Determination of CQ and MQ in two matrices (n = 6)
Analyte Spiked level (μg kg−1) Pear Potato
Recovery (%) SD (%) RSD (%) Recovery (%) SD (%) RSD (%)
CQ 0.35 105.8 3.5 3.3 103.8 4.0 3.9
35 91.6 2.8 3.1 87.6 2.3 2.6
140 97.0 0.4 0.4 96.0 5.1 5.3
MQ 1.4 112.0 3.1 2.8 119.4 6.1 5.1
35 87.8 2.3 2.6 83.4 5.8 7.0
140 98.9 6.4 6.5 107.0 2.3 2.2


The limit of detection (LOD) and the limit of quantification (LOQ) were determined as the lowest fortification level that yielded a signal-to-noise (S/N) ratio of 3[thin space (1/6-em)]:[thin space (1/6-em)]1 and 10[thin space (1/6-em)]:[thin space (1/6-em)]1, respectively. For CQ, the LOD was 0.021 μg kg−1 and the LOQ was 0.070 μg kg−1. For MQ, the LOD and LOQ were 0.21 and 0.70 μg kg−1, respectively. The sensitivity of our method was one to two orders of magnitude higher than that obtained previously using similar QuEChERS-HPLC-MS/MS method where the LOQs were 10 μg kg−1 for CQ and 5 μg kg−1 for MQ.25 This improvement was attributed mainly to the better resolution of targeted analytes on HILIC column and the more sufficient clean-up using binary sorbents (the polar PSA in collaboration with non-polar GCB) to minimize the interference of matrix coexistences, followed by minimizing the volumes of extraction solvent (the solvent/sample ratio of 3.5 mL: 5 g) with a satisfactory reproducibility to enhance the recovery.

Stability test. The stability of each analyte in two matrices was determined by monitoring degradation of the different samples stored at different temperatures and times. The stability of the analytes prior to preparation was assessed at −20 °C after 0, 1, 2, 3, 5 and 7 days of storage. The results indicated that CQ and MQ did not reveal any appreciable degradation with losses no higher than 2.8%. The stability of the analytes in prepared samples was assessed after 0, 1, 2, 4, 8, 15 and 24 h of storage without light exposure at room temperature. The results exhibited that CQ and MQ were stable over 24 h with losses no higher than 3.0%.

Application to actual samples

The developed method was applied to analyze 10 pears and 10 potatoes collected from different retail markets in China. The results were summarized in Table 5. Both analytes were detected in all examined samples except one potato with “Green Fruit and Vegetables” logo. But all detected concentration of CQ and MQ were lower than the MRL standard established by the EU for pear (CQ 0.1 mg kg−1, MQ 0.05 mg kg−1) and potato (CQ 0.05 mg kg−1, MQ 0.05 mg kg−1).
Table 5 Determination of CQ and MQ in actual samples (n = 3)
Sample Source CQ (μg kg−1) MQ (μg kg−1)
a The “Green Fruit and Vegetables” logo items.b The concentration is not detected.
Pear Supermarket 1 0.79 ± 0.04 0.95 ± 0.02
Supermarket 1a 0.73 ± 0.04 0.93 ± 0.05
Supermarket 2 0.80 ± 0.03 0.90 ± 0.03
Supermarket 2a 0.65 ± 0.02 0.89 ± 0.03
Supermarket 3 0.70 ± 0.05 0.81 ± 0.04
Supermarket 3a 0.62 ± 0.06 0.92 ± 0.06
Farmers market 1 0.75 ± 0.01 0.99 ± 0.04
Farmers market 2 0.74 ± 0.03 0.80 ± 0.06
Street market 1 0.89 ± 0.08 0.85 ± 0.04
Street market 2 0.93 ± 0.07 0.94 ± 0.04
Potato Supermarket 1 0.64 ± 0.01 0.81 ± 0.04
Supermarket 1a 0.53 ± 0.02 0.79 ± 0.06
Supermarket 2 0.65 ± 0.03 0.80 ± 0.02
Supermarket 2a n.d.b n.d.
Supermarket 3 0.51 ± 0.02 0.77 ± 0.03
Supermarket 3a 0.50 ± 0.01 0.80 ± 0.02
Farmers market 1 0.60 ± 0.03 0.90 ± 0.06
Farmers market 2 0.61 ± 0.03 0.83 ± 0.04
Street market 1 0.59 ± 0.00 0.85 ± 0.04
Street market 2 0.62 ± 0.05 0.76 ± 0.05


Conclusion

In this study, a highly sensitive HPLC-MS/MS method was developed and fully validated for simultaneous determination of the quaternary ammonium pesticides CQ and MQ in pear and potato. The sample preparation employed a modified QuEChERS method which required small volumes of organic solvent and binary sorbents to achieve high recovery and satisfactory reproducibility. A HILIC column was used for the chromatographic separation to improve the retention and resolution of highly polar CQ and MQ. Detailed fragmentation mechanisms of both analytes were clarified using DFT approach, offering the quantification and confirmation product ions which were in nice agreement with the experimental observation. Our method was simple, fast and cost-effective, and could be used as a routine method for analyzing CQ and MQ residues.

Acknowledgements

This project was supported by the National Natural Science Foundation of China (Grant no. 21403021) and by the Scientific Research Foundation of Chongqing (Grant nos KJ130314, cstc2013jcyjA20004, and Xm201313).

References

  1. C. MacBean, The Pesticide Manual, British Crop Protection Council, United Kingdom, 2012, 16th edn Search PubMed .
  2. M. T. Sorensen and V. Danielsen, Int. J. Androl., 2006, 29, 129–132 CrossRef PubMed .
  3. S. R. Koenning, K. L. Edmisten, K. R. Barker and D. E. Morrison, J. Nematol., 2003, 35, 73–77 CAS .
  4. The Pollution Information Site, http://scorecard.goodguide.com, accessed 2011.
  5. EU Pesticides database, Event=commodity selection, http://ec.europa.eu/sanco_pesticides/public/index.cfm?, accessed 2014.
  6. Ministry of Health, Labour and Welfare of Japan, Positive list system for agricultural chemical residues in Foods, 2006 Search PubMed .
  7. Ministry of Health & Agriculture of the People's Republic of China, National Food Safety Standard: Maximum Residue Limits for Pesticides in Food, GB 2763—2012, 2012 Search PubMed .
  8. Z. Y. Yu, F. Jin, J. Y. Hu, X. Zhang, J. F. Sun and M. Yang, Anal. Chim. Acta, 2010, 678, 90–95 CrossRef CAS PubMed .
  9. S. Marchese, D. Perret, E. Bafile, A. Gentili, F. Caretti and M. Berardino, Chromatographia, 2009, 70, 761–767 CAS .
  10. L. Alder and J. R. Startin, J. AOAC Int., 2005, 88, 1762–1776 CAS .
  11. S. Riediker, H. Obrist, N. Varga and R. H. Stadler, J. Chromatogr. A, 2002, 966, 15–23 CrossRef CAS .
  12. O. Núñez, E. Moyano and M. T. Galceran, Anal. Chim. Acta, 2004, 525, 183–190 CrossRef PubMed .
  13. J. L. Martíınez Vidal, A. Belmonte Vega, F. J. Sánchez López and A. Garrido Frenich, J. Chromatogr. A, 2004, 1050, 179–184 CrossRef PubMed .
  14. X. Esparza, E. Moyano and M. T. Galceran, J. Chromatogr. A, 2009, 1216, 4402–4406 CrossRef CAS PubMed .
  15. H. Z. Tian, Chromatographia, 2011, 73, 457–462 CAS .
  16. Y. Zhao, K. Lazou, M. Schelfaut, L. De Reu and P. Sandra, Chromatographia, 2000, 51, 531–535 CAS .
  17. J. Hau, S. Riediker, N. Varga and R. H. Stadler, J. Chromatogr. A, 2000, 878, 77–86 CrossRef CAS .
  18. M. Anastassiades, S. J. Lehotay, D. Stajnbaher and F. J. Schenck, J. AOAC Int., 2003, 86, 412–431 CAS .
  19. A. Y. Ko, A. M. A. El-Aty, M. M. Rahman, J. Jang, S. W. Kim, J. H. Choi and J. H. Shim, Food Chem., 2014, 157, 413–420 CrossRef CAS PubMed .
  20. U. Koesukwiwat, K. Sanguankaew and N. Leepipatpiboon, Food Chem., 2014, 153, 44–51 CrossRef CAS PubMed .
  21. X. H. Wu, J. Xu, F. S. Dong, X. G. Liu, Y. B. Li and Y. Q. Zheng, J. Chromatogr. A, 2014, 1329, 30–37 CrossRef CAS PubMed .
  22. M. M. Tian, D. X. Chen, Y. L. Sun, Y. W. Yang and Q. Jia, RSC Adv., 2013, 3, 22111–22119 RSC .
  23. L. Zhou, X. L. Liu, S. Kang, F. Z. Zhang and C. P. Pan, Food Chem., 2013, 138, 1355–1359 CrossRef CAS PubMed .
  24. S. N. Sinha, K. Vasudev and M. V. V. Rao, Food Chem., 2012, 132, 1574–1584 CrossRef CAS PubMed .
  25. J. Y. Xue, S. L. Wang, X. W. You, J. N. Dong, L. J. Han and F. M. Liu, Rapid Commun. Mass Spectrom., 2011, 25, 3289–3297 CrossRef CAS PubMed .
  26. Y. Xu, L. F. Shou and Y. L. Wu, J. Chromatogr. A, 2011, 1218, 6663–6666 CrossRef CAS PubMed .
  27. M. J. Frisch, G. W. Trucks, H. B. Schlegel, G. E. Scuseria, M. A. Robb, J. R. Cheeseman, J. A. Montgomery Jr, T. Vreven, K. N. Kudin, J. C. Burant, J. M. Millam, S. S. Iyengar, J. Tomasi, V. Barone, B. Mennucci, M. Cossi, G. Scalmani, N. Rega, G. A. Petersson, H. Nakatsuji, M. Hada, M. Ehara, K. Toyota, R. Fukuda, J. Hasegawa, M. Ishida, T. Nakajima, Y. Honda, O. Kitao, H. Nakai, M. Klene, X. Li, J. E. Knox, H. P. Hratchian, J. B. Cross, V. Bakken, C. Adamo, J. Jaramillo, R. Gomperts, R. E. Stratmann, O. Yazyev, A. J. Austin, R. Cammi, C. Pomelli, J. W. Ochterski, P. Y. Ayala, K. Morokuma, G. A. Voth, P. Salvador, J. J. Dannenberg, V. G. Zakrzewski, S. Dapprich, A. D. Daniels, M. C. Strain, O. Farkas, D. K. Malick, A. D. Rabuck, K. Raghavachari, J. B. Foresman, J. V. Ortiz, Q. Cui, A. G. Baboul, S. Clifford, J. Cioslowski, B. B. Stefanov, G. Liu, A. Liashenko, P. Piskorz, I. Komaromi, R. L. Martin, D. J. Fox, T. Keith, M. A. Al-Laham, C. Y. Peng, A. Nanayakkara, M. Challacombe, P. M. W. Gill, B. Johnson, W. Chen, M. W. Wong, C. Gonzalez and J. A. Pople, GAUSSIAN 03, (Revision D. 01), Gaussian Inc., Wallingford, CT, 2005 Search PubMed .
  28. P. J. Stephens, F. J. Devlin, C. F. Chabalowski and M. J. Frisch, J. Phys. Chem., 1994, 98, 11623–11627 CrossRef CAS .
  29. A. D. Becke, J. Chem. Phys., 1993, 98, 5648–5652 CrossRef CAS PubMed .
  30. C. Lee, W. Yang and R. G. Parr, Phys. Rev. B: Condens. Matter Mater. Phys., 1988, 37, 785–792 CrossRef CAS .
  31. W. J. Hehre, L. Radom, P. V. R. Schleyer and J. A. Pople, Ab Initio Molecular Orbital Theory, Wiley, New York, 1986 Search PubMed .
  32. K. Fukui, J. Phys. Chem., 1970, 74, 4161–4163 CrossRef CAS .
  33. EU Reference Laboratories for Residues of Pesticides, Method validation and quality control procedures for pesticide residue analysis in food and feed, Document no. SANCO/12495/2011, 2011.

Footnote

Electronic supplementary information (ESI) available. See DOI: 10.1039/c4ra10698a

This journal is © The Royal Society of Chemistry 2015
Click here to see how this site uses Cookies. View our privacy policy here.