Thermal behavior of cellulose diacetate melt using ionic liquids as plasticizers
Zhixing Li,
Na Liu,
Yongbo Yao,
Shiyan Chen*,
Haifeng Wang and
Huaping Wang*
State Key Laboratory for Modification of Chemical Fibers and Polymer Materials, Key Laboratory of High Performance Fibers and Products (Ministry of Education), College of Materials Science and Engineering, Donghua University, Shanghai 201620, China. E-mail: chensy@dhu.edu.cn; wanghp@dhu.edu.cn; Fax: +862167792958; Tel: +862167792950
First published on 12th November 2014
Abstract
1-Butyl-3-methylimidazolium tetrafluoroborate ([BMIM]BF4) was chosen as a plasticizer for cellulose diacetate (CDA) to investigate the feasibility of CDA melt spinning. [BMIM]BF4/CDA was characterized by Fourier transform infrared (FTIR) spectroscopy, dynamic thermomechanical analysis (TG), the degree of crystallinity (XRD), scanning electron microscopy (SEM) and the thermal stability of CDA. The rheological properties of [BMIM]BF4/CDA were investigated by a rotary rheometer and the zero-shear viscosity was predicted by the three-parameter Carreau viscosity model from apparent viscosity data. The [BMIM]BF4/CDA melt showed a shear-thinning behaviour. The melt with higher CDA concentrations and higher shear rates was found to be sensitive to temperature; thus, we could adjust the processing technology by changing the temperature and shear rate. However, the structural viscosity index of the melt decreased with increase in the [BMIM]BF4 content and went up after a decline with temperature increase.
Introduction
As a cellulose derivative, CDA has been widely applied as material for CDA fibers in cigarette filters and textiles. Owing to the intermolecular and intramolecular hydrogen bonds in CDA, it has a high viscosity and an elevated glass transition temperature, and it is not processable as a thermoplastic.1–3 As is well known, the conventional method for manufacturing CDA fibers is solution spinning, including wet spinning and dry spinning,4 in which a large amount of deleterious solvents such as acetone are used. The melt spinning process is a method with high production efficiency; therefore, the melt spinning process of CDA fibers has attracted widespread attention at home and abroad.In an effort to modify its properties and facilitate processing, CDA was modified through varying plasticizers such as various aliphatic and aromatic esters5–8 and physical plasticizers. Lee et al.9 have researched that the glass transition temperature (Tg) of CDA can be reduced to 80–100 °C by adding maleic anhydride, glycerol and citrate esters. Moreover, Zepnik et al.10 have recently studied the effect of the plasticizer type and concentration on CDA using benzoate, acetates, phosphate and citrate-based plasticizers. An increase in plasticizer concentration resulted in significant broadening of the thermoplastic processing window due to a strong decrease in the glass transition temperature. A similar trend of CDA stiffness and toughness properties was observed.11 In addition, chemical plasticizing was used for applications. Szamel et al.12 used caprolactone as an internal plasticizer, which changed the molecular structure of CDA. According to the activity of the molecular chain of CDA, they found that it was better to use caprolactone as internal plasticizer than to use it as external plasticizer. CDA could also be successfully plasticized by grafting PLA, which generated a melting process without any external plasticizer.13,14 Luan et al.15 used a “one pot” method to prepare thermoplastic CDA-graft-poly(L-lactide) copolymers from unmodified cellulose in ILs ([Amim]Cl). The thermoplastic copolymers could be processed by conventional hot working such as by injection and melt spinning. However, the former conventional plasticizers usually have problems such as toxicity,16 changing the structure of cellulose acetate or arising leakage during the machining process because of the compatibility.
ILs contain imidazolium or pyridinium cations like some conventional plasticizers, containing an aromatic core and pendant alkyl groups. Due to their excellent advantages, such as environmentally friendly behavior, no detectable vapor pressure, high thermal stability and low temperature stability, adjustable polarity and acidity, and small evaporation losses, ionic liquids (ILs)17,18 have attracted interest in the material and chemical industry and in various fields. Because they have good compatibility with polymer, endow the polymer with better stability, enlarge the adjusting range of the modulus of elasticity and make the polymer plasticizing glass transition temperature lower,19,20 ILs may have potential applications as plasticizers. [BMIM]BF4 is one of the most used ILs as it has a wide temperature range.21
In this work, we chose [BMIM]BF4 as the plasticizer to investigate the thermal behavior of the CDA/ILs system in order to predict its spinnability and guide for melt spinning processing.
Experimental
Materials and methods
CDA was provided by Nantong Acetate Fiber Company Limited. Its degree of polymerization is 300, and the DS is 2.4. [BMIM]BF4 was provided by ionic liquid-Shanghai Cheng Jie Chemical Company Limited. FTIR of the blends were recorded with a Nicolet FTIR spectrometer (Nexus 670, Thermo Fisher, USA) at 700–4000 cm−1. Scanning electron micrographs (SEM) were taken on a SU8010 field emission scanning electron microscope. The cellulose diacetate films were frozen in liquid nitrogen and fractured. The fractured surface of the film was sputtered with gold and then observed. X-ray diffraction patterns were recorded in the reflection mode in the angular range of 3–60° (2θ) at ambient temperature by an X'Pert Pro MPD diffractometer. The radiation from the anode, operating at 50 kV and 35 mA, was monochromatized with a nickel foil. DMA of [BMIM]BF4/CDA films were tested at a heating rate of 5 °C min−1 from 40 to 300 °C under 1 Hz in dynamic mode using TA Q800 from USA. The thermal decomposition studies of CDA films were carried out using an American TA Q5000IR instrument under a nitrogen environment (50 mL min−1) at a heating rate of 10 °C min−1 from 40 to 600 °C. Each film was tested at least three times to confirm the reproducibility of the data. The steady-state rheological measurements were performed using ARES-G1 (TA, USA) equipped with 25.0 mm parallel plates fixture. The steady state sweeps were conducted for different [BMIM]BF4/CDA over the range of shear rate of 0.01–100 s−1 at 170 °C, 180 °C, 190 °C and 200 °C.[BMIM]BF4/CDA film preparation
CDA powder was dried in a vacuum oven for 24 hours at 60 °C, and 15 wt%, 25 wt% and 35 wt% [BMIM]BF4/CDA were dissolved in acetone to acquire 20 wt% acetone solution. The mixture was stirred for 2 h to prepare a homogenous paste. After complete dissolution, films with 0.1 mm thickness were prepared using a film making instrument. The films were dried in a vacuum oven at 60 °C for 12 h to remove acetone.[BMIM]BF4/CDA tablet preparation
CDA powder was dried in the vacuum oven for 24 h at 60 °C, and 15 wt%, 25 wt% and 35 wt% [BMIM]BF4/CDA were mixed in a high-speed mixer and then sized to 25.0 mm diameter and 1.0 mm thickness using a tablet compressing machine at room temperature to make sure there is no thermal history before the test.22Results and discussion
FTIR characterization of [BMIM]BF4/CDA
To understand the structure of the [BMIM]BF4/CDA, Fig. 1 shows the FTIR spectra of the original CDA, virgin [BMIM]BF4 and 25 wt% [BMIM]BF4/CDA. The absorption peak of ‘–OH’ is at 3480 cm−1, and the absorption peaks of [CH3COO] (C![[double bond, length as m-dash]](https://www.rsc.org/images/entities/char_e001.gif) O, C–O, C–H) are at 1743, 1369 and 1230 cm−1, respectively. The absorption peak of [BF4]− anions and imidazolium rings are observed at approximately 2970, 1571, 1462, 1200, and 1000 cm−1. The blends of [BMIM]BF4/CDA show a decrease of hydroxyl from the weaker peak at 3528 cm−1.23 FTIR can also be used to study the hydrogen bonds in the infrared region by the vibrations of molecules. Fig. 2 shows the magnified FTIR spectra between 4000–3000 cm−1. There is no absorption band of free hydroxyl groups at 3600 cm−1 for CDA, which indicates that the hydroxyl groups are associated with the intermolecular or intramolecular hydrogen bonds in CDA.24 The absorption peak of hydroxyl groups would move to a lower frequency (3480 cm−1) when the hydrogen bonds are formed by the hydroxyl groups. With increase in [BMIM]BF4 content, the absorption peak of hydrogen bonds shifts to higher value and the intensity decreases. The frequency shifts indicate that the hydrogen bonds become weak. Moreover, the intensity of the peak is proportional to the strength of the hydrogen bonds. It can be explained that stronger interactions between [BMIM]+, [BF4]− in [BMIM]BF4 and the CDA molecule exist, which break the hydrogen bonds between the hydroxyl group of CDA molecules. This provides a new way to plasticize CDA-like glycerol, which can form stronger interaction to weaken the hydrogen bonds.25
O, C–O, C–H) are at 1743, 1369 and 1230 cm−1, respectively. The absorption peak of [BF4]− anions and imidazolium rings are observed at approximately 2970, 1571, 1462, 1200, and 1000 cm−1. The blends of [BMIM]BF4/CDA show a decrease of hydroxyl from the weaker peak at 3528 cm−1.23 FTIR can also be used to study the hydrogen bonds in the infrared region by the vibrations of molecules. Fig. 2 shows the magnified FTIR spectra between 4000–3000 cm−1. There is no absorption band of free hydroxyl groups at 3600 cm−1 for CDA, which indicates that the hydroxyl groups are associated with the intermolecular or intramolecular hydrogen bonds in CDA.24 The absorption peak of hydroxyl groups would move to a lower frequency (3480 cm−1) when the hydrogen bonds are formed by the hydroxyl groups. With increase in [BMIM]BF4 content, the absorption peak of hydrogen bonds shifts to higher value and the intensity decreases. The frequency shifts indicate that the hydrogen bonds become weak. Moreover, the intensity of the peak is proportional to the strength of the hydrogen bonds. It can be explained that stronger interactions between [BMIM]+, [BF4]− in [BMIM]BF4 and the CDA molecule exist, which break the hydrogen bonds between the hydroxyl group of CDA molecules. This provides a new way to plasticize CDA-like glycerol, which can form stronger interaction to weaken the hydrogen bonds.25
The effect of [BMIM]BF4 on the crystalline properties of CDA
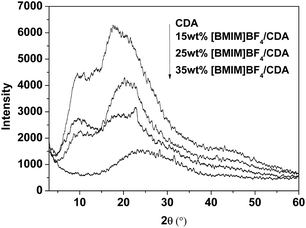
To investigate the effect of [BMIM]BF4 on the crystalline properties of CDA, XRD measurements were performed. The obtained XRD patterns of pure CDA and CDA plasticized with a different content of [BMIM]BF4 are shown in Fig. 3. On the XRD curve of pure CDA, the diffraction peaks at 2θ = 17.12° of 021 and 2θ = 10.42° of 210 for CDA are observed.26 No new crystalline peaks appeared on the XRD curves of the [BMIM]BF4 plasticized CDA. This indicated that the type of CDA crystals were not affected by the addition of [BMIM]BF4. The diffraction peaks of CDA decreased rapidly in intensity with the addition of [BMIM]BF4 and almost disappeared when 35 wt% [BMIM]BF4 was added. This demonstrated that [BMIM]BF4 would effectively decrease the degree of crystallinity of CDA.The morphology of the mixture of [BMIM]BF4/CDA
To understand the phase morphology of [BMIM]BF4/CDA, the morphology of blend fractured surface were characterized by SEM and is shown in Fig. 4. The surface of CDA presents a classical reticular structure of the microporous membrane (Fig. 4(a)). After adding ILs, the structure of the system transformed from the microporous structure of CDA to a rough structure (15 wt% [BMIM]BF4/CDA and 25 wt% [BMIM]BF4/CDA) and then to almost a smoothly homogeneous phase structure (35 wt% [BMIM]BF4/CDA). As a good type of solvent for CDA,21 more [BMIM]BF4 would make the system form a better homogenous phase, which would affect the crystallinity of CDA. This is confirmed by the results from the XRD data. The results indicated that [BMIM]BF4 played an important role in the structure of films to change phase. | ||
| Fig. 4 SEM of pure CDA and [BMIM]BF4/CDA with a different [BMIM]BF4 content. (a) CDA, (b) 15 wt% [BMIM]BF4/CDA, (c) 25 wt% [BMIM]BF4/CDA, and (d) 35 wt% [BMIM]BF4/CDA. | ||
Thermal properties of [BMIM]BF4/CDA
Tg is important for the design of polymeric materials because it is related to the transition between hard, glassy properties at lower temperatures and rubbery behavior at higher temperatures. The stiffness of CDA is mainly due to the existence of strong intermolecular hydrogen bonds. We chose [BMIM]BF4 as a type of physical plasticizer to decrease the temperature of processing. Glass transition temperatures were determined by DMA. Fig. 5 shows the relationship between tan![[thin space (1/6-em)]](https://www.rsc.org/images/entities/char_2009.gif) δ and temperature. tan
δ and temperature. tan![[thin space (1/6-em)]](https://www.rsc.org/images/entities/char_2009.gif) δ is a damping term defined as the ratio of energy dissipated as heat to the maximum energy stored in the material. It is an index of material viscoelasticity. The temperature of the peak is related to the glass transition temperature (Tg). As shown in Fig. 5, the Tg of CDA significantly decreased from 225 °C to 95 °C when the [BMIM]BF4 content increased from 0 wt% to 35 wt% in [BMIM]BF4/CDA. [BMIM]BF4 plasticizes CDA by breaking the hydrogen bonds between CDA molecules with [BF4]−. The more hydrogen bonds are broken, the more the molecular chain moves easily, which shows the decrease of Tg.27–31 The optimum plasticizer concentration is a key parameter to reduce the processing temperature without compromising the stability and other performances of CDA. This phenomenon demonstrated that the [BMIM]BF4 plasticizer can successfully decrease the Tg of CDA and make CDA workable and flexible at lower temperatures.
δ is a damping term defined as the ratio of energy dissipated as heat to the maximum energy stored in the material. It is an index of material viscoelasticity. The temperature of the peak is related to the glass transition temperature (Tg). As shown in Fig. 5, the Tg of CDA significantly decreased from 225 °C to 95 °C when the [BMIM]BF4 content increased from 0 wt% to 35 wt% in [BMIM]BF4/CDA. [BMIM]BF4 plasticizes CDA by breaking the hydrogen bonds between CDA molecules with [BF4]−. The more hydrogen bonds are broken, the more the molecular chain moves easily, which shows the decrease of Tg.27–31 The optimum plasticizer concentration is a key parameter to reduce the processing temperature without compromising the stability and other performances of CDA. This phenomenon demonstrated that the [BMIM]BF4 plasticizer can successfully decrease the Tg of CDA and make CDA workable and flexible at lower temperatures.
The obtained TGA curves of pure CDA and [BMIM]BF4 plasticized CDA are shown in Fig. 6(a). The shape of mass loss curves for pure CDA is consistent with the generally accepted one-step mechanism for the thermal degradation of CDA,32,33 whereas the mass loss curves after adding [BMIM]BF4 are consistent with the two steps according to Fig. 6(b). It is clearly shown that the addition of [BMIM]BF4 decreases the thermal stability of CDA. The Td value decreased from 375 °C for pure CDA to 330 °C with 35 wt% [BMIM]BF4. The thermal degradation of CDA extends to the amorphous phase after adding [BMIM]BF4. With the addition of [BMIM]BF4, the crystals of CDA are destroyed and the degree of crystallinity of CDA decreased (XRD characterization). The amorphous CDA appears to be easily degraded at the start of the thermal degradation and thus showed a lower thermal stability.
Steady shear rheological behaviors of the [BMIM]BF4/CDA melt
The effect of plasticizer on melt viscosity of the [BMIM]BF4/CDA blends was evaluated for apparent viscosity at different temperatures and different contents. Fig. 7 presents the curves of apparent viscosity versus shear rates for 25 wt% [BMIM]BF4/CDA samples at temperatures of 170–200 °C. The blends exhibit typical shear-thinning characteristics, i.e., decrease of viscosity with increase of shear rate, which results from unlocking the tangles of the molecular chain and orienting in the direction of the shear. The influence of [BIMI]BF4 is more evident in the lower shear rate range, whereas at higher shear rates, the influence diminishes due to the shear thinning effect of the polymer melt.34 Moreover, the apparent viscosity of 25 wt% [BMIM]BF4/CDA decreases with the increase of temperature because more energy is provided for the molecules with the increase of temperature.35 Moreover, the Carreau model fitting parameters (Table 1) represent the zero shear rate viscosity, and the power-law exponent decreased with the increase of temperature. The decreasing power-law exponent indicates a high deviation from Newtonian fluids of the [BMIM]BF4/CDA melt.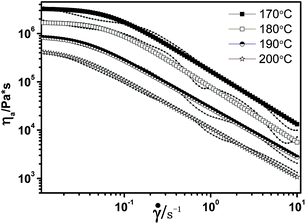 | ||
| Fig. 7 Apparent viscosity curves and Carreau model fitting curves for 25 wt% [BMIM]BF4 in [BMIM]BF4/CDA. | ||
| Temperature | 170 °C | 180 °C | 190 °C | 200 °C |
|---|---|---|---|---|
| η0/Pa s | 3.28 × 10⁶ | 1.70 × 10⁶ | 8.78 × 10⁵ | 4.53 × 10⁵ |
| λ/s | 10.11 | 15.20 | 23.12 | 30.42 |
| n | 0.48 | 0.41 | 0.32 | 0.30 |
As shown in Fig. 8, the [BMIM]BF4/CDA blends were evaluated for apparent viscosity by a function of different shear rates at 190 °C. Increasing the content of the [BMIM]BF4 resulted in a consistent decrease in apparent viscosity. This retrogression in apparent viscosity indicated that the macromolecular chain changed to move more easily during the compounding process. This phenomenon is in accordance with the previous results of the decrease in Tg from the DMA test. Table 2 presents the zero shear rate viscosity decrease while the power-law exponent increases with increase in the content of [BMIM]BF4.
| Content of [BMIM]BF4 | 15 wt% | 25 wt% | 35 wt% |
|---|---|---|---|
| η0/Pa s | 1.69 × 10⁶ | 8.78 × 10⁵ | 5.46 × 10⁴ |
| λ/s | 15.71 | 23.12 | 40.01 |
| n | 0.20 | 0.32 | 0.43 |
The three-parameter Carreau viscosity model was used to express the changes from the Newton region to non-Newton region and to predict the zero-shear viscosity from the apparent viscosity data. The three-parameter Carreau viscosity model is given by eqn (1):36
 | (1) |
![[small gamma, Greek, dot above]](https://www.rsc.org/images/entities/i_char_e0a2.gif) is the shear rate, η0 is the zero shear rate viscosity, λ is a constant with the relaxation time in seconds and n is the power-law exponent.
is the shear rate, η0 is the zero shear rate viscosity, λ is a constant with the relaxation time in seconds and n is the power-law exponent.
The temperature of the experiment is above the glass transition temperature of the polymer melt, where the relationship of viscosity and temperature usually follows the Arrhenius equation to a good approximation. The Arrhenius equation is given by eqn (2):37
| ηa = AeEη/RT | (2) |
In this equation, ηa is the viscosity at temperature T, Eη is the flow activation energy, which represents the sensitivity of viscosity to temperature, A is a constant characteristic of polymer and its molecular weight, R is the universal gas law constant, and T is the absolute temperature. The Arrhenius plot of ln![[thin space (1/6-em)]](https://www.rsc.org/images/entities/char_2009.gif) ηa versus 1/T is shown in Fig. 9. From the slope of the linear fit, the flow activation energy Eη can be calculated and the data are shown in Table 3.
ηa versus 1/T is shown in Fig. 9. From the slope of the linear fit, the flow activation energy Eη can be calculated and the data are shown in Table 3.
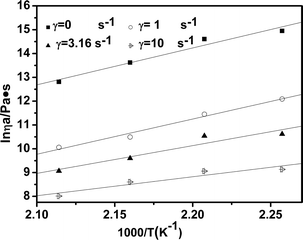 | ||
| Fig. 9 Calculated viscous flow activation energy by using the Arrhenius equation at different shear rates. | ||
| Shear rate (s−1) | 0 | 1 | 3.16 | 10 |
|---|---|---|---|---|
| Eη/R | 15.47 | 14.78 | 11.66 | 7.97 |
| Eη kJ mol−1 | 128 | 123 | 97 | 66 |
| R0 (correlation coefficient) | 0.98127 | 0.9917 | 0.9565 | 0.9492 |
As we know, Eη is the energy that one molecule needs to overcome the interaction between molecules to change its position; moreover, it is a significant factor in processing and especially in spinning. Fig. 8 calculates the viscous flow activation energy by using Arrhenius equation at different shear rates and the data are listed in Table 3. From the data, we can observe that the Eη decreases from 128 kJ mol−1 to 66 kJ mol−1 when the shear rate increases from 0 s−1 to 10 s−1. Fig. 10 and Table 4 show that Eη decreases with the increase in the [BMIM]BF4 content, which means that viscosity is sensitive to the temperature. Therefore, the viscosity of the [BMIM]BF4/CDA melt could be regulated by temperature, shear rate and the [BMIM]BF4 content.
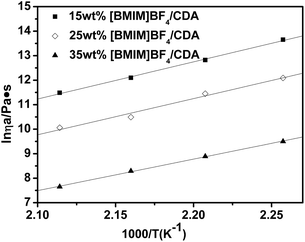 | ||
| Fig. 10 Calculated viscous flow activation energy by using the Arrhenius equation for different [BMIM]BF4 contents at 1 s−1. | ||
| Content of [BMIM]BF4 | 15 wt% | 25 wt% | 35 wt% |
|---|---|---|---|
| Eη/R | 16.14 | 14.78 | 12.87 |
| Eη kJ mol−1 | 136 | 123 | 107 |
| R0 (correlation coefficient) | 0.9981 | 0.9917 | 0.9982 |
Effect of temperature and concentration on the structural viscosity index
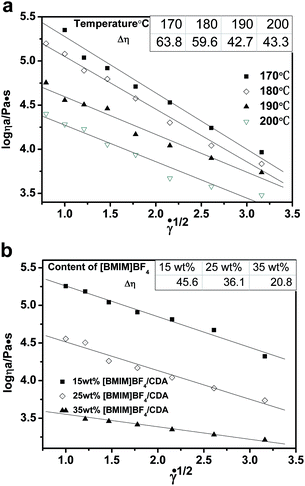
The structural viscosity index characterizing the structure degree of the polymer fluid is an important parameter measuring the spinnability of the spinning fluid. In addition, it reflects the entanglement degree of internal macromolecular chains of the fluid. The structural viscosity index is defined by the following eqn (3):38
 | (3) |
In this equation, Δη is the structural viscosity index, ηa is the apparent viscosity, and ![[small gamma, Greek, dot above]](https://www.rsc.org/images/entities/i_char_e0a2.gif) is the shear rate. The structural viscosity index, Δη, in the area of non-Newtonian is Δη > 0. With decrease in the structural viscosity index, Δη, the structuredness of the spinning fluid decreased, which indicated that the spinnability of the fluid was excellent. The structural viscosity indexes at different temperatures for the 25 wt% [BMIM]BF4/CDA melt are shown in Fig. 11(a) and with different concentrations at 190 °C in Fig. 11(b).
is the shear rate. The structural viscosity index, Δη, in the area of non-Newtonian is Δη > 0. With decrease in the structural viscosity index, Δη, the structuredness of the spinning fluid decreased, which indicated that the spinnability of the fluid was excellent. The structural viscosity indexes at different temperatures for the 25 wt% [BMIM]BF4/CDA melt are shown in Fig. 11(a) and with different concentrations at 190 °C in Fig. 11(b).
As shown in the inset of Fig. 11(a), the structural viscosity index first decreases and then increases with the increase of the temperature. It is known that the melt can be seen as a type of network structure. The apparent viscosity decreases with the increase of the shear rate. When the shear rates were fixed, the shear-thinning tendency was only related to the macromolecular interaction. When the temperature increased, this kind of interaction become smaller, which made the structural viscosity index become smaller. Some crosslinking and degradation would occur, when the temperature got as high as 200 °C. The apparent viscosity became sensitive to the shear rate and the structural viscosity index increased. Therefore, the appropriate temperature for melt spinning of the [BMIM]BF4/CDA melt was 190 °C from the rheological experiments, which was further confirmed in the spinning process. Fig. 11(b) shows the structural viscosity index decrease with increase in the content of [BMIM]BF4. The macromolecular interaction becomes smaller because of the lesser content of CDA, which results in the decrease of the structural viscosity index.
Conclusions
In conclusion, we discussed the feasibility of CDA using [BMIM]BF4 as plasticizer. [BMIM]BF4 could strongly interact with the CDA molecule and reduce the intensity of the hydrogen bonds between CDA molecules. Moreover, [BMIM]BF4 could effectively destroy the crystallization of CDA and decrease its crystallinity, thus the thermal stability decreased with the addition [BMIM]BF4. The surface of [BMIM]BF4/CDA films became smooth and formed a homogeneous phase with the increase of [BMIM]BF4. Furthermore, the steady rheological behaviors of [BMIM]BF4/CDA were studied at different temperatures and concentrations. The results demonstrated that zero-shear viscosity decreased and power-law index increased with increase in the [BMIM]BF4 content at the same temperature. The flow activation energy decreased with the increase of shear rate. In total, the system of [BMIM]BF4/CDA was sensitive to temperature. However, the structural viscosity index decreased and then increased with the increase of temperature, which indicated that 190 °C was the optimum melt-spun temperature. The investigation provided guidance for CDA melt spinning using [BMIM]BF4 as the plasticizer.Acknowledgements
This work is supported by a grant from the National Natural Science Foundation of China (51273041) and the Fundamental Research Funds for the Central Universities (2232013D3-01).References
- S. Johannes and F. Florian, Cellulose, 2006, 159–165 Search PubMed.
- D. Richard and A. Richard, J. Appl. Polym. Sci., 1999, 77, 418–423 Search PubMed.
- P. Zugenmaier, Macromol. Symp., 2004, 208, 81–166 CrossRef CAS.
- C. Rachel, Macromol. Symp., 2004, 208, 255–265 CrossRef.
- M. Yoshioka, N. Hagiwara and N. Shiraishi, Cellulose, 1999, 6, 193–212 CrossRef CAS.
- R. Quintana, O. Persenaire, L. Bonnaud and P. Dubois, Polym. Chem., 2012, 3, 591–595 RSC.
- L. Amim, D. Blachechen and J. Petri, Therm. Anal. Calorim., 2012, 107, 1259–1265 CrossRef.
- D. Roy, M. Semsarilar, J. T. Guthrie and S. Perrier, Chem. Soc. Rev., 2009, 38, 2046–2064 RSC.
- C. Lee, M. Cho, I. Kim, J. Nam and Y. Lee, Polymer, 2009, 33, 243–247 CAS.
- S. Zepnik, S. Kabasci, H. Radusch and W. Thomas, Mater. Sci. Eng., A, 2012, 2, 152–163 CAS.
- A. K. Mohanty, A. Wibowo, M. Misra and L. T. Drzal, Polym. Eng. Sci., 2003, 43, 1151–1161 CAS.
- G. Szamel, A. Domjan and S. Klebert, Eur. Polym. J., 2008, 44, 357–365 CrossRef CAS PubMed.
- Y. Teramoto and N. Nishio, Polymer, 2003, 44, 2701–2709 CrossRef CAS.
- Y. Teramoto and N. Nishio, Biomacromolecules, 2004, 5, 397–406 CrossRef CAS PubMed.
- Y. Luan, J. Wu, M. Zhan, J. Zhang, J. Zhang and J. He, Cellulose, 2013, 20, 327–337 CrossRef CAS.
- L. M. Gan, J. Liu, L. P. Poon, C. H. Chew and L. H. Gan, Polymer, 1997, 38, 5339–5345 CrossRef CAS.
- C. Esteban and R. Javier, J. Mol. Liq., 2011, 163, 64–69 CrossRef PubMed.
- W. Hui, G. Gabriela and D. R. Robin, Chem. Soc. Rev., 2012, 41, 1519–1537 RSC.
- M. Scott, M. Rahman and C. Brazel, Eur. Polym. J., 2003, 39, 1947–1953 CrossRef CAS.
- M. Scott, M. Benton, M. Rahman and C. S. Brazel, Ionic liquids as green solvents: progress and prospects, 2003, vol. 856, pp. 468–477 Search PubMed.
- D. Sun and J. Zhou, AIChE J., 2013, 59, 2630–2639 CrossRef CAS.
- Y. Tian, K. Han, H. Qin, H. Rong, B. Yan, D. Wang, S. Liu and M. Yu, Adv. Mater. Res., 2012, 476, 2151–2157 CrossRef.
- T. A. Kareem and A. A. Kaliani, Ionics, 2013, 19, 1559–1565 CrossRef CAS.
- L. Dai and L. Ying, Macromol. Mater. Eng., 2002, 287, 509–514 CrossRef CAS.
- X. Jiang, T. Jiang and X. Zhang, Polym. Eng. Sci., 2013, 1181–1186 CAS.
- S. Qi, N. Sun, B. Zhao and P. Hu, Guangzhou Chem., 1993, 47–52 Search PubMed.
- H. Zhang, J. Wu, J. Zhang and J. He, Macromolecules, 2005, 38, 8272–8277 CrossRef CAS.
- S. W. Kuo and H. T. Tsai, Macromolecules, 2009, 42, 4701–4711 CrossRef CAS.
- L. D. Gioia, B. Cuq and S. Guilbert, Int. J. Biol. Macromol., 1999, 24, 341–350 CrossRef.
- B. P. Shtarkman and I. N. Razinskaya, Acta Polym., 1983, 34, 514–520 CrossRef CAS.
- R. Sothornvit and J. Krochta, J. Food Eng., 2001, 50, 149–155 CrossRef.
- C. Maria and V. Ana, Polym. Degrad. Stab., 2003, 149–155 Search PubMed.
- G. Sabyasachi, M. Laurie and R. Patrick, J. Anal. Appl. Pyrolysis, 2012, 90, 33–41 Search PubMed.
- Y. Ding, N. Peng and T. Chung, J. Membr. Sci., 2011, 380, 87–97 CrossRef PubMed.
- H. A. Brrnes; J. F. Hutt and K. Walter, An Introduction to Rheology, Elsevier Science Publishers, Amsterdam, 1989, pp. 170–201 Search PubMed.
- X. Zhu, X. Chen and X. Wang, Polymer Advance Technology, 2013, vol. 24, pp. 90–96 Search PubMed.
- K. Laidler, J. Chem. Educ., 1984, 61, 494–498 CrossRef CAS.
- J. Cai, P. Fei, Z. Xiong, Y. Shi, K. Yan and H. Xiong, Carbohydr. Polym., 2013, 92, 11–18 CrossRef CAS PubMed.
| This journal is © The Royal Society of Chemistry 2015 |


