NIR sensing of Zn(II) and subsequent dihydrogen phosphate detection by a benzothiazole functionalized ninhydrin based receptor†
Abhijit Gogoi and
Gopal Das*
Department of Chemistry, Indian Institute of Technology Guwahati, Guwahati 781039, India. E-mail: gdas@iitg.ernet.in; Fax: + 91 361 2582349; Tel: +91 361 2582313
First published on 17th October 2014
Abstract
A benzothiazole functionalized ninhydrin based chemosensor (L1), exhibits selective naked eye detection of biologically important zinc ions (from light yellow to orange) accompanied by a ‘turn-on’ fluorescence emission response in the near infra-red (NIR) region. Most importantly, Zn2+ ion induced ‘turn-on’ fluorescence emission is also preserved in the presence of Cd2+ and most of the other competing metal ions which clearly suggests the high sensitivity of the chemosensor towards Zn2+. The Job's plot suggests 1![[thin space (1/6-em)]](https://www.rsc.org/images/entities/char_2009.gif) :
:![[thin space (1/6-em)]](https://www.rsc.org/images/entities/char_2009.gif) 1 binding of the L1 with the Zn2+ ion with a detection limit of 6 nM. Detailed 1H NMR titrations were also conducted to understand the binding behaviour of L1 towards the Zn2+ ion. The ‘L1–Zn2+ ensemble’ further shows a ratiometric response to H2PO4− among other competitive anions and nucleotides in the same experimental conditions.
1 binding of the L1 with the Zn2+ ion with a detection limit of 6 nM. Detailed 1H NMR titrations were also conducted to understand the binding behaviour of L1 towards the Zn2+ ion. The ‘L1–Zn2+ ensemble’ further shows a ratiometric response to H2PO4− among other competitive anions and nucleotides in the same experimental conditions.
Introduction
The design and development of new fluorogenic receptors for metal ions is a promising research area in chemistry due to their essential roles in ecology, biology and clinical applications.1 Fluorescent chemosensors are attractive because of their intrinsic high sensitivity, ease of handling, and real-time monitoring with a fast response time.2 Among the metal ions, selective and sensitive detection of Zn2+ ion is an intriguing task due to the similar spectroscopic properties also exhibited by the toxic Cd2+ ion.3 Zn2+ ion is the second most abundant transition metal ion in the human body after iron.4,5 The total concentration of Zn2+ in mammalian cells is estimated to be in the range of 100 to 500 μM; the largest fraction is tightly bound to metallo-proteins.6Again among the various features of a chemosensor, highly selective ‘turn-on’ emission at higher wavelength is a desirable property and mostly cited in recent years. Chemosensors which exhibit larger Stoke's shifts and emit in the near infra-red (NIR) region (650 nm–900 nm) helps them to overcome the auto fluorescence occurring from biological samples, photo damage etc.7 Again, the investigation of new anion sensors is an another hot research area of host–guest chemistry as the anions are ubiquitous in nature and the anionic species are of fundamental importance in many chemical, biological, medicinal, environment and industrial processes.8 In particular among all anions, phosphate and molecules featuring this group are widely studied because of their omnipresent presence in a range of life processes. Again among them, dihydrogen phosphate plays a pivotal role in signal transduction, energy storage, and construction of the backbone of DNA and RNA.9 However, only a few H2PO4− ion based receptors are known till now in literature which responds to the aforementioned anion either with enhancement or quenching of fluorescence.10 But a ratiometric sensor is always superior from practical point of view as they are avoid of normal quenching process which occurred due to higher sensor concentration, photobleaching, microenvironment around the sensor molecule etc.11 Various approaches utilizing hydrogen bonding, anion–π interaction, and the chelation mode of interactions have been adopted to the development of fluorescent chemosensors for pyrophosphate, phosphate ions, ATP/guanosine 5′-triphosphate (GTP), or phosphorylated peptide.12 Among these techniques, the metal-ligand complexes are turning out as most promising and attractive tool for anion recognition and sensing. Anions have a usual tendency for the metal–ligand complexes and their structural and geometrical flexibility can provide an excellent way of organizing anion binding groups for optimal host guest interactions. In this regard, Zn2+, Cd2+ and Cu2+ complexes are extensively studied because of their normal attraction towards phosphorylated anions.13
In our continuing effort to design and synthesis of new sensor molecules,14 herein we report a benzothiazole functionalized ninhydrin derived chemosensor (E)-2-(2-(11H-indeno[1,2-b]quinoxalin-11-ylidene) hydrazinyl) benzo[d]thiazole (L1), which exhibits highly selective and sensitive ‘turn-on’ fluorescence response only to Zn2+ ion in longer wavelength NIR region. Zn2+ responsive chemosensors which show ‘turn-on’ fluorescence response in the NIR region are very limited.15 Ninhydrin is known for its widespread applications in the fields of biochemical, analytical and forensic works. Again, the ninhydrin derived chemosensors exhibited beautiful colormetric response to various anions and metal ions in aqueous/mixed aqueous solution, but there are very few references known till date.16 The only Zn2+ ion induced Stoke's shift of nearly 130 nm was also maintained in physiological medium. Further the zinc–chemosensor ensemble could successfully distinguish H2PO4− among other competitive phosphorylated anions.
Experimental section
General information and materials
All of the materials for synthesis were purchased from commercial suppliers. The absorption spectra were recorded on a Perkin-Elmer Lamda-25 UV-Vis spectrophotometer using 10 mm path length quartz cuvettes in the range 250–700 nm wavelengths, while the fluorescence measurements were carried on a Horiba Fluoromax-4 spectrofluorometer using 10 mm path length quartz cuvettes with a slit width of 5 nm at 298 K. The mass spectra of L1 obtained using Waters Q-ToF Premier mass spectrometer. The NMR spectra were recorded on a Varian FT-400 MHz instrument and the chemical shifts were presented in parts per million (ppm) on the scale. The following abbreviations were used to describe spin multiplicities in 1H NMR spectra: s = singlet; d = doublet; t = triplet; m = multiplet. The IR spectra were recorded on a Perkin Elmer-Spectrum One FT-IR spectrometer with KBr disks in the range 4000–450 cm−1.X-ray crystallography
The intensity data were collected using a Bruker SMART APEXII CCD diffractometer, equipped with a fine focus 1.75 kW sealed tube Mo-Kα radiation (λ = 0.71073 Å) at 298 (2) K, with increasing ω (width of 0.3° per frame) at a scan speed of 3 s per frame. The SMART software was used for data acquisition. Data integration and reduction were undertaken with SAINT and XPREP17 software. Multi-scan empirical absorption corrections were applied to the data using the program SADABS.18 Structures were solved by direct methods using SHELXS-97 and were refined by full-matrix least squares on F2 using SHELXL-97 program package.19 In the crystal structure, non-hydrogen atoms were refined anisotropically. Hydrogen atoms attached to all carbon atoms were geometrically fixed. Structural illustrations have been generated using ORTEP-3 and MERCURY 1.3 for Windows.20 Crystal data, as well as details of data collection and refinement for L1 are summarized below.Empirical formula: C22H13N5S, Mw: 379.44, T = 298 (2) K, monoclinic, space group: P2(1)/c, a = 9.9373 (12) Å, b = 13.5639 (16) Å, c = 13.7420 (17) Å, α = 90°, β = 102.302 (6)°, γ = 90.00°, V = 1809.73 Å3, Z = 4, Dx (g cm−3) = 1.393, m = 0.197 mm−1, F(000) = 784, reflections collected/unique = 25![[thin space (1/6-em)]](https://www.rsc.org/images/entities/char_2009.gif) 344/4521 [Rint = 0.0325], R1 = 0.0435, wR2 = 0.1315 [I > 2σ(I)], R1 = 0.0570, wR2 = 0.1517 (all data), GOF(F2) = 0.920.
344/4521 [Rint = 0.0325], R1 = 0.0435, wR2 = 0.1315 [I > 2σ(I)], R1 = 0.0570, wR2 = 0.1517 (all data), GOF(F2) = 0.920.
Results and discussion
Designing aspects of L1
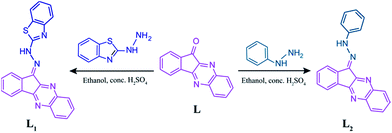
The chemosensor consists of a signalling unit (chromophore/fluorophore) and a guest binding unit (receptor) integrated into one species through an imine bond. The benzothiazole unit thus increases the conjugation of the system and also act as good chelator for the selective binding of a metal ion. Again, the quinoxaline core also acts as chelating fluorophore. To understand the importance of the benzothiazole substituent in the sensing process, a non-chelating substituent phenyl is attached to achieve chemosensor L2.Synthesis of the sensor molecules
The synthetic scheme of the probe (L1) and the control molecule (L2) are shown in Scheme 1. The structure of the L1 is fully confirmed by NMR, mass and single crystal X-ray diffraction.Room temperature stirring of ninhydrin (1.02 mmol) and o-phenylene diamine (1.5 mmol) in methanol with few drops of concentrated sulphuric acid for 3 hours give a flappy orange like precipitate (L). To a solution of L (1.02 mmol) in ethanol, 2-hydrazinylbenzothiazole (1.5 mmol) and few drops of concentrated sulphuric acid are added. The resulting solution is stirred for 4 hours at room temperature. It give an orange red type precipitate which then filtered and wash with ethanol and finally with water to give pure L1. Similarly condensation of L with phenyl hydrazine gives L2.
Important spectroscopic data for receptor L1: yield = 70%; 1H NMR (400 MHz, CDCl3, TMS): 13.471 (s, 1H), 8.250 (d, 1H), 8.151 (t, 2H), 7.992 (d, 1H), 7.781 (m, 4H), 7.568 (m, 2H), 7.419 (t, 1H), 7.254 (d, 1H). 13C: 166.872, 153.509, 151.984, 147.317, 141.952, 140.411, 138.082, 137.558, 135.077, 131.950, 131.609, 130.865, 130.395, 129.803, 129.727, 129.660, 126.297, 123.231, 122.457, 121.357, 120.742, 94.653. ESI-MS: m/z Calculated for C22H13N5S [M] = 379.04, found [M + H+] = 380.1019.
Important spectroscopic data for receptor L2: yield = 75%, 1H NMR (400 MHz, CDCl3, TMS): 12.874 (s, 1H), 8.180 (d, 1H), 8.139 (m, 2H), 7.795 (d, 1H), 7.7541 (m, 4H), 7.561 (t, 2H), 7.480 (t, 1H), 7.060 (t, 1H), 13C: 1153.212, 147.645, 143.511, 141.437, 140.583, 140.011, 132.476, 131.851, 129.921, 129.822, 129.647, 129.365, 129.304, 128.495, 122.455, 120.350, 114.173, 66.058. ESI-MS: m/z calculated for C21H14N4 [M] = 322.12, found [M + H+] = 323.1382.
UV-vis and fluorescence spectral studies
Stock solutions of various ions (1 × 10⁻³ mol L−1) are prepared in deionized water. Chloride or nitrate salts are used for metal ions while tetrabutyl, tetraethyl or sodium salts of the corresponding anions and nucleotides are used for the preparation of anion stock solutions. The stock solution of L1 and L2 (5 × 10⁻³ mol L−1) are prepared in dry DMF and then diluted to 10 × 10−6 mol L−1 with acetonitrile. For the titration experiments, each time a 1 × 10⁻³ M solution of L1 (1 × 10⁻⁵ mol L−1) in a quartz optical cell of 1 cm optical path length is titrated with the escalating concentration of stock solutions by using a micropipette. For the competitive selectivity experiment, fluorescence emission of the L1–Zn2+ ensembles are collected in the absence and presence of other competitive metal ions in an excess (50 equiv.) in the aforementioned experimental medium.Evaluation of the apparent binding constant
Receptor L1 with an effective concentration of 10.0 × 10⁻⁶ M is used for the emission titration studies with a Zn2+ solution (0.2 × 10⁻³ M). The effective Zn2+ concentration is varied between 0 and 60 × 10−5 M for this titration.Calculations for the apparent binding constants using spectrophotometric titration data
The apparent binding constant for the formation of the respective complexes are evaluated using the Benesi–Hildebrand (B–H) plot (eqn (1)).21| 1/(A − A0) = 1/{K(Amax − A0)C} + 1/(Amax − A0) | (1) |
A0 is the absorbance of L1 at maximum, A is the observed absorbance at that particular wavelength in the presence of a certain concentration of the analyte (C), Amax is the maximum absorbance value that was obtained at λ = 536 nm during titration with varying analyte concentration, K is the apparent binding constant (M−1) and was determined from the slope of the linear plot.
Finding the detection limit
The detection limit was calculated on the basis of the fluorescence titration. The fluorescence emission spectrum of L1 was measured 10 times, and the standard deviation of blank measurement was achieved. To gain the slope, the ratio of the fluorescence emission at 654 nm was plotted as a concentration of Zn2+.So the detection limit was calculated with the following equation
| Detection limit = 3σ/k | (2) |
Result and discussion
Self-assembly behaviour of L1 in solid state
Block shaped single crystals of L1 were grown from slow evaporation of its propanol solution. It crystallizes in monoclinic system with P21/c space group (Z = 4). The intramolecular N2–H⋯N4 (2.084 Å) hydrogen bonding made the crystal to adopt a trans-amine form (C15⋯N1 = 1.305 Å, C16⋯N2 = 1.364 Å, C16⋯N3 = 1.309 Å) and thus forced to adopt a planer geometry. This was further helpful to decorates a number of π⋯π interactions in the packing figure.Each of the receptor molecule interacts with two other receptor molecules through π⋯π interactions, where the quinoxaline framework was sandwich between quinoxaline framework of one and benzothiazole functionality of the other receptor. A short C–H⋯π (2.665 Å) interaction from a third receptor molecule to the benzothiazole group extends the packing further (Fig. 1).
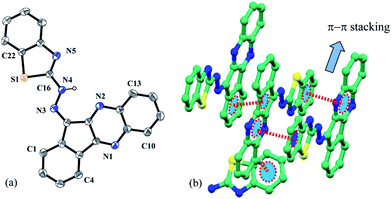 | ||
| Fig. 1 (a) ORTEP presentation of L1 with 30% ellipsoid probability (hydrogen atoms are omitted for clarity). (b) Various non-covalent interactions in the crystal. | ||
Absorption based selectivity and sensitivity study with various metal ions
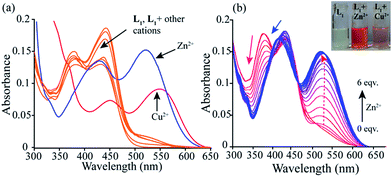
The sensing ability of the probe L1 was investigated in acetonitrile solution with various metal ions such as Zn2+, Cd2+, Co2+, Pb2+, Ni2+, Cu2+, Fe3+, Al3+, Cr3+, Hg2+, Ag+, Mg2+, Ba2+, Mn2+, Na+, K+, Ca2+ etc. The probe L1, exhibited two characteristic absorption peaks nearly at 380 nm and at 442 nm in acetonitrile solution originating from π–π* transitions and long conjugation present in the polyaromatic system. However, as evident from Fig. 2a, a noticeable change in UV-Vis spectral pattern was manifested only in presence of Zn2+ and Cu2+ ions.22 Interaction of the probe with the Zn2+ ion leads to emerge new absorption peaks at 536 nm and 418 nm. This was probably due to Zn2+ coordination induced increase in conjugation of L1 which in turn leads to concomitant visual colour change of the solution from light yellow to orange (inset Fig. 2b). Further, on titration the probe solution with increasing Zn2+ ion concentration showed a progressive decrease in absorbance of the characteristic 380 nm peak with concomitant increase in absorbance at 536 nm (Fig. 2b and S10†). The well-defined isobestic point at 468 nm also indicates the formation of a new Zn2+–L1 complex. Again, addition of higher equivalents of Cu2+ ion (10 equiv.) produces a new peak at 454 nm and a red shifted absorption maxima at 550 nm. The new isobestic points at 460 nm and 366 nm were the indicative of the formation of a new Cu2+–L1 complex. This also leads to a visual change in colour of the solution from light yellow to light pink. More importantly, Cd2+ ion, the electronic congener of Zn2+ ion, do not produce any significant change in UV-vis pattern.Fluorescence spectroscopic selectivity study of L1 with various metal ions
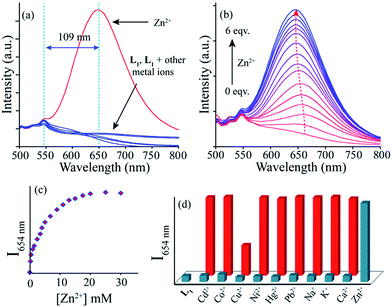
When excited at 440 nm, the probe L1 showed a distinct emission maximum at 545 nm (quantum yield <0.002) with a Stoke's shift of 103 nm in acetonitrile. In good agreement with the finding for absorption spectral studies, only Zn2+ ion promotes significant fluorescent enhancement to chemosensor L1 (Fig. 3a). Addition of Zn2+ ion leads to emerge a new emission maximum at 654 nm with 15.5 fold enhancement in intensity and Stoke's shift of 130 nm from a 10 μM solution (fluorescence quantum yield (Φ) = 0.11). Other metal ions, such as Cd2+, Co2+, Pb2+, Ni2+, Fe3+, Al3+, Cr3+, Hg2+, Ag+, Mg2+, Ba2+, Mn2+, Na+, K+, Ca2+ etc. caused no fluorescence change. Similarly, the coloured Cu2+ solution was also remain fluorescence inactive. Further, the titration spectra (Fig. 3b) of the chemosensor L1, with increasing Zn2+ ion concentration manifested a linear enhancement in intensity nearly at λ = 654 nm while the 545 nm peak was hardly got effected. A plot of fluorescent intensity as a function of Zn2+ ion concentration revealed that close to 20 μM concentration of Zn2+ ion the fluorescent intensity increase sharply, and after that, the rate of enhancement was reduced (Fig. 3c). Again, the linear (R2 = 0.9902) relationship of log(FI) (fluorescence intensity) with log[Zn2+] (Fig. S11†) also indicates that chemosensor L1 can be used to determine Zn2+ ion concentration. And based on the fluorescence titration experiment, the calculated detection limit was 6 nM.Rapid isomerisation around C![[double bond, length as m-dash]](https://www.rsc.org/images/entities/char_e001.gif) N and photo electron transfer (PET) from N of benzothizole to quinoxaline fluorophore are the probable cause of weak fluorescence of L1. While the imine N is essential for the chelation with most metal ions, to verify the importance of benzothiazole group, a control compound L2 was synthesized. As expected, L2 do not show any selectivity to any of the aforementioned cations under the same experimental condition (Fig. S12†). It gives the idea of involvement of imine N, benzothiazole N/S and quinoxaline N (ref. 23) in the chelation with Zn2+ ion which thus cease the isomerisation process and the fluorescence increases as a result of chelation enhanced emission (CHEF) effect. Since the border line Zn2+ ion can interact with both hard and soft binding sites and the chemosensor L1 can provide required number of proper binding sites, thus it shows high selectivity for Zn2+ ions.
N and photo electron transfer (PET) from N of benzothizole to quinoxaline fluorophore are the probable cause of weak fluorescence of L1. While the imine N is essential for the chelation with most metal ions, to verify the importance of benzothiazole group, a control compound L2 was synthesized. As expected, L2 do not show any selectivity to any of the aforementioned cations under the same experimental condition (Fig. S12†). It gives the idea of involvement of imine N, benzothiazole N/S and quinoxaline N (ref. 23) in the chelation with Zn2+ ion which thus cease the isomerisation process and the fluorescence increases as a result of chelation enhanced emission (CHEF) effect. Since the border line Zn2+ ion can interact with both hard and soft binding sites and the chemosensor L1 can provide required number of proper binding sites, thus it shows high selectivity for Zn2+ ions.
The selectivity of the chemosensor for Zn2+ over other competing metal ions was preserved in most of the cases (Fig. 3d). However, the switch ON red fluorescence of L1 with Zn2+ ion was interfered by the copper ion only which switches off the fluorescence probably due to its paramagnetic nature. Thus this fluorish ‘L1–Zn2+ ensemble’ can also be used for fluorescent based sensing of Cu2+. Pandey et al. have used similar approach to report ‘on–off–on’ type sensing of Cu2+ and Ag+ ions with a fluorescent Zn(II) complex.24 Anyway, the interference from the Cu2+ ion can be removed by with the addition of S2− ion which restores the fluorescence based on the well-known strong affinity of S2− for Cu2+. However, under similar experimental condition, interaction of S2− anion with ‘chemosensor-Zn2+ ensemble’ caused no change in the fluorescence output signal (Fig. S13†). Again, Cu2+ ion would have little influence in vivo, as they exist at very low concentrations. Other paramagnetic metal ions like Co2+ and Ni2+ do not affect the fluorescence emission of the ‘chemosensor-Zn2+ ensemble’.
Considering an environmental application, the fluorescence experiment was repeated in an optimized mixed aqueous solution. The receptor could also sense the Zn2+ ion in presence of other interfering metal ions in an acetonitrile-buffer (HEPES) 7.4 (8![[thin space (1/6-em)]](https://www.rsc.org/images/entities/char_2009.gif) :
:![[thin space (1/6-em)]](https://www.rsc.org/images/entities/char_2009.gif) 2) mixtures with nearly 6 fold enhancement in intensity (Fig. S14†) at the same wavelength.
2) mixtures with nearly 6 fold enhancement in intensity (Fig. S14†) at the same wavelength.
Application of the ‘L1–Zn2+ ensemble’
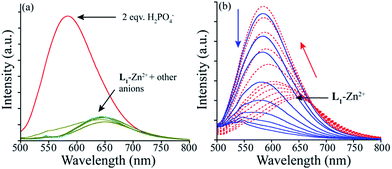
We explore the potential of this pre-synthesized L1–Zn2+ ensemble as sensor for common anionic analytes and nucleotides (Fig. 4a). This revealed that among the tested anions; F−, Cl−, Br−, I−, HSO4− and NO3− do not affect the fluorescence emissive property of the L1–Zn2+ ensemble. However, H2PO4− displayed an interesting concentration dependent ratiometric fluorescence response while AMP, ADP, ATP had no effect. To gain a better insight into the fluorescence behaviour, titration experiment was carried out with a fixed concentration of L1–Zn2+ ensemble and a varying amount of H2PO4− (Fig. 4b). The systematic variation of the amount of H2PO4− displayed a continuous blue shifting of the emission peak from 654 nm to 584 nm with increasing intensity. After 2.0 mole equivalents of H2PO4− ions, the L1–Zn2+ ensemble displayed a 22 fold enhancement in fluorescence emission intensity at 584 nm. However, addition of higher mole equivalents of the same further quenched the emission and thus a discernible colour change from orange to yellow was observed. The initial fluorescence enhancement was probably due to formation of H2PO4− complex with the L1–Zn2+ ensemble where the additional hydrogen bonding with the receptor might be helpful for the anion to interact with the L–Mn+ complex. Such type of emission enhancement was also described by Kaur et al. with a hexaphenylbenzene derivative-Zn2+ ensemble.10d Further addition of H2PO4− anion may result in the de-complexation via initial coordination of the anion to the metal centre which was manifested by overall quenching of the fluorescence.Further to understand more about the anion binding behaviour, we have also analyzed the changes in absorption spectra of the same L1–Zn2+ ensemble with the aforementioned anions and nucleotides. This revealed the resemblance of the spectra obtained after addition of excess H2PO4− anion to the L1–Zn2+ ensemble with the free L1 (Fig. S15†). The absorption titration spectra (Fig. S16†), revealed a consistent decrease in absorbance of the peak at 536 nm with concomitant increase in absorbance at 380 nm, which was the cause of the observed colour change from orange to very light yellow. Similar to the fluorescence results, other anions and nucleotides caused no change to the absorption pattern of ‘L1–Zn2+ ensemble’.
Binding mode and composition of metal complex
For better understanding of the sensing mechanism and the resulting metal ion–sensor complex, Job's plot and 1H NMR titration were carried out. The apparent binding constant (K) for the formation of L1–Zn2+ complex was calculated by using B–H method from the absorption titration spectra. A 1![[thin space (1/6-em)]](https://www.rsc.org/images/entities/char_2009.gif) :
:![[thin space (1/6-em)]](https://www.rsc.org/images/entities/char_2009.gif) 1 binding stoichiometry was suggested by the Job's plot on the basis of change in absorbance at 536 nm and the apparent binding constant value was found to be 8 × 10⁴ M−1 (Fig. S17†).
1 binding stoichiometry was suggested by the Job's plot on the basis of change in absorbance at 536 nm and the apparent binding constant value was found to be 8 × 10⁴ M−1 (Fig. S17†).
However, due to the poor solubility of the sensor molecule in CD3CN, the NMR titration was carried out in CDCl3 solution. It showed a singlet in the very downfield region of the spectra which might be the NH proton of the benzothiazole unit due to the conjugation in the system. However, addition of Zn2+ ion causes disappearance of this signal (Fig. 5). A close inspection in the titration stack plot also revealed that the CH(1) proton undergoes a downfield shift from 8.250 ppm to 8.286 ppm upon addition of 1 equivalent of Zn2+ ion, while CH(2) proton shifted upfield from 8.151 to 8.132 and CH(3) proton shifted from 7.991 ppm to 7.961 ppm. Negligible changes were observed for the rest of the protons which means that these CHs were not bound to zinc ion. Based on these a plausible binding scheme is also represented in Fig. 5, where the nitrogen atoms of benzothiazole, quinoxaline and hydrazide functionalities are the most probable chelating atoms.
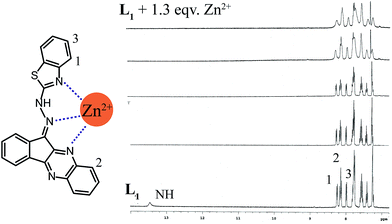 | ||
| Fig. 5 1H NMR stack plot of L1 with increasing concentration of Zn2+ ion in CDCl3 at room temperature with the probable binding mode. | ||
Conclusion
In conclusion, we have synthesized a novel benzothiazole functionalized ninhydrin based chemosensor L1, which impels excellent colorimetric and ‘turn-on’ fluorometric response in near infra-red region (NIR) only towards Zn2+ ion. These spectral changes are significant enough to enable naked eye detection of Zn2+ ion in physiological medium also. Most importantly, the sensitivity of L1 for Zn2+ ion was also preserved in presence of its congener Cd2+ and most of the other tested metal ions even when present in excess. The Job's plot from the titration data suggests a 1![[thin space (1/6-em)]](https://www.rsc.org/images/entities/char_2009.gif) :
:![[thin space (1/6-em)]](https://www.rsc.org/images/entities/char_2009.gif) 1 (L1–Zn2+) binding stoichiometry and the calculated detection limit was 6 nM. Nature of the Zn2+ binding mode with L1 was also analysed with 1H NMR titration. Finally, L1–Zn2+ ensemble could selectivity sense and differentiate H2PO4− from pyrophosphate, ATP, ADP etc. nucleotides and other common anions.
1 (L1–Zn2+) binding stoichiometry and the calculated detection limit was 6 nM. Nature of the Zn2+ binding mode with L1 was also analysed with 1H NMR titration. Finally, L1–Zn2+ ensemble could selectivity sense and differentiate H2PO4− from pyrophosphate, ATP, ADP etc. nucleotides and other common anions.
Acknowledgements
G.D. acknowledges CSIR (01/2727/13/EMR-II) and Science & Engineering Research Board (SR/S1/OC-62/2011) New Delhi, India for financial support, CIF IITG for providing instrument facilities. AG acknowledges IIT Guwahati for fellowship.Notes and references
- E. L. Que, D. W. Domailli and C. J. Chang, Chem. Rev., 2008, 108, 1517–1549 CrossRef CAS PubMed.
- (a) R. M. Manez and F. Sancenon, Chem. Rev., 2003, 103, 4419–4476 CrossRef PubMed; (b) J. S. Kim and D. T. Quang, Chem. Rev., 2007, 107, 3780–3799 CrossRef CAS PubMed.
- M. Waisberg, P. Joseph, B. Hale and D. Beyersmann, Toxicology, 2003, 192, 95–117 CrossRef CAS PubMed.
- C. J. Frederickson, J. Y. Koh and A. I. Bush, Nat. Rev. Neurosci., 2005, 6, 449–462 CrossRef CAS PubMed.
- (a) J. M. Berg and Y. Shi, Science, 1996, 271, 1081–1085 CAS; (b) B. L. Vallee and D. S. Auld, Biochemistry, 1990, 29, 5647–5659 CrossRef CAS PubMed.
- (a) C. J. Frederickson, Int. Rev. Neurobiol., 1989, 31, 145–238 CrossRef CAS PubMed; (b) C. J. Frederickson, S. W. Suh, J.-Y. Koh, Y. K. Cha, R. B. Thompson, C. J. LaBuda, R. V. Balaji and M. P. Cuajungco, J. Histochem. Cytochem., 2002, 50, 1659–1662 CrossRef CAS PubMed; (c) G. Danscher and M. Stoltenberg, J. Histochem. Cytochem., 2005, 53, 141–153 CrossRef CAS PubMed; (d) C. J. Chang, J. Jaworski, E. M. Nolan, M. Sheng and S. J. Lippard, Proc. Natl. Acad. Sci. U. S. A., 2004, 101, 1129–1134 CrossRef CAS PubMed; (e) P. D. Zalewski, S. H. Millard, I. J. Forbes, O. Kapaniris, A. Slavotinek, W. H. Betts, A. D. Ward, S. F. Lincoln and I. Mahadevan, J. Histochem. Cytochem., 1994, 42, 877–884 CrossRef CAS PubMed; (f) B. Lukowiak, B. Vandewalle, R. Riachy, J.-K. Conte, V. Gmyr, S. Belaich, J. Lefebvre and F. Pattou, J. Histochem. Cytochem., 2001, 49, 519–528 CrossRef CAS PubMed.
- (a) Z. Guo, W. Zhu, M. Zhu, X. Wu and H. Tian, Chem.–Eur. J., 2010, 16, 14424–14432 CrossRef CAS PubMed; (b) X. Peng, T. Wu, J. Fan, J. Wang, S. Zhang, F. Song and S. Sun, Angew. Chem., Int. Ed., 2011, 50, 4180–4183 CrossRef CAS PubMed.
- (a) R. M. Duke, E. B. Veale, F. M. Pfeffer, P. E. Kruger and T. Gunnlaugsson, Chem. Soc. Rev., 2010, 39, 3936–3953 RSC; (b) J. L. Sessler, P. A. Gale and W.-S. Cho, Anion Receptor Chemistry, RSC Publishing, Cambridge, UK, 2006 Search PubMed.
- W. Saenger, Principles of Nucleic Acid Structure, Springer, New York, 1988 Search PubMed.
- (a) A. Rostami, C. J. Wei, G. Guérin and M. S. Taylor, Angew. Chem., Int. Ed., 2011, 50, 2059–2062 CrossRef CAS PubMed; (b) C. Gao, G. Gao, J. Lan and J. You, Chem. Commun., 2014, 50, 5623–5625 RSC; (c) M. Alfonso, A. Espinosa, A. Tarraga and P. Molina, Org. Lett., 2011, 13, 2078–2081 CrossRef CAS PubMed; (d) V. Bhalla, V. Vij, M. Kumar, P. R. Sharma and T. Kaur, Org. Lett., 2012, 14, 1012–1015 CrossRef CAS PubMed; (e) J. Wang and C.-S. Ha, Analyst, 2010, 135, 1214–1218 RSC; (f) X.-L. Ni, X. Zeng, C. Redshaw and T. Yamato, J. Org. Chem., 2011, 76, 5696–5702 CrossRef CAS PubMed.
- (a) S. Das, S. Karmakar, S. Mardanya and S. Baitalik, Dalton Trans., 2014, 43, 3767–3782 RSC; (b) Z. Liu, C. Zhang, X. Wang, W. He and Z. Guo, Org. Lett., 2012, 14, 4378–4381 CrossRef CAS PubMed; (c) W.-C. Lin, S.-K. Fang, J.-W. Hu, H.-Y. Tsai and K.-Y. Chen, Anal. Chem., 2014, 86, 4648–4652 CrossRef CAS PubMed.
- (a) G. Sánchez, D. Curiel, W. Tatkiewcz, I. Ratera, A. Tárraga, J. Veciana and P. Molina, Chem. Sci., 2014, 5, 2328–2335 RSC; (b) Y. Sun, C. Zhong, R. Gong and E. Fu, Org. Biomol. Chem., 2008, 6, 3044–3047 RSC; (c) K. Ghosh, A. R. Sarkar, A. Samadder and A. R. K. Bukhs, Org. Lett., 2012, 14, 4314–4317 CrossRef CAS PubMed; (d) J.-H. Liao, C.-T. Chen and J.-M. Fang, Org. Lett., 2002, 4, 561–564 CrossRef CAS PubMed; (e) Z. Xu, N. J. Singh, J. Lim, J. Pan, H. N. Kim, S. Park, K. S. Kim and J. Yoon, J. Am. Chem. Soc., 2009, 131, 15528–15533 CrossRef CAS PubMed; (f) H. Jeon, S. Lee, Y. Li, S. Park and J. Yoon, J. Mater. Chem., 2012, 22, 3795–3799 RSC; (g) N. Ahmed, B. Shirinfar, I. Geronimo and K. S. Kim, Org. Lett., 2011, 13, 5476–5479 CrossRef CAS PubMed.
- (a) O. G. Tsay, S. T. Manjare, H. Kim, K. M. Lee, Y. S. Lee and D. G. Churchill, Inorg. Chem., 2013, 52, 10052–10061 CrossRef CAS PubMed; (b) M. Strianese, S. Milione, A. Maranzana, A. Grassia and C. Pellecchiaa, Chem. Commun., 2012, 48, 11419–11421 RSC; (c) Y. Kurishita, T. Kohira, A. Ojida and I. Hamachi, J. Am. Chem. Soc., 2012, 134, 18779–18789 CrossRef CAS PubMed; (d) W.-H. Chen, Y. Xing and Y. A. Pang, Org. Lett., 2011, 13, 1362–1365 CrossRef CAS PubMed; (e) B. B. Shi, Y. M. Zhang, T. B. Wei, P. Zhang, Q. Lin and H. Yao, New J. Chem., 2013, 37, 3737–3744 RSC; (f) M. J. Kim, K. M. K. Swamy, K. M. Lee, A. R. Jagdale, Y. Kim, S.-J. Kim, K. H. Yoo and J. Yoon, Chem. Commun., 2009, 7215–7217 RSC; (g) W. Zhu, X. Huang, Z. Guo, X. Wu, H. Yu and H. Tian, Chem. Commun., 2012, 48, 1784–1786 RSC; (h) X. Feng, Y. An, Z. Yao, C. Li and G. Shi, ACS Appl. Mater. Interfaces, 2012, 4, 614–618 CrossRef CAS PubMed.
- (a) C. Kar, M. D. Adhikari, A. Ramesh and G. Das, Inorg. Chem., 2013, 52, 743–752 CrossRef CAS PubMed; (b) B. K. Datta, S. Mukherjee, C. Kar, A. Ramesh and G. Das, Anal. Chem., 2013, 85, 8369–8375 CrossRef CAS PubMed.
- (a) J. Cao, C. Zhao, X. Wang, Y. Zhanga and W. Zhu, Chem. Commun., 2012, 48, 9897–9899 RSC; (b) J. Wang, Y. Li, E. Duah, S. Paruchuri, D. Zhou and Y. Pang, J. Mater. Chem. B, 2014, 2, 2008–2012 RSC.
- (a) A. Kumar, V. Kumar and K. K. Upadhyay, Tetrahedron Lett., 2011, 52, 6809–6813 CrossRef CAS; (b) A. Kumar, V. Kumar, U. Diwan and K. K. Upadhyay, Sens. Actuators, B, 2013, 176, 420–427 CrossRef CAS.
- Saint, Smart and XPREP, Siemens Analytical X-ray Instruments Inc., Madison, Wisconsin, USA, 1995 Search PubMed.
- G. M. Sheldrick, SADABS: software for Empirical Absorption Correction, University of Gottingen, Institute fur Anorganische Chemieder Universitat, Tammanstrasse 4, D-3400 Gottingen, Germany, 1999–2003 Search PubMed.
- (a) G. M. Sheldrick, SHELXS-97, University of Gottingen, Germany, 1997 Search PubMed; (b) G. M. Sheldrick, SHELXL-97, Program for Crystal Structure Refinement, University of Gottingen, Germany, 1997 Search PubMed.
- (a) L. J. Farrugia, ORTEP-3 for Windows – a version of ORTEP-III with a Graphical User Interface (GUI), J. Appl. Crystallogr., 1997, 30, 565 CrossRef CAS; (b) Mercury 1.3 Supplied with Cambridge Structural Database, CCDC, Cambridge, U.K., 2003–2004 Search PubMed.
- (a) H. A. Benesi and J. H. Hildebrand, J. Am. Chem. Soc., 1949, 71, 2703–2707 CrossRef CAS; (b) F. Han, Y. Bao, Z. Yang, T. M. Fyles, J. Zhao, X. Peng, J. Fan, Y. Wu and S. Sun, Chem.–Eur. J., 2007, 13, 2880–2892 CrossRef CAS PubMed.
- S. Anbu, R. Ravishankaran, M. F. C. G. Silva, A. A. Karande and A. J. L. Pombeiro, Inorg. Chem., 2014, 53, 6655–6664 CrossRef CAS PubMed.
- M. Alfonso, A. Tárraga and P. Molina, J. Org. Chem., 2011, 76, 939–947 CrossRef CAS PubMed.
- R. Pandey, P. Kumar, A. K. Singh, M. Shahid, P.-Z. Li, S. K. Singh, Q. Xu, A. Misra and D. S. Pandey, Inorg. Chem., 2011, 50, 3189–3197 CrossRef CAS PubMed.
Footnote |
| † Electronic supplementary information (ESI) available. CCDC 1000228. For ESI and crystallographic data in CIF or other electronic format see DOI: 10.1039/c4ra10556g |
| This journal is © The Royal Society of Chemistry 2014 |

