DOI:
10.1039/C4RA10570B
(Paper)
RSC Adv., 2014,
4, 55696-55708
Oxidation resistance of Mo(Si1−xAlx)2 nanocrystalline films and characterization of their oxide scales by electrochemical impedance spectroscopy
Received
16th September 2014
, Accepted 10th October 2014
First published on 10th October 2014
Abstract
To explore the influence of Al alloying on the oxidation resistance of MoSi2, four Mo(Si1−xAlx)2 nanocrystalline films, with differing Al contents, were fabricated on Ti–6A1–4V substrates by a double-cathode glow discharge technique and their cyclic oxidation behavior was characterized at 500 °C in air. The oxidation kinetics of the four Mo(Si1−xAlx)2 films was found to obey a subparabolic behavior with respect to the overall exposure, and their oxidation resistance was improved by Al additions. On the other hand, the electrochemical behavior of the oxide scales developed on the four Mo(Si1−xAlx)2 nanocrystalline films in a 3.5 wt% NaCl solution was studied using electrochemical-impedance spectroscopy (EIS). The impedance data showed that with increasing oxidation time, the oxide scales transformed from a homogeneous and dense structure to a duplex structure consisting of a porous outer layer and a denser inner layer. The resistance of the oxide scales increased with increasing Al addition, implying an enhanced protective ability of the oxide scales by Al alloying in media containing chlorine ions. The findings represent a step forward in improving the surface integrity of alloy components used in the hot zones of jet engines.
1. Introduction
Molybdenum disilicide (MoSi2) has good potential for high-temperature applications, because of a number of intriguing properties, including its high melting point, moderate density and superior mechanical properties.1 With respect to oxidation behavior, MoSi2 exhibits high resistance against oxidation attack at temperatures above 800 °C via the formation of a thin, adhesive, dense silica surface scale. Consequently, MoSi2 has been chosen for the manufacture of furnace heating elements,2 and also as surface coatings for the protection of Mo-based alloys3,4 and carbon/carbon (C/C) composites5 used in oxidizing atmospheres at high temperatures. However, operating at low to intermediate temperatures ranging between 400 and 600 °C, especially at temperatures around 500 °C, MoSi2 often suffers from accelerated oxidation after exposure in hot air, leading to catastrophic disintegration into powders, which is well-known as ‘pesting’.6–9 Accelerated oxidation and pesting disintegration is a major obstacle to the high-temperature application of MoSi2-based alloys. To date, although extensive research has been conducted in an attempt to address this issue, the origins and mechanisms of pesting phenomena remain unclear. For instance, Knittel et al.9 proposed that the accelerated oxidation/pest behavior was not an intrinsic feature of MoSi2, since pesting phenomenon was not observed for fully dense (>95%) sintered MoSi2 samples. In contrast, many researchers found that hot pressed or single-crystal MoSi2 underwent severe pest oxidation at 500 °C, though it occurred after much longer holding time than polycrystalline samples did.10,11 Generally speaking, the low-temperature pest oxidation behavior of MoSi2 is affected by several material and environmental factors, such as structural defects including pores, voids, oxidation temperature,8 channels and cracks,11,12 and atmosphere.13 Because of the low Si self-diffusion coefficient in MoSi2 in the low-temperature range (400–600 °C), an impervious and continuous silica (SiO2) scale is unable to form during the oxidation of MoSi2, and consequently this leads to the simultaneous oxidation of Mo and Si.14 When structural defects, such as pores and cracks were present in MoSi2 alloys, these defects, acting as short-circuit diffusion paths for the transport of oxygen, are preferred sites for severe oxidation reaction, accompanied by substantial volume expansion.15 Such a significant volume expansion can generate large local wedging stresses at these existing defects that widen the cracks or enlarge the pores, ultimately resulting in catastrophic disintegration of MoSi2.12 To overcome this problem, either the incorporation of ceramic phases to form MoSi2-based composites4,16,17 or alloying treatment18–20 has been proposed to improve the low-temperature oxidation resistance of MoSi2. Amongst different alloying elements used, Al was thought to be the most favorable candidate,21 due to the fact that Al has stronger affinity to oxygen than Si. The formation of Al2O3 only caused a minor volume expansion of 4.9% as compared to 85.6% for SiO2.22 Therefore, Al alloying can markedly lower residual stresses in the oxide layer, avoiding pest disintegration due to cracking.
On the other hand, the potential application of MoSi2 also includes for aircraft gas turbines engine hot-section components such as vanes. MoSi2, with oxide scales developed on its surface after operation at high temperatures, may suffer from corrosive attack in aggressive environments (e.g., chlorine ions containing media introduced by saline marine air).23 Hence, it is critical to evaluate the ability of the oxide scale formed on MoSi2 against attack from chlorine ions for such specific applications. Notably, electrochemical-impedance spectroscopy (EIS), a simple, effective and non-destructive technique, has been used to characterize the electrical properties of passive films formed on metal substrates in an aqueous solution and high temperature oxide layers grown on zircaloy and stainless steels.24–26 Apparently, EIS measurement are highly responsive to structural defects and could thus be used to detect pores, channels, and cracks inside the oxide scales.
The main purpose of this work was to investigate the effect of Al alloying on the oxidation resistance of the Mo(Si1−xAlx)2 nanocrystalline films at 500 °C. The oxidation kinetics of the four Mo(Si1−xAlx)2 films was characterised, and the surface morphologies and nature of the oxide scales were also examined. Moreover, electrochemical-impedance spectroscopy (EIS) was used to determine the protective ability of the oxide scales grown on the films at different oxidation times in solutions that mimic chlorine ions containing media.
2. Experimental details
2.1. Preparation of nanocrystalline Mo(Si1−xAlx)2 films
Substrate specimens (Ø 40 mm × 4 mm) were cut from a Ti–6Al–4V alloy rod. The nominal composition of this alloy in wt% is: Al, 6.04; V, 4.03; Fe, 0.3; O, 0.1; C, 0.1; N, 0.05; H, 0.015 and the balance, Ti. Before coating deposition, the substrates were polished successively using SiC papers and 1 μm diamond paste. The polished substrates were then ultrasonically cleaned in acetone, alcohol, distilled water and then dried. Four nanocrystalline Mo(Si1−xAlx)2 (x = 0, 0.03, 0.06 and 0.10) films were deposited on mirror-polished Ti–6Al–4V substrates by a double cathode glow discharge technique using four different targets with stoichiometric ratios (Mo25Si75, Mo25Si71Al4, Mo25Si67Al8 and Mo25Si63Al12), respectively. The sputtering targets were fabricated from ball-milled Mo (99.99% purity), Al (99.99% purity) and Si powders (99.99% purity) by employing cold compaction under a pressure of 600 MPa. The reason for such a difference in the composition of the targets and the deposited films is that the composition of the resulting films is related to not only the alloy content of target materials, but also the relative sputtering yields of the alloying elements in the targets. Furthermore, the diffusion of alloying elements at the interface between the films and substrate also affects the composition of the deposited films. Prior to deposition, the cleaned the Ti–6Al–4V substrates were sputter etched in a pure argon atmosphere at Ar pressure of 25 Pa, with substrate voltage of −600 V for 10 min. During the deposition process, one cathode was the target composed of the desired sputtering materials, and the other was the substrate. When voltages were applied to the two cathodes, glow discharge occurred, as described in our previous papers.27 Glow discharge sputtering conditions were optimized as follows: base pressure, 4 × 10⁻⁴ Pa; target electrode bias voltage, −900 V; substrate bias voltage, −300 V; substrate temperature, 800 °C; Ar as working gas (99.9% purity) with pressure of 35 Pa and flow of 40 sccm; parallel distance between the source electrode and the substrate, 15 mm and treatment time of 5 h.
2.2. Phase and microstructure characterization
The crystallographic structure of the as-deposited films was determined using Bragg–Brentano X-ray diffraction (XRD) with Cu Kα radiation (D8ADVANCE, with X-ray tube voltage and current set at 35 kV and 40 mA, respectively). X-ray data were collected using a 0.1° step scan with a count time of 1 s. The as-deposited films were etched in Kroll's reagent (10 mL HNO3, 4 mL HF and 86 mL distilled water) for 20–30 s. A field emission scanning electron microscope (FE-SEM, Sirion 400NC, FEI Company) equipped with an energy-dispersive X-ray spectrometer (EDX) was used to observe the cross-sectional microstructure and measure the chemical composition of the as-deposited films. Transmission electron microscopy (TEM) and high-resolution transmission electron microscopy (HRTEM) images were performed using a JEOL JEM-2010 at an accelerating voltage of 200 kV. Plan-view TEM samples were cut from the outermost part of the films and prepared using single-jet electrochemical polishing technique starting from the untreated side of the substrates.
2.3. Cyclic oxidation tests
Cyclic oxidation tests were conducted at 500 °C in air (1 atm) for a maximum of 10 cycles. Samples were placed in a high-purity alumina crucible and inserted into the center of a muffle furnace. The furnace hot zone was maintained at the designated temperature during the entire duration of test. Each thermal cycle consisted of 10 h inside the furnace, followed by a cool-down for 30 min outside the furnace. The weight gain per unit area of each sample was measured periodically at the intervals of 10 h using an electronic balance with a sensitivity of ±0.1 mg. After cyclic oxidation, the surface morphology, chemical composition and phase constitution of the oxide scales formed on the specimens were characterized using SEM, EDX and XRD. In addition, the surfaces of the Mo(Si1−xAlx)2 nanocrystalline films oxidized for 30 h at 500 °C were analyzed by X-ray photoelectron spectroscopy (XPS) using a Kratos AXIS Ultra ESCA System with an Al Kα X-ray source with an energy of 1486.71 eV. The accelerating voltage and emission current of the X-ray source were kept at 12 kV and 12 mA, respectively. The base pressure of the sample analysis chamber was maintained at ∼10−10 Torr. The pass energy was selected at 80 eV for survey scans and 10 eV for the features of interest scans (i.e., O 1s, Mo 3d, Al 2p and Si 2p) to ensure high resolution and good sensitivity. After subtracting the background signal, the spectra were fitted by both Gaussian and mixed Gaussian/Lorentzian functions. Peak identification was performed by reference to the NIST XPS database (V4.0).
2.4. Electrochemical measurements
Electrochemical measurements were carried out using a CHI660C electrochemical analyzer. Samples oxidized for different times at 500 °C were used as working electrodes and each specimen was connected to a conducting wire and then embedded with non-conducting epoxy resin leaving a square surface of approximately 1 cm2 exposed to the solution. The electrolyte used was a 3.5 wt% NaCl solution open to the air, which was prepared from analytical grade reagents and distilled water. A standard three-compartment cell was used with a saturated calomel electrode (SCE) and a platinum electrode as a reference and counter electrode, respectively. Throughout this paper, all electrode potentials were referred to the SCE. At each test condition, the open circuit potential (OCP) was continuously monitored for 3600 s to obtain a stable electrochemical condition, then EIS measurements were conducted over the frequency range of 100 kHz to 10 mHz, with an acquisition of 12 points per decade of frequency, at respective OCPs, and an amplitude of the AC signal of 10 mV.
3. Results and discussion
3.1. Phase composition and microstructure
As shown in Fig. 1, all the diffraction peaks of the four Mo(Si1−xAlx)2 films were found to represent hexagonal C40-structured MoSi2(JCPDS card file no. 81-0167), with a pronounced (111) orientation. The positions of these diffraction peaks slightly shifted to smaller 2θ angles with increasing Al content, indicating that the coorporation of Al into the MoSi2 crystal increased the lattice parameter, supposedly due to the atomic radius of Al being larger than that of Si. According to the XRD results and EDX point analysis (Fig. 2(a) and (b)), the 20 μm thick as-deposited films consisted of monolithic C40-structured Mo(Si1−xAlx)2 with atomic ratios of Mo to Si (or Si + Al) close to 0.5. Moreover, a diffusion layer, composed mostly of Ti and Mo elements, was formed presumably by Mo atoms diffusing from the films into the substrate, which resulted in the phase transformations of β → α′′ → α′, as reported in our previous paper.28 As shown in Fig. 3(a) and (b), the Mo(Si0.94Al0.06)2 film was composed of equiaxed grains and the grain size measured is in the range of 5–10 nm. Fig. 3(c) shows a bright-field HRTEM lattice image of the Mo(Si0.94Al0.06)2 film. The fringe spacing of the crystallites, outlined by dotted blue circles, was determined to be 0.219 nm, corresponding to the (111) interplanar distances in the hexagonal C40-structured MoSi2 phase.
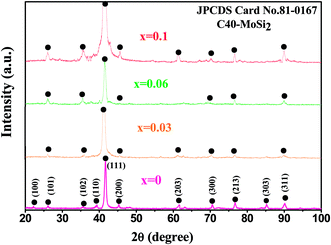 |
| | Fig. 1 XRD patterns recorded from the as-deposited Mo(Si1−xAlx)2 films. | |
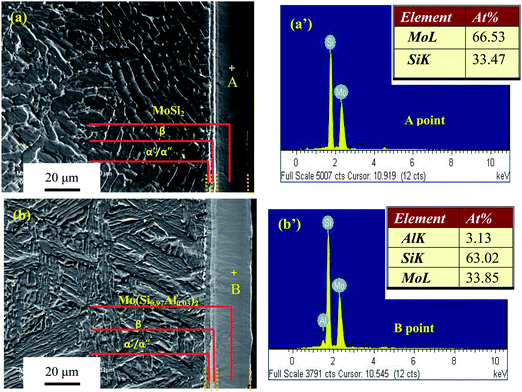 |
| | Fig. 2 Secondary electron (SE) images and the corresponding EDX point analysis of the etched cross-sections of the two Mo(Si1−xAlx)2 films: (a) x = 0; (b) x = 0.03. (+ denotes in each image the region where point analysis was performed). | |
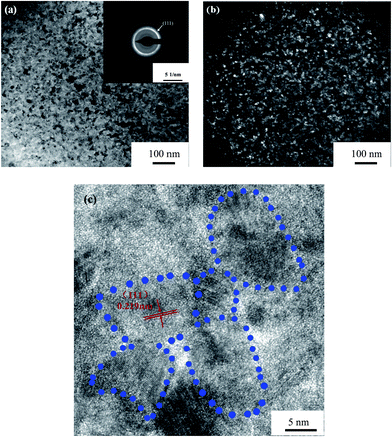 |
| | Fig. 3 (a) Bright-field and (b) dark-field TEM images and the corresponding electron diffraction pattern from the Mo(Si0.94Al0.06)2 film. (c) Bright-field HRTEM lattice image of the Mo(Si0.94Al0.06)2 film. | |
3.2. Cyclic oxidation behavior
3.2.1. Cyclic-oxidation kinetics. Fig. 4 shows the variation in weight gains per unit surface area with oxidation time for the four films exposed to air at 500 °C. As expected, the weight gains of the films increased continuously with oxidation time. It is apparent that the monolithic MoSi2 film exhibits a higher weight gain in comparison to that of the three Al-containing films and, moreover, the gaps in the weight gain values between the monolithic MoSi2 film and the three Al-containing films increased with increasing exposure time, revealing that the oxidation resistance of the MoSi2 nanocrystalline film was improved by Al additions.
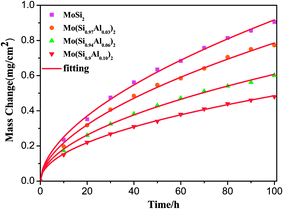 |
| | Fig. 4 Mass change as a function of the exposure time for the Mo(Si1−xAlx)2 films at 500 °C in air. | |
In order to understand the cyclic-oxidation kinetics, the data were further analyzed using the general rate equation:29
| |
 | (1) |
where Δ
W is the weight gain,
S is the surface area of the sample,
t is the oxidation time,
m is the oxidation exponent and
Km is the rate constant. The oxidation exponents and rate constants are determined and summarized in
Table 1. The oxidation rate of the samples tested in this study can be compared from the values of
m and
Km. The smaller values of
m and
Km imply less oxidation rates in a given time. As can be seen, the values of oxidation exponent
m are around 0.5, denoting that the oxidation behavior of the four Mo(Si
1−xAl
x)
2 films approximately obeyed a subparabolic behavior with respect to the exposure time. With increasing Al additions, the values of
m and
Km for the four Mo(Si
1−xAl
x)
2 nanocrystalline films decreased, implying that the oxidation rate of the films was reduced by Al additions.
Table 1 Summary of rate constants processed from the data for the Mo(Si1−xAlx)2 films oxidized at 500 °C
| Material |
m |
Km |
Kp (mg2 cm−4 s−1) |
| MoSi2 |
1.775 |
0.0085 |
0.0081 |
| Mo(Si0.97Al0.03)2 |
1.793 |
0.0065 |
0.0060 |
| Mo(Si0.94Al0.06)2 |
1.913 |
0.0039 |
0.0036 |
| Mo(Si0.9Al0.10)2 |
2.022 |
0.0023 |
0.0023 |
3.2.2. Characterisation of the oxidation products. As seen in Fig. 5, for the monolithic film, some weak diffraction peaks from MoO3 (JCPDS card file no. 05-0508), together with strong diffraction peaks arising from the underlying C40-MoSi2 film, were identified, whereas for the three Al-containing films, diffraction peaks of α-Al2O3 (JCPDS card file no. 10-0173) were detected, in addition to these two phases. No peaks of another possible major oxidation product, silica, appear in the XRD patterns of four oxidized samples, suggesting SiO2 might exist in the amorphous state.
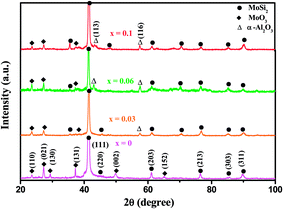 |
| | Fig. 5 X-ray diffraction patterns recorded from the surfaces of the Mo(Si1−xAlx)2 nanocrystalline films after cyclic oxidation tests at 500 °C for 30 h. | |
XPS analysis was carried out on the oxidized Mo(Si1−xAlx)2 films to further clarify the oxidation products. As shown in Fig. 6(a), the Mo 3d spectra consist of one doublet peaks Mo 3d5/2 and Mo 3d3/2, located at 232.84 and 236.01 eV respectively, denoting the formation of MoO3. The Si 2p spectra (Fig. 6(b)) show only a single peak at a binding energy of 103.15 eV, typical of silicon in the form of silicon dioxide (SiO2). Together with the absence of SiO2 diffraction peaks, these results confirmed the amorphous nature of SiO2 in the oxide scales on the films. It is worth noting that the Si 2p spectrum, derived from the MoSi2 film before cyclic oxidation, comprises one component with a binding energy of 99.1 eV, corresponding to MoSi2. The Al 2p spectra (Fig. 6(c)) recorded for the three Al-containing films exhibit one component with a binding energy of 75.0 eV, indicating that Al was primarily present as Al2O3. According to the XRD and XPS analysis, the following reactions probably occurred during oxidation of the Mo(Si1−xAlx)2 films:
| | |
2MoSi2 + 7O2 → 4SiO2 + 2MoO3
| (2) |
| |
 | (3) |
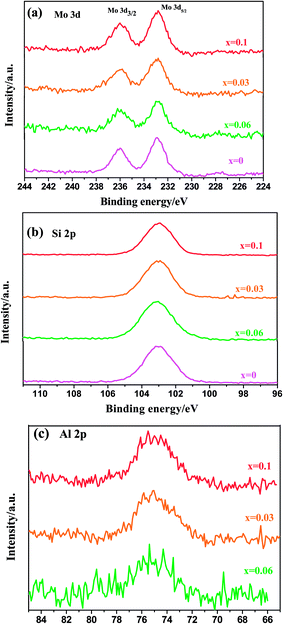 |
| | Fig. 6 The high-resolution XPS spectra for (a) Mo 3d, (b) Si 2p and (c) Al 2p peaks obtained from the surfaces of the Mo(Si1−xAlx)2 films after cyclic oxidation tests at 500 °C for 30 h. | |
3.2.3. Surface morphologies of oxide scales. Fig. 7–10 show SEM micrographs of surface morphologies for the four Mo(Si1−xAlx)2 films oxidized at 500 °C with increasing exposure times. Apparently, the Al additions play an important role on the evolution of oxide scale morphologies of the films at 500 °C, which is the most common catastrophic pest temperature. After 10 h of oxidation, needle-like or platelet-shaped oxides with different dimensions (Fig. 7(a)) grew from the external surface of relatively dense oxide scale and numerous rounded nodules ∼15 μm in diameter were also present on the monolithic MoSi2 film surface. EDX analyses reveal the needle-like or platelet-shaped phase with a O/Mo atomic ratio approaching 3 consistent with the oxide being MoO3 (Fig. 7(e)), whereas the rest of scales exhibited a Si/Mo atomic ratio close to that of MoSi2 (Fig. 7(f)), implying the simultaneous-oxidation of both Mo and Si. For the three Al-containing MoSi2 films, only few small platelet-shaped MoO3 particles were observed scattering over the oxide scale of the Mo(Si0.97Al0.03)2 film, and with further increases in Al content in the films, the oxide scales became very dense and smooth without any evidence of needle-like or platelet-shaped MoO3. EDX measurements show that the Si/Mo atomic ratios and Al content of the oxide scales increased with Al content in the three Al-containing MoSi2 films, suggesting that Al additions facilitated the enrichment of both SiO2 and Al2O3 (Fig. 7(g)–(i)). As shown in Fig. 8(a), by extending the exposure time, a high density of defects, i.e., large cracks on the nodules and pinholes over a relatively flat region were observed on the surface of the oxide scale formed on the monolithic MoSi2 film. Similarly, some small cracks were visible on the nodules distributed over the oxide scale of the Mo(Si0.97Al0.03)2 and Mo(Si0.94Al0.06)2 films (Fig. 8(b) and (c)). Interestingly, there was little change in the oxide scales on the Mo(Si0.9Al0.10)2 film (Fig. 8(d)) and no cracks were found on the smaller nodules. Because the volume change of forming SiO2 and MoO3 from Si and Mo were 180% and 340%, respectively, conversion from MoSi2 to MoO3 and SiO2 by reaction (3) was accompanied by a volume expansion of about 250 vol%.30 This substantial volume expansion and the volatilization of MoO3 would generate a large internal stress in the oxide scale.4 Moreover, the oxide scales may also have been subjected to thermo-mechanical stresses upon cooling, due to a discrepancy in coefficients of thermal expansion between the substrate/film/scale. Such overlapping stresses led to crack formation and growth in the oxide scale, especially at the weak interface between the matrix and the MoO3 platelets. Due to the continuous formation and volatilisation of MoO3 from the scale surface, an oxide scale with a porous structure resulted. These defects facilitated the rapid inward diffusion of oxygen through the oxide scale, and accelerated the oxidation process.14 As shown in Fig. 9(a), when the exposure time increased to 30 h, the surfaces of oxide scale on the monolithic MoSi2 film exhibited a rugged appearance with a volcano crater-shaped morphology. These features may result from a localised delamination of the oxide scale at previously formed defect sites, caused by a wedging effect from oxide growth in these defects. SEM examination of the scale surface revealed that pest disintegration of the monolithic MoSi2 film has not occurred, because the surface morphology of the oxide scale was still relatively dense, and only a few pinholes and small amount of platelet-shaped MoO3 can be observed. The results suggested that the oxide scale grown on the monolithic film exhibited a self-healing capability that can effectively seal the pinholes formed through MoO3 evaporation by the lateral growth of SiO2. After a prolonged oxidation time up to 100 h (Fig. 10(a)), the oxide scale grown on the monolithic MoSi2 film was veined with microcracks, indicating that the monolithic MoSi2 film has undergone severe oxidation. As shown in Fig. 9(b), after oxidation for 30 h, a few large nodules and shallow craters were observed on the oxide scale of the Mo(Si0.97Al0.03)2 film, and after 100 h of exposure (Fig. 10(b)), the Mo(Si0.97Al0.03)2 film was covered with a mass of spherical oxides with a number of microcracks. As shown in Fig. 9(c) and (d), when the exposure time is extended to 30 h, more small nodules and mircocraters were detectable on the oxide scales formed on the Mo(Si1−xAlx)2 (x = 0.06 and 0.10) films, and after oxidation for 100 h (Fig. 10(c) and (d)), the oxide scales still had a relatively compact structure, except for some microcracks between the spherical oxides. As indicated from EDX analysis, Al additions promoted the enrichment of α-Al2O3 and SiO2 in the oxide scales formed on the three Al-containing MoSi2 films. Compared with the Mo–Si oxide formed on MoSi2, the mixture of the oxides of Mo, Si and Al has greater plasticity and better protective properties by reducing the oxygen influx toward the oxide scale/film interface.15,17 The volume expansion associated with the formation of Al2O3 from Al was 104.9%, much less than that for MoO3 and SiO2.8 Al additions would lead to much lower internal stresses in the oxide scales and thus a decrease in the tendency for crack formation. The surface morphology observations demonstrated that Al additions had a beneficial effect on the low temperature oxidation behavior of the Mo(Si1−xAlx)2 films and dramatically retarded pest oxidation. Furthermore, some researchers suggested that the pest oxidation was likely to occur at some preferential sites, such as pre-existing cracks, grain boundaries and pores, through transport of oxygen along these defects into the interior of MoSi2 and subsequently the local wedging stresses caused by large volume expansion resulted in the catastrophic disintegration of MoSi2.7,11,31 For example, Westbrook and Wood32 proposed that the catastrophic nature of the pest oxidation was attributed to grain boundary embrittlement. Many other investigators, however, indicated that grain boundaries alone may not lead to pesting.8,12 For instance, Knittel et al.9 found that coarse grained MoSi2 specimens synthesized by arc melting disintegrated into powder after oxidation for 17 h at 500 °C. This is also true for the present study; that is, if the pest oxidation prefers to take place at grain boundaries, the four Mo(Si1−xAlx)2 nanocrystalline films should be more prone to pest disintegration than the coarser grained MoSi2. Therefore, there is no clear evidence that the grain boundary was the main reason for pesting based upon the experimental observation described in the literature and the present work.
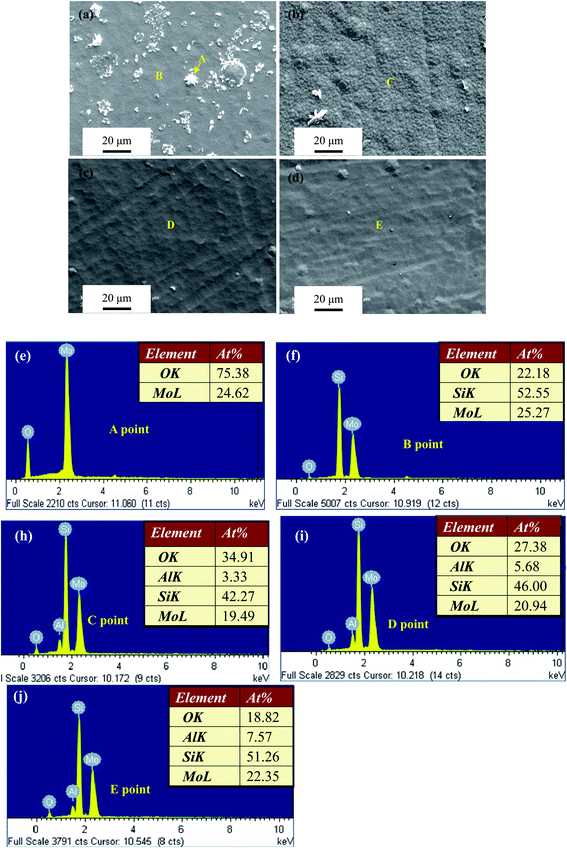 |
| | Fig. 7 SEM micrographs of surface morphologies and EDX analyses of oxide scales for the four Mo(Si1−xAlx)2 films oxidized at 500 °C for 10 h. (a) x = 0; (b) x = 0.03; (c) x = 0.06; (d) x = 0.1. | |
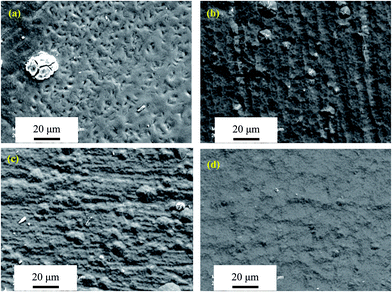 |
| | Fig. 8 SEM micrographs of surface morphologies of the four Mo(Si1−xAlx)2 films oxidized at 500 °C for 20 h. (a) x = 0; (b) x = 0.03; (c) x = 0.06; (d) x = 0.1. | |
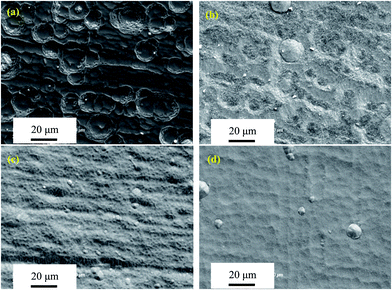 |
| | Fig. 9 SEM micrographs of surface morphologies of the four Mo(Si1−xAlx)2 films oxidized at 500 °C for 30 h. (a) x = 0; (b) x = 0.03; (c) x = 0.06; (d) x = 0.1. | |
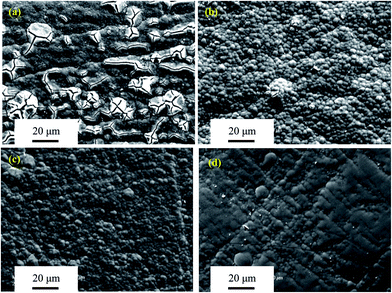 |
| | Fig. 10 SEM micrographs of surface morphologies of the four Mo(Si1−xAlx)2 films oxidized at 500 °C for 100 h. (a) x = 0; (b) x = 0.03; (c) x = 0.06; (d) x = 0.1. | |
3.3. Characterization of oxide scales by impedance spectroscopy
To gain a deeper insight into the influence of Al alloying on the protective ability of the oxide scales in chlorine ions containing media, the electrochemical behavior of the films oxidized for various times at 500 °C was investigated in a 3.5 wt% NaCl solution by EIS. As can be seen in Fig. 11, EOCP for all test samples moved quickly towards more negative potentials during initial immersion of 600 s. After that, the EOCP changed more slowly until it reached a relatively steady state value. The characteristic of the OCP evolution was very similar to that of the thermally oxide layers grown at 350 °C in air on AISI 304 stainless steel in a borate buffer solution.33,34 According to the literature, an initial decrease in the EOCP may be attributed to the dissolution of the oxide scales35,36 and the penetration of electrolyte into the loose and porous surface layer.37 As shown in Fig. 7, the oxide scales on the Mo(Si1−xAlx)2 films appeared compact and free of cracks or pores and thus, the initial decrease of the EOCP stemmed presumably from the dissolution of the oxide scales. This may be related to the conversion of MoO3 into a soluble product HMoO4− by the following hydrolysis reaction:| | |
MoO3 + H2O = HMoO4− + H+
| (4) |
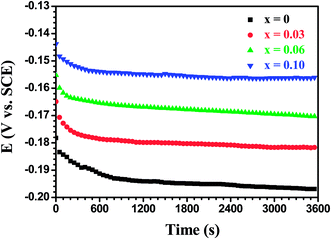 |
| | Fig. 11 Open circuit potential (OCP) vs. time curves for the Mo(Si1−xAlx)2 films oxidized at 500 °C for 10 h. | |
It was found that with increasing Al content in the films, the steady state values of the EOCP increased and the time required to attain steady state potentials also decreased, suggesting that the Al additions reduced the dissolution rate and improved the protection characteristics of oxide scales.
Fig. 12 shows the electrochemical impedance spectra of the Mo(Si1−xAlx)2 films oxidized at 500 °C for 10 h at respective OCP in a 3.5 wt% NaCl solution. As can be seen from the Nyquist plots (Fig. 12(a)), all the samples showed only one capacitive loop in the entire frequency range, and the capacitive loop diameter increased with increasing Al additions. From the corresponding Bode plots in Fig. 12(b), it is evident that the log![[thin space (1/6-em)]](https://www.rsc.org/images/entities/char_2009.gif) |Z| varied linearly with the log
|Z| varied linearly with the log![[thin space (1/6-em)]](https://www.rsc.org/images/entities/char_2009.gif) f, yielding a slope close to −1 at a wide range of frequencies in the Bode-magnitude plots and a broad plateau with a phase angle that was independent of the frequency maximum observed in the Bode-phase plots. These features represent a near-capacitive response, which is typical of passive systems. They also suggest that the protective oxide scales, acting as diffusion barrier between the films and the oxidising environment, have formed on the Mo(Si1−xAlx)2 films.38 An electronic equivalent circuit (EEC) presented in the inset in Fig. 12(a), known as a Randles circuit, was used to fit the experimental impedance data of the Mo(Si1−xAlx)2 films oxidized at 500 °C for 10 h. In this circuit, a constant phase element (CPE) is introduced to obtain a best fit, instead of an ideal capacitance element, due to the surface heterogeneity originating from surface roughness, porosity or inhomogeneous distribution of the electrode surface properties.39,40 The impedance of CPE is normally expressed as:
f, yielding a slope close to −1 at a wide range of frequencies in the Bode-magnitude plots and a broad plateau with a phase angle that was independent of the frequency maximum observed in the Bode-phase plots. These features represent a near-capacitive response, which is typical of passive systems. They also suggest that the protective oxide scales, acting as diffusion barrier between the films and the oxidising environment, have formed on the Mo(Si1−xAlx)2 films.38 An electronic equivalent circuit (EEC) presented in the inset in Fig. 12(a), known as a Randles circuit, was used to fit the experimental impedance data of the Mo(Si1−xAlx)2 films oxidized at 500 °C for 10 h. In this circuit, a constant phase element (CPE) is introduced to obtain a best fit, instead of an ideal capacitance element, due to the surface heterogeneity originating from surface roughness, porosity or inhomogeneous distribution of the electrode surface properties.39,40 The impedance of CPE is normally expressed as:
| |
 | (5) |
where
Q is the CPE coefficient,
j is the imaginary unit and
ω is the angular frequency. The factor
n, defined as a CPE exponent, is an adjustable parameter that always lies between 0.5 and 1. When
n = 1, the CPE represents an ideal capacitance; for 0.5 <
n < 1, the CPE describes a distribution of dielectric relaxation times in frequency space; and when
n = 0.5 the CPE represents a Warburg impedance with diffusional character. The physical significance of the circuit elements can be described as follows:
Rs is the solution resistance, and
Qo and
Ro are representations of the capacitive and the resistive behavior of the oxide scales. As evident in
Fig. 12, the fitted and measured results matched very well with each other, suggesting the validity of the proposed circuit model.
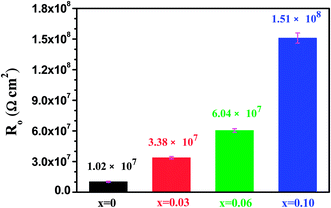
Fig. 13 shows the resistance of oxide scales obtained from the fitting procedure using the Randles circuit. The resistance values,
Ro for the tested samples are rather large and are of the order of 10
7∼10
8 Ω cm
2, implying that the oxide scales on the films exhibited excellent corrosion resistance. In addition, the values for
Ro increased noticeably with increasing Al additions.
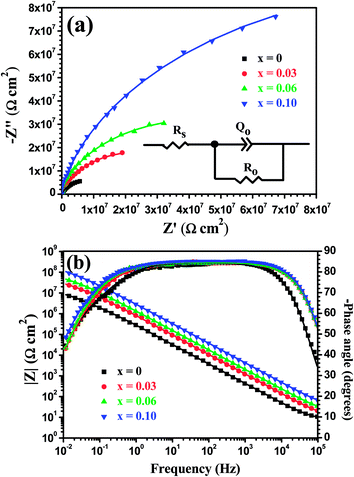 |
| | Fig. 12 (a) Nyquist and (b) Bode plots of the Mo(Si1−xAlx)2 films oxidized at 500 °C for 10 h at respective OCP in 3.5 wt% NaCl solution. Symbols are experimental data and solid lines are fitting results. The inset in (a) shows an electronic equivalent circuit used to fit the impedance data of the Mo(Si1−xAlx)2 films oxidized at 500 °C for 10 h. | |
 |
| | Fig. 13 The oxide scales resistance obtained from the fitting procedure using the Randles circuit. | |
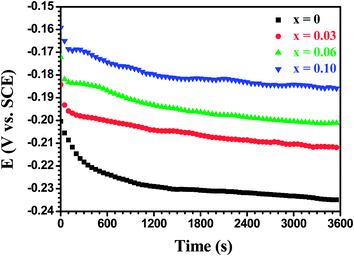
The time profiles of the open-circuit potential (OCP) obtained from the Mo(Si1−xAlx)2 films oxidized at 500 °C for 20 h in a 3.5 wt% NaCl solution are shown in Fig. 14. On the whole, the OCP vs. time curves shown in Fig. 14 are similar in shape to that in Fig. 11, except that the EOCP values in Fig. 14 shifted slowly towards more negative values at a relatively steady state stage. By comparing the EOCP values, it can be observed that an extension of oxidation time has made the EOCP values less noble for the same Mo(Si1−xAlx)2 film, denoting that the protection capability of the oxide scales on the films decreased after prolonged oxidation at 500 °C.
 |
| | Fig. 14 Open circuit potential (OCP) vs. time curves for the Mo(Si1−xAlx)2 films oxidized at 500 °C for 20 h. | |
Fig. 15 displays the Nyquist and Bode plots for the Mo(Si1−xAlx)2 films oxidized at 500 °C for 20 h at respective OCP in a 3.5 wt% NaCl solution. Compared with the EIS spectra shown in Fig. 12(a), the recorded EIS spectra for the films after 20 h of oxidation show a more depressed capacitive loop in the Nyquist plot, and narrower phase plateaus at intermediate frequencies and a smaller low-frequency limit for the impedance modulus |Z|, indicating a less capacitive response and a reduction in corrosion resistance in the electrolytes used for these oxide scales.41–43 As shown in Fig. 15(a), except for the Mo(Si0.90Al0.10)2 film, a new incomplete capacitive loop appears in the low frequency range in the Nyquist plots for the Mo(Si1−xAlx)2 (x = 0, 0.03 and 0.06) films, reflecting two time constants in the normal frequency range, which is also substantiated by the slight asymmetry at low frequencies in the Bode-phase plots (Fig. 15(b)). The results also indicated that the oxide scales on the Mo(Si1−xAlx)2 (x = 0, 0.03 and 0.06) nanocrystalline films may exhibit a two-layer architecture. As such, for quantitative analysis, the experimental impedance data of the Mo(Si1−xAlx)2 (x = 0, 0.03 and 0.06) films should be fitted using an equivalent circuit with two time constants.
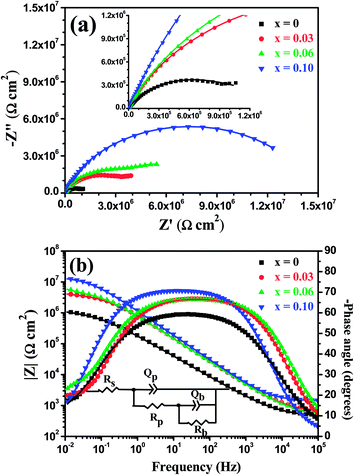 |
| | Fig. 15 (a) Nyquist and (b) Bode plots of the Mo(Si1−xAlx)2 films oxidized at 500 °C for 20 h at respective OCP in 3.5 wt% NaCl solution. The inset in (b) shows an electronic equivalent circuit used to fit the impedance data of the Mo(Si1−xAlx)2 (x = 0, 0.03 and 0.06) films oxidized at 500 °C for 20 h. | |
It is worth noting that R(Q1R1)(Q2R2) and R(Q1(R1(Q2R2))) have been used in several papers to fit the experimental impedance spectra with two time constants.44–47 Nevertheless, as regards to the use of the above two circuit models for EIS data interpretation of different oxide films, there has been wide debate in the literature as to its applicability. For example, Xie et al.46 have applied the two circuit models to analyze the EIS data of the porous Ti–Mo alloys with different porosity levels in a 0.9 wt% NaCl solution at 37 °C. Both models assume the formation of oxide layer that is composed of a dense inner barrier layer and a porous outer layer. The results showed that the R(Q1R1)(Q2R2) value was suitable for EIS spectra fitting of alloys with high porosity, while the impedance behaviors of alloys with lower porosity levels can be better described by R(Q1(R1(Q2R2))). In contrast, Guo and co-workers47 studied the compactness of different Al2O3 plasma electrolytic oxidation (PEO) films by EIS. They found that the R(Q1R1)(Q2R2) value was more appropriate for simulating EIS data of PEO films with a high level of compactness, whereas R(Q1(R1(Q2R2))) was better for modeling the impedance data of PEO films with poor compactness. Pan et al.44 applied EIS to characterize high-temperature oxide films formed on different stainless steels oxidized for various times at 800 °C. They proposed that Rs(Qp(Rp(QbRb))) was applicable to the oxide film consisting of a compact inner layer and a porous outer layer, while Rs(QpRp)(QbRb) was feasible for an oxide film with a sandwich structure, in which both the oxide layers were considered as separate quasi-homogeneous oxide phases. In this work, both equivalent circuit models were used to simulate the measured spectra for the Mo(Si1−xAlx)2 films oxidized at 500 °C for 20 h. However, the fitting quality obtained from the Rs(QpRp)(QbRb) model was far from mathematically satisfactory due to large errors in the impedance parameters, in some cases reaching 48%. On the contrary, a satisfactory fit for the experimental impedance data can be obtained using the Rs(Qp(Rp(QbRb))) model (inset in Fig. 15(b)). In this circuit, Rs is the solution resistance, Rp is the resistance of the porous outer layer, Rb is the resistance of the compact inner barrier layer, while Qp and Qb correspond to the capacitances of the porous and barrier layer, respectively. For the Mo(Si0.90Al0.10)2 film, the impedance data were fitted using a simple Rs(QRo) circuit shown as the inset in Fig. 12(a). Fig. 16 displays the values of the resistance of the porous outer layer (Rp), the resistance of the compact inner barrier layer (Rb) and overall resistance of oxide scales Ro (Ro = Rp + Rb) derived from the fitting of the experimental impedance data. For the four Mo(Si1−xAlx)2 films, the values of n are far from unity (between 0.67 and 0.80), which represents an imperfect capacitive behavior of the oxide layer and is generally thought to arise from the heterogeneity of the oxide layer as a result of the presence of pores, channels, and cracks.48–50 The overall resistance of the oxide scales, Ro, still increased with Al content in the films, but decreased notably with increasing oxidation time as compared with the values shown in Fig. 13. For the Mo(Si1−xAlx)2 (x = 0, 0.03 and 0.60) films with a double-layer structured oxide scale, the resistances of the inner barrier layer (Rb) are significantly larger than that of outer porous layer (Rp), revealing that the inner barrier layer is predominantly responsible for their anticorrosive protection. In the case of the Mo(Si0.90Al0.10)2 film, one time constant was apparent in the spectrum, suggesting that the oxide scale exhibited an impedance response similar to that of a single-layer oxide scale. The variations of the resistive and capacitive properties of the oxide scales after 20 h of oxidation are correlated to their defectiveness, which is supported by surface morphology observations of the oxide scales shown in Fig. 8.
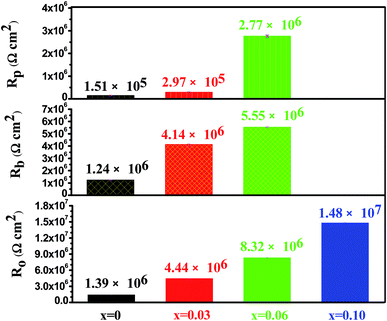 |
| | Fig. 16 The values of the resistance of the porous outer layer (Rp), the resistance of the compact inner barrier layer (Rb) and overall resistance of oxide scales Ro (Ro = Rp + Rb) derived from the fitting of the experimental impedance data for the Mo(Si1−xAlx)2 films oxidized at 500 °C for 20 h. | |
Fig. 17 shows open circuit potential (EOCP) vs. immersion time curves for the Mo(Si1−xAlx)2 films oxidized at 500 °C for 30 h in a 3.5 wt% NaCl solution. It is clear that the potential gap between the three Al-containing MoSi2 films and the monolithic MoSi2 film at quasi-steady-state stage has widened further, indicating that a drop in the protective ability was more pronounced for the monolithic MoSi2 film with prolonged oxidation. Fig. 18 shows the Nyquist and Bode plots for the Mo(Si1−xAlx)2 (x = 0, 0.03, 0.06 and 0.10) films oxidized at 500 °C for 30 h at respective OCP in a 3.5 wt% NaCl solution. As shown in Fig. 18(a), all Nyquist plots of the films possess a similar behavior that is characterized by typical two capacitance loops, at both low frequency and high frequency, respectively. Accordingly, two clear phase angle peaks located in the high and low frequency ranges are also observable in the Bode phase plots (Fig. 18(b)). The Bode magnitude plots exhibit two linear regions at high and low frequencies, evidence of the presence of two capacities in the equivalent circuit. The lower slope of the Bode magnitude plots in the low frequency region is accompanied by a decrease in the phase angle. Such impedance spectra are fitted using the equivalent circuit shown in the inset in Fig. 15(b) and the values of Rp, Rb and Ro derived from the fitting of the experimental impedance data are present in Fig. 19(a). The values of Rp and Rb for the oxide scales formed after 30 h of oxidation are about two orders of magnitude lower than that for the oxide scales formed after 20 h of oxidation. This suggests that an increase in oxidation time led not only to a noticeable increase in defect level of the outer layer, but also defects extending into the inner barrier layer. Therefore, the oxide scales became more defective after 30 h of oxidation.
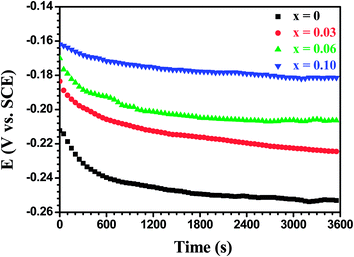 |
| | Fig. 17 Open circuit potential (OCP) vs. time curves for the Mo(Si1−xAlx)2 films oxidized at 500 °C for 30 h in 3.5 wt% NaCl solution. | |
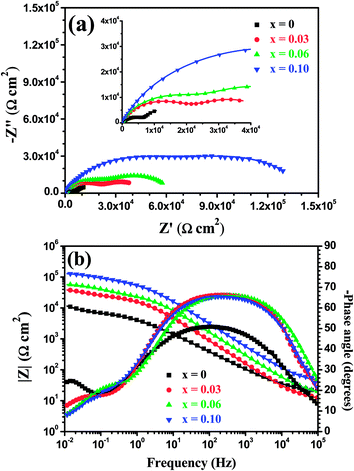 |
| | Fig. 18 (a) Nyquist and (b) Bode plots of the Mo(Si1−xAlx)2 films oxidized at 500 °C for 30 h at respective OCP in 3.5 wt% NaCl solution. | |
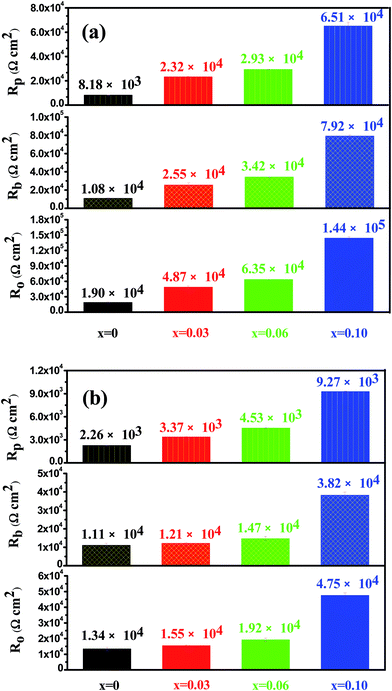 |
| | Fig. 19 The values of the resistance of the porous outer layer (Rp), the resistance of the compact inner barrier layer (Rb) and overall resistance of oxide scales Ro (Ro = Rp + Rb) derived from the fitting of the experimental impedance data for the Mo(Si1−xAlx)2 films oxidized at 500 °C for 30 h (a) and 100 h (b). | |
Fig. 20 shows the open circuit potential (EOCP) versus immersion time curves for the Mo(Si1−xAlx)2 films oxidized at 500 °C for 100 h in a 3.5 wt% NaCl solution. It is evident that EOCP for all the test samples continually moves to more negative potentials. This change is an indication that the oxide scales exhibited a higher content of defects after exposure for 100 h and, consequently, the dissolution rate of the oxide scales increases significantly due to an increase in conducting paths.44 The experimental and simulated impedance spectra of the Mo(Si1−xAlx)2 films oxidized at 500 °C for 100 h in a 3.5 wt% NaCl solution are presented in the form of Nyquist and Bode diagrams, as shown in Fig. 21. It is evident from Fig. 21 that the main feature of the impedance response is strikingly similar to that shown in Fig. 18, in other words, the impedance spectra exhibit two time constants, characterized by a small amplitude capacitive loop in the high frequency range and a large capacitive loop in the low frequency range. The good agreement between the experimental and fitted EIS data allows the different parameters to be fitted from the equivalent circuit shown in the inset in Fig. 15(b). As shown in Fig. 19(b), a considerable reduction in the overall resistance of oxide scales was observed after a longer oxidation time. As oxidation time increased, larger defects such as pores, channels or cracks were interconnected inside the oxide scales, which acted as short-circuit paths for penetration of the electrolyte down into the oxide scales, inducing a significant degradation of both the outer porous and the inner barrier layers. Evidently, the overall resistance of oxide scales still increased with an increase in Al content in the films, indicating Al alloying was conductive to the improvement of corrosion resistance of oxide scales formed on the MoSi2 film in chlorine ions containing media.
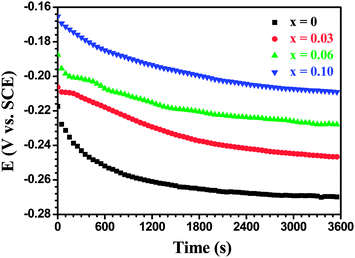 |
| | Fig. 20 Open circuit potential (OCP) vs. time curves for the Mo(Si1−xAlx)2 films oxidized at 500 °C for 100 h in 3.5 wt% NaCl solution. | |
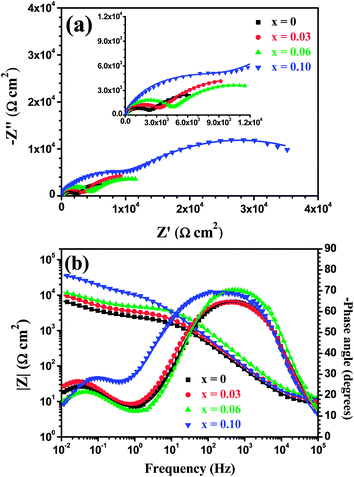 |
| | Fig. 21 (a) Nyquist and (b) Bode plots of the Mo(Si1−xAlx)2 films oxidized at 500 °C for 100 h at respective OCP in 3.5 wt% NaCl solution. | |
4. Conclusions
In the present work, the cyclic oxidation behavior of the four Mo(Si1−xAlx)2 films in air at 500 °C was investigated using SEM, XRD and XPS. No pest oxidation was observed for the four Mo(Si1−xAlx)2 films with increasing oxidation cycles. The oxidation behavior of the four Mo(Si1−xAlx)2 films approximately obeyed a subparabolic behavior with increasing exposure time and the cyclic oxidation rate of the four films decreased with an increase in Al content. SEM surface morphology observations demonstrated that the Al additions reduced the internal stresses in the oxide scales and endowed the oxide scales with a more compact structure, thus reducing the oxygen influx toward the oxide scale/film interface. Following prior oxidation for various times at 500 °C, the electrochemical behavior of the oxide scales immersed in a 3.5 wt% NaCl solution, was evaluated by EIS measurements. With prolongation of oxidation time, the oxide scales grown on the four films became defective and were composed of two layers, namely, an outer porous layer and the inner barrier layer. The protective character of the oxide scales increased with increases in Al content in the films.
Acknowledgements
The authors acknowledge the financial support of the National Natural Science Foundation of China under Grant no. 51175245 and no. 51374130 and the Aeronautics Science Foundation of China under Grant no. 2013ZE52058.
References
- M. Zakeri, R. Yazdani-Rad, M. H. Enayati and M. R. Rahimipour, J. Alloys Compd, 2005, 403, 258 CrossRef CAS PubMed.
- X. Y. Wang, I. T. H. Chang and M. Aindow, Intermetallics, 2002, 10, 829 CrossRef CAS.
- K. Ito, T. Hayashi, M. Yokobayashi and H. Numakura, Intermetallics, 2004, 12, 407 CrossRef CAS PubMed.
- J. K. Yoon, G. H. Kim, J. H. Han, I. J. Shon, J. M. Doh and K. T. Hong, Surf. Coat. Technol., 2005, 200, 2537 CrossRef CAS PubMed.
- T. Feng, H. J. Li, Q. G. Fu, X. Yang and H. Wu, Corros. Sci., 2011, 53, 4102 CrossRef CAS PubMed.
- D. A. Berztiss, R. R. Cerchiara, E. A. Gulbransen, F. S. Pettit and G. H. Meier, Mater. Sci. Eng., A, 1992, 155, 165 CrossRef.
- T. C. Chou and T. G. Nieh, J. Mater. Res., 1993, 8, 1605 CrossRef CAS.
- T. Maruyama and K. Yanagihara, Mater. Sci. Eng., A, 1997, 239–240, 828 CrossRef.
- S. Knittel, S. Mathieu and M. Vilasi, Intermetallics, 2010, 18, 2267 CrossRef CAS PubMed.
- T. C. Chou and T. G. Nieh, Scr. Metall. Mater., 1992, 27, 1637 CrossRef.
- T. C. Chou and T. G. Nieh, J. Mater. Res., 1993, 8, 214 CrossRef CAS.
- C. G. McKamey, P. F. Tortorelli, J. H. De Van and C. A. Carmichael, J. Mater. Res., 1992, 7, 2747 CrossRef CAS.
- K. Kurakowa, H. Houzumi, I. Saeki and H. Takahashi, Mater. Sci. Eng., A, 1999, 261, 292 CrossRef.
- Y. Q. Liu, G. Shao and P. Tsakiropoulos, Intermetallics, 2001, 9, 125 CrossRef CAS.
- K. Yanagihara, K. Przybylski and T. Maruyama, Oxid. Met., 1997, 47, 277 CrossRef CAS.
- R. W. Kowalik and M. G. Hebsur, Mater. Sci. Eng., A, 1999, 261, 300 CrossRef.
- X. A. Fei, Y. R. Niu, H. Ji, L. P. Huang and X. B. Zheng, Ceram. Int., 2010, 36, 2235 CrossRef CAS PubMed.
- R. Mitra, Mater. Sci. Eng., A, 2004, 382, 150 CrossRef PubMed.
- E. Ström, Y. Cao and M. Y. Yao, Trans. Nonferrous Met. Soc. China, 2007, 17, 282 Search PubMed.
- S. Majumdar and I. G. Sharma, Intermetallics, 2011, 19, 541 CrossRef CAS PubMed.
- T. Tabaru, K. Shobu, H. Hirai and S. Hanada, Intermetallics, 2003, 11, 721 CrossRef CAS.
- R. Mitra and V. V. Rama Rao, Mater. Sci. Eng., A, 1999, 260, 146 CrossRef.
- L. Klein and S. Virtanen, Corros. Sci., 2013, 66, 233 CrossRef CAS PubMed.
- P. Barberis and A. Frichet, J. Nucl. Mater., 1999, 273, 182 CrossRef CAS.
- S. H. Song and P. J. Xiao, Mater. Sci., 2003, 38, 499 CrossRef CAS.
- P. Y. Guo, C. L. Zeng, Y. Shao and Z. S. Qin, J. Rare Earths, 2012, 30, 1150 CrossRef CAS.
- J. Xu, L. L. Liu, P. Munroe, Z. H. Xie and Z. T. Jiang, J. Mater. Chem. A, 2013, 1, 10281 CAS.
- J. Xu, Y. Wang and S. Y. Jiang, Nanoscale, 2010, 2, 394 RSC.
- R. Mitra and V. V. Rama Rao, Metall. Mater. Trans. A, 1998, 29, 1665 CrossRef.
- K. Yanagihara, T. Maruyama and K. Nagata, Intermetallics, 1996, 4, 133 CrossRef.
- P. J. Meschter, Metall. Trans. A, 1992, 23, 1763 CrossRef.
- J. H. Westbrook and D. L. Wood, J. Nucl. Mater., 1964, 12, 208 CrossRef CAS.
- N. E. Hakiki, M. F. Montemor, M. G. S. Ferreira and M. C. Belo, Corros. Sci., 2000, 42, 687 CrossRef CAS.
- N. E. Hakiki, Corros. Sci., 2011, 53, 2688 CrossRef CAS PubMed.
- F. E. Heakal, S. A. Mogoda, A. A. Mazhar and M. S. El-Basiouny, Corros. Sci., 1987, 27, 453 CrossRef.
- E. A. Ferreira, R. C. Rocha-Filho, S. R. Biaggio and N. Bocchi, Corros. Sci., 2010, 52, 4058 CrossRef CAS PubMed.
- Y. L. Wang, Z. H. Jiang, Z. P. Yao and H. Tang, Surf. Coat. Technol., 2010, 204, 1685 CrossRef CAS PubMed.
- M. A. Amin, K. F. Khaled and S. A. F. Allah, Corros. Sci., 2010, 52, 140 CrossRef CAS PubMed.
- C. H. Kim, S. I. Pyun and J. H. Kim, Electrochim. Acta, 2003, 48, 3455 CrossRef CAS.
- J. B. Jorcin, M. E. Orazem, N. Pébère and B. Tribollet, Electrochim. Acta, 2006, 51, 1473 CrossRef CAS PubMed.
- A. Amirudin and D. Thierry, Prog. Org. Coat., 1995, 26, 1 CrossRef CAS.
- A. I. Muñoz, J. G. Antón, J. L. Guiñón and V. P. Herranz, Corros. Sci., 2007, 49, 3200 CrossRef PubMed.
- Z. Grubač, I. S. Rončević, M. Metikoš-Huković, R. Babić, M. Petravić and R. Peter, J. Electrochem. Soc., 2012, 159, 253 CrossRef PubMed.
- J. Pan, C. Leygraf, R. F. A. Jargelius-Pettersson and J. Lindén, Oxid. Met., 1998, 50, 431 CrossRef CAS.
- A. Kocijan, D. K. Merl and M. Jenko, Corros. Sci., 2011, 53, 776 CrossRef CAS PubMed.
- F. X. Xie, X. B. He, S. L. Cao, M. Mei and X. H. Qu, Electrochim. Acta, 2013, 105, 121 CrossRef CAS PubMed.
- X. H. Guo, K. Q. Du, Q. Z. Guo, Y. Wang and F. H. Wang, ECS Electrochem. Lett., 2013, 2, 11 CrossRef PubMed.
- M. F. Montemor, A. M. P. Simões, M. G. S. Ferreira and M. D. C. Belo, Corros. Sci., 1999, 41, 17 CrossRef CAS.
- H. Y. Ma, S. H. Chen, B. S. Yin, S. Y. Zhao and X. Q. Liu, Corros. Sci., 2003, 45, 867 CrossRef CAS.
- R. W. W. Hsu, C. C. Yang, C. A. Huang and Y. S. Chen, Mater. Sci. Eng., A, 2004, 380, 100 CrossRef PubMed.
|
| This journal is © The Royal Society of Chemistry 2014 |
Click here to see how this site uses Cookies. View our privacy policy here. 


![[thin space (1/6-em)]](https://www.rsc.org/images/entities/char_2009.gif) |Z| varied linearly with the log
|Z| varied linearly with the log![[thin space (1/6-em)]](https://www.rsc.org/images/entities/char_2009.gif) f, yielding a slope close to −1 at a wide range of frequencies in the Bode-magnitude plots and a broad plateau with a phase angle that was independent of the frequency maximum observed in the Bode-phase plots. These features represent a near-capacitive response, which is typical of passive systems. They also suggest that the protective oxide scales, acting as diffusion barrier between the films and the oxidising environment, have formed on the Mo(Si1−xAlx)2 films.38 An electronic equivalent circuit (EEC) presented in the inset in Fig. 12(a), known as a Randles circuit, was used to fit the experimental impedance data of the Mo(Si1−xAlx)2 films oxidized at 500 °C for 10 h. In this circuit, a constant phase element (CPE) is introduced to obtain a best fit, instead of an ideal capacitance element, due to the surface heterogeneity originating from surface roughness, porosity or inhomogeneous distribution of the electrode surface properties.39,40 The impedance of CPE is normally expressed as:
f, yielding a slope close to −1 at a wide range of frequencies in the Bode-magnitude plots and a broad plateau with a phase angle that was independent of the frequency maximum observed in the Bode-phase plots. These features represent a near-capacitive response, which is typical of passive systems. They also suggest that the protective oxide scales, acting as diffusion barrier between the films and the oxidising environment, have formed on the Mo(Si1−xAlx)2 films.38 An electronic equivalent circuit (EEC) presented in the inset in Fig. 12(a), known as a Randles circuit, was used to fit the experimental impedance data of the Mo(Si1−xAlx)2 films oxidized at 500 °C for 10 h. In this circuit, a constant phase element (CPE) is introduced to obtain a best fit, instead of an ideal capacitance element, due to the surface heterogeneity originating from surface roughness, porosity or inhomogeneous distribution of the electrode surface properties.39,40 The impedance of CPE is normally expressed as:


