DOI:
10.1039/C4RA10497H
(Paper)
RSC Adv., 2014,
4, 50241-50248
Flower-like In2O3 hierarchical nanostructures: synthesis, characterization, and gas sensing properties
Received
15th September 2014
, Accepted 30th September 2014
First published on 1st October 2014
Abstract
Hierarchical In2O3 nanostructures with flower-like morphology were synthesized by annealing In(OH)3 precursors prepared via a one-step hydrothermal method using the mixed solution of N,N-dimethylformamide (DMF) and deionized water as solvent. The crystal structure and morphology of the obtained samples were characterized by X-ray diffraction (XRD), scanning electron microscopy (SEM), transmission electron microscopy (TEM), and N2 adsorption–desorption analyses. The results revealed that the synthesized flower-like In2O3 hierarchical nanostructures were constructed from In2O3 nanoplates which connected with each other to form flower-like architecture. On the basis of experimental results, a possible mechanism for the formation of flower-like In2O3 hierarchical nanostructures was considered. Moreover, gas sensing investigation showed that the sensor based on flower-like In2O3 hierarchical nanostructures exhibited a superior response, good selectivity and stability to ethanol gas. The enhancement in gas sensing properties was attributed to their unique structure, large surface areas, and more surface active sites.
Introduction
Ethanol sensing has been widely applied in various fields, such as in ethanol breath analyzers for detecting ethanol vapor in drivers' breath, in foodstuffs experiments to assess the development of bacteria and fungi in food, in monitoring the biomedical and chemical processes in chemical industries and so on.1–3 Thus, growing concern about air pollution with respect to public health has enhanced the demand for gas sensors for monitoring ethanol concentration in the environment. Metal oxide semiconductor gas sensors have attracted much attention for their diverse applications in ethanol detection. Until now, a number of ethanol-sensing sensors based on SnO2,4 ZnO,5 LaFeO3,6 and WO3 (ref. 7) have been successfully obtained. As an important n-type semiconductor, indium oxide (In2O3) with high chemical and thermal stability has attracted considerable research efforts in its applicability as gas sensors.8–11 Recently, In2O3-based sensors have been investigated for the detection of ethanol vapor at various concentration levels.12–15
As we known, the crystal phase, morphologies, as well as the porosity have a profound influence on the sensing performance of In2O3 nanomaterials. Therefore, the design and tailor of In2O3 nanomaterials with different morphologies and structures are very important in view of both basic fundamental research and the development of novel devices. To meet the demand for practical applications, various In2O3 nanostructures have been fabricated, including nanoparticles,16 nanowires and nanorods,17 nanoplates or nanosheets,18 and 3D hierarchitectures.19,20 Being a special kind of nanostructure, 3D hierarchical nanostructures have become strategic for various applications mainly due to their large specific surface area and desirable surface permeability. Actually, these favorable properties are also significant for gas sensing, which can allow fast diffusion for target gases to interact with the entire sensing layer. To date, much effort has been given to prepare the 3D hierarchical In2O3 structures by many synthetic strategies. For these approaches, the hydrothermal synthesis method has been proved to an effective technique, which has the obvious advantages of simple, mild, and high yields.21,22 In our previous work, 3D porous In2O3 nanospheres consisted of numerous tiny In2O3 nanoparticles were synthesized by hydrothermal synthesis method, which exhibited higher response to ethanol gas compared with that of commercial bulk In2O3 particles.23 Hence, it is strongly desirable for the fabrication of the porous In2O3 hierarchical nanostructures by exploring more simple and effective techniques. However, despite this recent progress, there are still some difficulties in the organization of 2D building blocks (e.g. nanosheets or nanoplates) into 3D superstructures, especially when they need to be porous and thus possess a high surface area.
It is also noted that additive-free synthesis of nanostructures and self-assembling them into well-defined structures remains a huge challenge. Herein we report a successful facile self-assembly, template and additive-free synthesis route toward achieving flower-like In2O3 hierarchical nanostructures consisted of In2O3 nanoplates via an oriented attachment growth mechanism. The synthesis entails preparation of the intermediate In(OH)3 precursors under hydrothermal conditions using InCl3 as a precursor, a mixed solvent system of water and N,N-dimethylformamide (water/DMF) as the reaction medium. The products were characterized by FESEM, TEM, and nitrogen sorption. According to the experimental results, a possible formation mechanism was proposed and its ethanol sensing properties were investigated.
Experimental
Synthesis of flower-like In2O3 hierarchical nanostructures
In the experiments, all the chemical regents were analytical grade and used without further purification. In a typical experiment, 0.5 mmol InCl3·4H2O was first dissolved in the mixed solution of 15 mL distilled water and 15 mL DMF at room temperature, followed by addition of 1 mmol Na3C6H5O7·2H2O under vigorous stirring. Subsequently, 2 mmol of urea was added into the above mixed solution under vigorous stirring. The reaction mixture was transferred into a Teflon-lined stainless-steel autoclave and kept at 170 °C for 14 h. After the hydrothermal procedure, the autoclave cooled naturally down to room temperature. The precipitates were collected by centrifugation, washed several times with deionized water and ethanol, respectively, and dried at 60 °C for 12 h. Finally, flower-like In2O3 hierarchical nanostructures were obtained by annealing the precipitates at 500 °C for 3 h in air atmosphere.
Characterization
The crystal structure and phase composition of samples were identified by the means of X-ray diffraction (XRD, Bruker D8 Advance) using CuKα1 radiation (λ = 0.15406 nm) at 30 kV and 40 mA at a scanning rate of 2° at 2θ min−1 ranging from 20° to 80°, and energy dispersive X-ray spectroscopy, the morphology and the microstructure of the products were characterized by field emission gun scanning electron microscope (FESEM, Hitachi S4800), transmission electron microscopy (TEM, Hitachi H-800) and high resolution electron microscopy (HRTEM, JEOL 2010). The specific surface area was estimated using the Brunauer–Emmett–Teller (BET) method based on the N2 adsorption–desorption tests. Pore-size distribution was calculated from the adsorption branch of the nitrogen isotherm, using the Barrett–Joyner–Halenda method applied to the desorption part of the adsorption–desorption isotherm.
Gas sensor fabrication and response tests
The fabrication progress of the gas sensor was as follows: the as-obtained final product was ground and mixed with deionized water in order to form paste in agate mortar, which was evenly smeared onto the outer surface of a ceramic tube by hair brush to form a thick film to cover a pair of Au electrode, which had been printed on the tube previously. Four Pt lead wires attaching to the Au electrodes were used for measurement and a Ni–Cr alloy coil through the tube as a heater to operating the temperature. After dried in the air and aged at aging set at 2 days, it has been an indirectly-heated gas sensor, and then the gas sensor was put into the test chamber in a measuring system of WS-30A (Winsen Electronics Co. Ltd., Zhengzhou, China) by a static process.24,25 Then, the sensors were put into a glass chamber at the beginning. When the resistances of all the sensors were stable, the calculated amount of the target gas or liquid was injected into glass chamber by a micro-injector and mixed with air. After the sensor resistances reached a new constant value, the test chamber was opened to recover the sensors in air. All the measurements were performed in a laboratory fume hood with a large draught capacity. The sensor resistance and response values were acquired by the analysis system automatically. The whole experiment process was performed in a super-clean room with the constant humidity and temperature. In the test process, a working voltage of 5 V (Vworking) was applied. By monitoring the voltage across the reference resistor (Voutput), the response of the sensor in air or in a test gas could be measured. The sensor response was defined as,where Rair is the resistance of the sensor in air and Rgas is the resistance of sensor in the presence of the test gas. Then, the slope coefficient of response value to the logarithm of the concentration was defined as sensitivity. The response and recovery time was defined as the time taken by the sensors to achieve 90% of the total resistance change in the case of adsorption and desorption, respectively.
Results and discussion
Crystal structure and morphology
The crystal structure of the prepared samples was characterized by X-ray diffractometer. As shown in Fig. 1, the diffraction peaks of the precursor (curve a) are in good agreement with cubic structure In(OH)3 (JCPDS no. 73-1810), no peaks for other impurities are detected. After annealing at 500 °C, all the peaks of the sample (curve b) are indexed to the hexagonal phase of In2O3 with the standard date file (JCPDS file no. 22-0336). No other phases were observed, confirming the precursor has completely transformed into the pure hexagonal In2O3 crystal. Compared with those of the bulk material, the peaks were relatively broadened, which demonstrated that the In2O3 had a small crystal size. Further, the crystallite size is estimated using the Scherrer formula:| |
D = 0.89λ/β![[thin space (1/6-em)]](https://www.rsc.org/images/entities/char_2009.gif) cos cos![[thin space (1/6-em)]](https://www.rsc.org/images/entities/char_2009.gif) θ θ
| (2) |
where D is the mean crystallite size, λ is the wavelength of the X-ray radiation (λ = 0.154 nm for CuKα1 radiation), and β is the full width at half-maximum of diffraction peak at 2θ. The average crystallite size of the as-prepared In2O3 sample was approximately 18.2 nm.
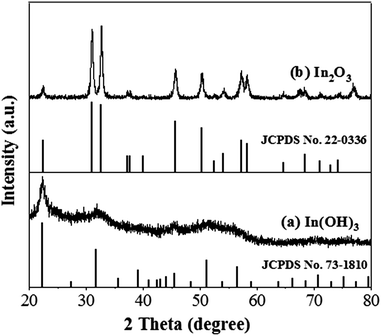 |
| | Fig. 1 XRD patterns of the In(OH)3 precursors and as-synthesized In2O3 products. | |
The morphology of as-prepared In(OH)3 precursor was demonstrated by FESEM, as shown in Fig. 2. It can be seen that the sample was composed of a large number of flower-like architecture with diameters of about 1.5–2 μm (Fig. 2(a)). Furthermore, the 3D flower-like architecture was consisted of many 2D nanoplates of In(OH)3 (Fig. 2(b)). In2O3 sample can be obtained by annealing the In(OH)3 precursor at 500 °C. Clearly the In2O3 product inherits the morphology of its precursor, as shown in Fig. 3(a). The detailed structure characteristics of them have been described previously. Composition of the as-prepared flower-like In2O3 hierarchical nanostructures is shown in Fig. 3(b). It is revealed that the sample is composed of In and O elements. Moreover, no impurity was detected, indicating a high purity of the as-prepared products. Fig. 3(c) shows the representative TEM image of a single flower-like In2O3 nanostructure. It can be seen that the flower-like nanostructure with the diameter of 1.5–2 μm, which is built of a lot of nanoplates. Fig. 3(d) shows that nanoplates of flower-like nanostructures possess a porous structure with a pore-size distribution ranging form 10 to 20 nm. The HRTEM image of a nanoplate at the edge of the flower-like In2O3 nanostructure is depicted in Fig. 3(e). The observed lattice perpendicular to the nanoplates length is about 0.274 nm, in agreement with the (110) plane of hexagonal phase of In2O3, demonstrating the nanoplates were mainly dominated by the (110) surface.
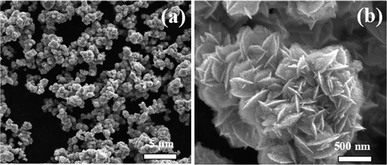 |
| | Fig. 2 (a) Low and (b) high magnification FESEM images of the as-prepared In(OH)3 precursors. | |
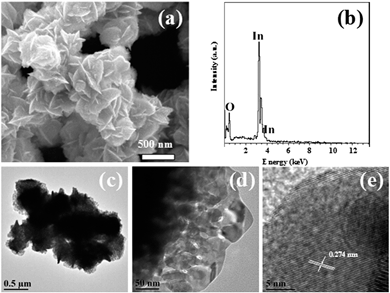 |
| | Fig. 3 (a) FESEM image of the In2O3 sample; (b) EDS pattern of flower-like In2O3 nanostructure; (c) low and (d) high magnification TEM image of flower-like In2O3 hierarchical nanostructure; (e) the corresponding HRTEM image with labeled lattice spacing. | |
To further obtain the information about the pores in the nanoplates, the nitrogen adsorption and desorption measurements were performed at 77 K. Seen from Fig. 4, the prepared In2O3 products exhibited a hysteresis loop in a high relative pressure range of 0.63–0.94, which was ascribed to a type IV isotherm, indicating the presence of mesopores. The pore size distribution (inserted in Fig. 4) for the desorption branch of the N2 isotherm using the BJH method indicates that flower-like In2O3 hierarchical nanostructures have an average pore diameter of 18 nm. The result is in good agreement with the TEM image. Since the as-prepared In2O3 products possess large surface area and mesoporous structure, which are greatly advantageous for gas adsorption–desorption, gas molecular diffusion, and providing more surface sites for oxygen, it is believed that they can be potentially applied in gas sensors with enhanced gas-sensing performance.
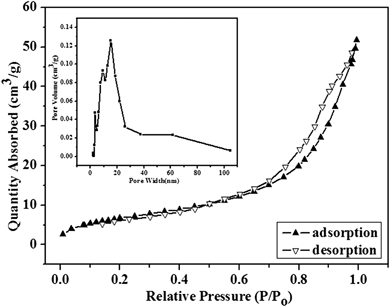 |
| | Fig. 4 Typical N2 adsorption–desorption isotherm and BJH pore size distribution plots (inset) of flower-like In2O3 hierarchical nanostructures. | |
Based on the above experimental results, we proposed a possible formation mechanism for flower-like In2O3 hierarchical nanostructures. It was believed that the formation of products could be brought out as the following equations. Firstly, In3+ and [C6H5O7]3− are produced after InCl3 and Na3C6H5O7·2H2O dissolved into the deionized water (eqn (3) and (4)). In3+ can be easily combined with [C6H5O7]3− via the chelating effect (eqn (5)). Urea is an important biological molecule that can decompose and release OH− in an indirect manner (eqn (6) and (7)). Then, In3+ will be released and gradually converted into In(OH)3 nuclei via the chemical reaction (eqn (8)). Upon hydrothermal treatment, the In(OH)3 nuclei subsequently aggregated to form small particles, followed by their self-assembly into 2D In(OH)3 nanoplates through oriented growth, and then the arrangement of these nanoplates into 3D hierarchical nanostructures,26–28 as schematically illustrated in Fig. 5. Finally, during the calcination process, the In(OH)3 precursor is converted to In2O3 (eqn (9)). Thermal decomposition of the organic impurity (citrate salt) and the release of H2O in confined space during the sintered process led to the formation of porous structure.
| | |
Na3C6O7H5 → [C6H5O7]3− + 3Na+
| (4) |
| | |
In3+ + [C6H5O7]3− → [C6H5O7]3−In3+
| (5) |
| | |
CO(NH2)2 + 3H2O → CO2 + 2NH3·H2O
| (6) |
| | |
[C6O7H5]3−In3+ + 3OH− → In(OH)3 + [C6O7H5]3−
| (8) |
| | |
In(OH)3 → In2O3 + H2O
| (9) |
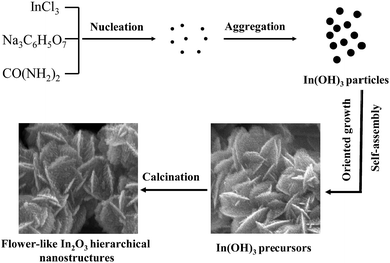 |
| | Fig. 5 Schematic illustration of the formation process of flower-like In2O3 hierarchical nanostructures. | |
The oriented growth into In(OH)3 nanoplates is possibly induced by the reorientation of the formed In(OH)3 aggregation composed of numerous nuclei, under the present of DMF, in order to minimize the total energy of the reaction system. A similar phenomenon has been reported in the formation of flower-shaped SnO2 nanostructures.29 Previous reports suggested that the solvent composition has a significant impact on the products morphology.30,31 To reveal the influence of DMF during the growth process of flower-like hierarchical nanostructures, the study of morphology evolution of In(OH)3 precursor with different reaction conditions was investigated by changing the H2O–DMF volume ratios, while temperature and reaction time were kept at 170 °C and 14 h, respectively. As shown in Fig. 6(a) and (b), unconsolidated spheres and particles were observed with the H2O–DMF volume ratio of 30![[thin space (1/6-em)]](https://www.rsc.org/images/entities/char_2009.gif) :
:![[thin space (1/6-em)]](https://www.rsc.org/images/entities/char_2009.gif) 0 and 20
0 and 20![[thin space (1/6-em)]](https://www.rsc.org/images/entities/char_2009.gif) :
:![[thin space (1/6-em)]](https://www.rsc.org/images/entities/char_2009.gif) 10. When the products were prepared at a volume ratio of 15
10. When the products were prepared at a volume ratio of 15![[thin space (1/6-em)]](https://www.rsc.org/images/entities/char_2009.gif) :
:![[thin space (1/6-em)]](https://www.rsc.org/images/entities/char_2009.gif) 15, considerable flower-like hierarchical nanostructures were obtained (Fig. 6(c)). As the sample prepared at volume ratio of 10
15, considerable flower-like hierarchical nanostructures were obtained (Fig. 6(c)). As the sample prepared at volume ratio of 10![[thin space (1/6-em)]](https://www.rsc.org/images/entities/char_2009.gif) :
:![[thin space (1/6-em)]](https://www.rsc.org/images/entities/char_2009.gif) 20, FESEM image (Fig. 6(d)) showed that In(OH)3 precursor transformed into the sphere-like architecture with diameters of 1 μm, only few plates were detected at the edge of the spheres. When the H2O–DMF volume ratio was 0
20, FESEM image (Fig. 6(d)) showed that In(OH)3 precursor transformed into the sphere-like architecture with diameters of 1 μm, only few plates were detected at the edge of the spheres. When the H2O–DMF volume ratio was 0![[thin space (1/6-em)]](https://www.rsc.org/images/entities/char_2009.gif) :
:![[thin space (1/6-em)]](https://www.rsc.org/images/entities/char_2009.gif) 30, no product was observed due to the absence of water (eqn (6)). FESEM images under different solvent ratios indicated that the solvent composition had a significant influence on the morphologies. And the detailed mechanism for the formation of flower-like In2O3 hierarchical nanostructures is still under investigation by our group.
30, no product was observed due to the absence of water (eqn (6)). FESEM images under different solvent ratios indicated that the solvent composition had a significant influence on the morphologies. And the detailed mechanism for the formation of flower-like In2O3 hierarchical nanostructures is still under investigation by our group.
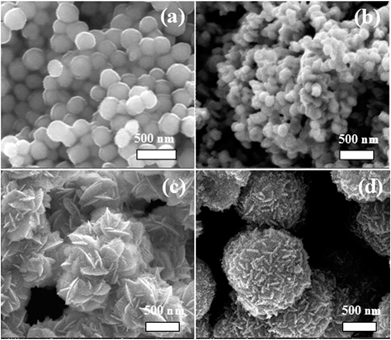 |
| | Fig. 6 FESEM images of In(OH)3 precursors prepared with different H2O–DMF volume ratio of (a) 30![[thin space (1/6-em)]](https://www.rsc.org/images/entities/char_2009.gif) : :![[thin space (1/6-em)]](https://www.rsc.org/images/entities/char_2009.gif) 0; (b) 20 0; (b) 20![[thin space (1/6-em)]](https://www.rsc.org/images/entities/char_2009.gif) : :![[thin space (1/6-em)]](https://www.rsc.org/images/entities/char_2009.gif) 10; (c) 15 10; (c) 15![[thin space (1/6-em)]](https://www.rsc.org/images/entities/char_2009.gif) : :![[thin space (1/6-em)]](https://www.rsc.org/images/entities/char_2009.gif) 15 and (d) 10 15 and (d) 10![[thin space (1/6-em)]](https://www.rsc.org/images/entities/char_2009.gif) : :![[thin space (1/6-em)]](https://www.rsc.org/images/entities/char_2009.gif) 20. 20. | |
Gas-sensing properties
In general, the response of semiconducting metal oxide gas sensors was dependent on the operating temperature.32 Therefore, to find the optimum detection temperature, the responses of flower-like In2O3 hierarchical nanostructures to 100 ppm ethanol were tested as a function of operating temperature from 200 to 400 °C. As shown in Fig. 7, the response was strongly dependent on the operating temperature. As the working temperature increases, a higher response is obtained because of the activation of adsorbed molecular oxygen and lattice oxygen to form active O2− and O−. This phenomenon continues up to a certain optimum temperature, beyond which exothermic gas adsorption becomes difficult and gas molecules begin to desorption in large quantities, leading to a drop in sensor response. Thus, the optimum temperature is a balance point between two conflicting mechanisms.33,34 It can be seen that the sensor had an optimum operating temperature of 320 °C, at which the sensor exhibited the highest response of 28 to ethanol gas. As a consequence, we choose 320 °C as the optimum operating temperature to proceed with subsequent investigation in our experiment.
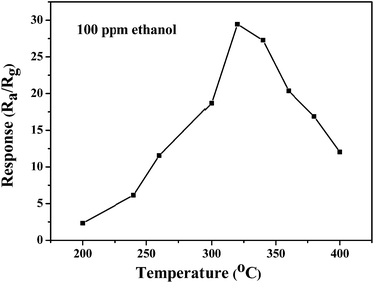 |
| | Fig. 7 Response vs. operating temperature of flower-like In2O3 hierarchical nanostructures exposing 100 ppm ethanol. | |
Fig. 8(a) shows the typical response of gas sensors based on flower-like In2O3 hierarchical nanostructures to 2–1000 ppm ethanol at 320 °C. For the gas sensing mechanism of as-prepared flower-like In2O3 hierarchical nanostructures, it should belong to the surface-controlled type, which may be explained by the change in resistance of the sensor upon exposure to different gas atmospheres. When the sensors were exposed to air, O2 adsorb on the surface and create chemisorbed oxygen species (such as O2−, O− and O2−) by capturing electrons from the conductance band through eqn (10), resulting in a high resistance state of the In2O3 samples:
| | |
O2 (ads) + e− → O2− (ads)
| (11) |
| | |
O2− (ads) + e− → 2O− (ads)
| (12) |
| | |
O− (ads) + e− → O2− (ads)
| (13) |
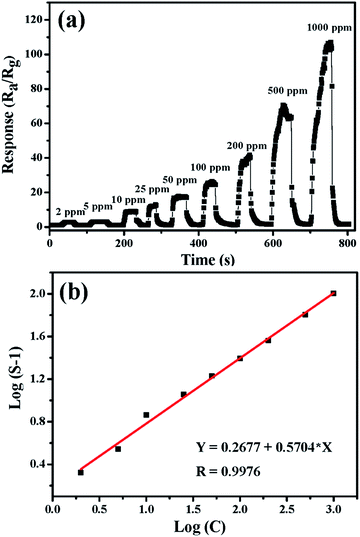 |
| | Fig. 8 (a) Typical response curves and variation of the response of flower-like In2O3 hierarchical nanostructures exposed to different concentration of ethanol ranging from 2 to 1000 ppm and measured at 320 °C; (b) the corresponding log(S − 1) vs. log(C). | |
When the sensors exposed to ethanol vapor at higher temperature, ethanol reacts with the adsorbed oxygen ions reducing their concentration and thereby increasing the semiconductor conductivity. The possible reactions took place on the surface of indium oxide as follows:35,36
| | |
CH3CH2OH + 3Oads2− → 2CO2 + 3H2O + 6e−
| (14) |
When exposed to air again, the In2O3 sensors recover to the initial electronic structure. With increasing concentration of ethanol, the sensor response greatly increased. The response can be empirically represented as S = a[C]b + 1, where a and b are the constants and S is the gas response, C is the concentration of the test gas. Generally, the exponent b has an ideal value of either 0.5 or 1. Fig. 8(b) shows a chart of logarithm of the response of the sensor (S−1) versus the logarithm of ethanol concentration (C). It can be seen that the response of the sensor based on flower-like In2O3 hierarchical nanostructures has a good linear relationship with the ethanol concentration (2–1000 ppm range) in logarithmic forms, and the value of b towards ethanol was about 0.5704, which was in good agreement with the theory of power laws for semiconductor sensors.37,38 The results highlighted the potential applications of the flower-like In2O3 hierarchical nanostructures in monitoring ethanol gas.
It is evident that the response curves of the sensor increases sharply with increasing concentration of ethanol and then returns to the baseline quickly with the ethanol exhausted out in the closed testing chamber, indicating their quick and reversible response and recovery time. For 100 ppm ethanol gas, 18 s and 9 s are the response and recovery time for flower-like In2O3 hierarchical nanostructures, respectively. In addition, the flower-like In2O3 hierarchical nanostructures based sensor exhibits excellent reproducibility as shown in Fig. 9(a). The sensor maintained its initial response amplitude without a clear decrease upon three successive sensing tests for 100 ppm ethanol. Furthermore, the stability of the sensor was also determined at optimal operating temperature for 60 hours. Clearly, as shown in Fig. 9(b), the senor has nearly constant response to 100 ppm ethanol, which confirmed the high stability of the sensor based on flower-like In2O3 hierarchical nanostructures.
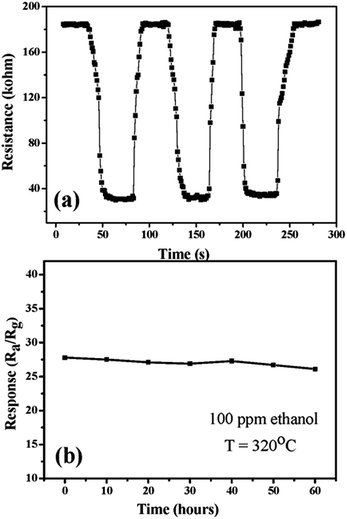 |
| | Fig. 9 (a) Reproducibility (3 cycles) and (b) stability of flower-like In2O3 hierarchical nanostructures sensor on successive exposure to 100 ppm ethanol at 320 °C. | |
A comparative gas sensing study between the as-prepared products and commercial bulk In2O3 particles prepared by precipitation method was performed to demonstrate the superior ethanol-sensing properties of flower-like In2O3 hierarchical nanostructures. We have measured the response of flower-like In2O3 hierarchical nanostructures and bulk In2O3 particles to six kinds of volatile vapors with a concentration of 50 ppm, such as ammonia, benzene, acetone, methanol, formaldehyde and ethanol at the working temperature of 320 °C (Fig. 10). As expected, the sensor based on flower-like In2O3 hierarchical nanostructures exhibited enhanced responses for each gas compared with that based on bulk In2O3 particles. Furthermore, the response of sensor based on flower-like In2O3 hierarchical nanostructures to ethanol was apparently higher than that to other gases, which seems to depend on the interaction discrepancy between the sensing layer and different testing gas. Furthermore, the response performances of some typical In2O3-based ethanol gas sensors were listed in Table 1. It should be pointed out that flower-like In2O3 hierarchical nanostructures in present study possess superior performance when compared with other nanostructured In2O3 sensors reported in previous works. Consequently, it was concluded that the sensor based on the as-prepared flower-like In2O3 hierarchical nanostructures showed superior gas sensing performance towards ethanol and it may be have potential applications in the detection of ethanol vapors.
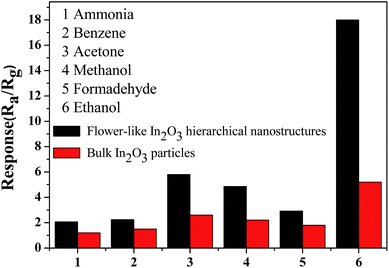 |
| | Fig. 10 Responses of flower-like In2O3 hierarchical nanostructures and bulk particles upon exposure to six kinds of target gases (50 ppm) at a working temperature of 320 °C. | |
Table 1 Gas-sensing properties of various In2O3 nanostructures to 100 ppm ethanol in the literatures and present study
| Sensing In2O3 nanostructures |
Operating temperature (°C) |
Sensor response |
Response/recovery times (s) |
Detection limit (ppm) |
Ref. |
| Flower-like In2O3 nanostructures |
320 |
27.6 |
18/9 |
2 |
This work |
| In2O3:Er hollow spheres |
215 |
40.3 |
10/23 |
7 |
39 |
| Nanoporous In2O3 hollow spheres |
400 |
137.2 |
2/830 |
20 |
40 |
| In2O3 nanospheres |
275 |
∼21 |
16/24 |
20 |
23 |
| Co-doped In2O3 nanowires |
300 |
∼17 |
2/3 |
5 |
41 |
| In2O3 porous nanoparticles |
200 |
∼4 |
6/15 |
100 |
42 |
| Mesoporous In2O3 |
220 |
27.9 |
74/119 |
0.05 |
43 |
| Au-loaded In2O3 nanofibers |
140 |
6.5 |
12/24 |
10 |
44 |
| In2O3 microspheres |
200 |
1.8 |
27/24 |
100 |
45 |
Conclusions
In summary, a simple one-step solution route combined with a subsequent calcining process was reported for the formation of flower-like In2O3 hierarchical nanostructures, which were composed of many 2-D nanoplates with high porosity. The structure and morphology of In2O3 samples were investigated in detail, and a possible growth mechanism was supposed from the viewpoint of nucleation and self-assembly of building blocks. Moreover, the gas sensing tests exhibited that flower-like In2O3 hierarchical nanostructures showed superior gas sensing performance towards ethanol. The results suggest that the as-prepared flower-like In2O3 hierarchical nanostructures are promising candidates for good performance ethanol sensor.
Acknowledgements
This work was financially supported by National Natural Science Foundation of China (no. 61102006), Natural Science Foundation of Shandong Province, China (no. ZR2010EQ009).
Notes and references
- G. Neri, A. Bonavita, G. Micali, N. Donato, F. A. Deorsola, P. Mossino, I. Amato and B. De Benedetti, Sens. Actuators, B, 2006, 117, 196–204 CrossRef CAS PubMed.
- P. Ivanov, E. Llobet, X. Vilanova, J. Brezmes, J. Hubalek and X. Correig, Sens. Actuators, B, 2004, 99, 201–206 CrossRef CAS PubMed.
- L. Li, M. M. Liu, S. J. He and W. Chen, Anal. Chem., 2014, 86, 7996–8002 CrossRef CAS PubMed.
- P. P. Jin, X. X. Zou, L. J. Zhou, J. Zhao, H. Chen, Y. Tian and G. D. Li, Sens. Actuators, B, 2014, 104, 142–148 CrossRef PubMed.
- J. Xie, H. Wang and M. Duan, Sens. Actuators, B, 2014, 203, 239–244 CrossRef CAS PubMed.
- X. F. Chu, S. M. Zhou, W. B. Zhang and H. F. Shui, Mater. Sci. Eng., B, 2009, 164, 65–69 CrossRef CAS PubMed.
- S. B. Upadhyay, R. K. Mishra and P. P. Sahay, Sens. Actuators, B, 2014, 193, 19–27 CrossRef CAS PubMed.
- P. Sowti Khiabani, A. Hosseinmardi, E. Marzbanrad, S. Ghashghaiea, C. Zamanic, M. Keyanpour-Radd and B. Raissi, Sens. Actuators, B, 2012, 162, 102–107 CrossRef CAS PubMed.
- P. Sowti Khiabani, E. Marzbanrad, C. Zamani, R. Riahifar and B. Raissi, Sens. Actuators, B, 2012, 166–167, 128–134 CrossRef PubMed.
- T. Wagner, T. Sauerwald, C.-D. Kohl, T. Waitz, C. Weidmann and M. Tiemann, Thin Solid Films, 2009, 517, 6170–6175 CrossRef CAS PubMed.
- P. Y. Song and W. D. Zhang, Mater. Res. Bull., 2014, 53, 177–184 CrossRef CAS PubMed.
- A. Ayeshamariam, M. Bououdina and C. Sanjeeviraja, Mater. Sci. Semicond. Process., 2013, 16, 686–695 CrossRef CAS PubMed.
- Z. L. Zhan, J. W. Lu, W. H. Song, D. G. Jiang and J. Q. Xu, Mater. Res. Bull., 2007, 42, 228–235 CrossRef CAS PubMed.
- M. I. Ivanovskaya, D. A. Kotsikaua, A. Taurinob and P. Siciliano, Sens. Actuators, B, 2007, 124, 133–142 CrossRef CAS PubMed.
- H. Ko, S. Park, S. An and C. Lee, Curr. Appl. Phys., 2013, 13, 919–924 CrossRef PubMed.
- K. Inyawilert, A. Wisitsora-at, A. Tuantranont, P. Singjai, S. Phanichphant and C. Liewhiran, Sens. Actuators, B, 2014, 192, 745–754 CrossRef CAS PubMed.
- C. W. Lai, J. Y. Dai, X. Y. Zhang, H. L. W. Chan, Y. M. Xu, Q. Li and H. C. Ong, J. Cryst. Growth, 2005, 282, 383–388 CrossRef CAS PubMed.
- D. L. Shao, L. Q. Qin and S. Sawyer, Appl. Surf. Sci., 2012, 261, 123–127 CrossRef CAS PubMed.
- Q. Qi, P. P. Wang, J. Zhao, L. L. Feng, L. J. Zhou, R. F. Xuan, Y. P. Liu and G. D. Li, Sens. Actuators, B, 2014, 194, 440–446 CrossRef CAS PubMed.
- A. Vomiero, S. Bianchi, E. Comini, G. Faglia, M. Ferroni, N. Poli and G. Sberveglieri, Thin Solid Films, 2007, 515, 8356–8359 CrossRef CAS PubMed.
- W. Zeng, H. Zhang, Y. Q. Lia, W. G. Chen and Z. C. Wang, Mater. Res. Bull., 2014, 57, 91–96 CrossRef CAS PubMed.
- P. Sun, W. Zhao, Y. Cao, Y. Guan, Y. F. Sun and G. Y. Lu, CrystEngComm, 2011, 13, 3718–3724 RSC.
- P. Song, D. Han, H. H. Zhang, J. Li, Z. X. Yang and Q. Wang, Sens. Actuators, B, 2014, 196, 434–439 CrossRef CAS PubMed.
- N. F. Hamedani, A. R. Mahjoub, A. A. khodadadi and Y. Mortazavi, Sens. Actuators, B, 2012, 169, 67–73 CrossRef CAS PubMed.
- J. R. Huang, K. Yua, C. P. Gu, M. H. Zhai, Y. Z. Wu, M. Yang and J. H. Liu, Sens. Actuators, B, 2010, 147, 467–474 CrossRef CAS PubMed.
- J. Y. Liu, T. Luo, F. L. Meng, K. Qian, Y. T. Wan and J. H. Liu, J. Phys. Chem. C, 2010, 114, 4887–4894 CAS.
- J. T. Zai, J. Zhu, R. R. Qi and X. F. Qian, J. Mater. Chem. A, 2013, 1, 735–745 CAS.
- C. Q. Wang, D. R. Chen and X. L. Jiao, J. Phys. Chem. C, 2009, 113, 7714–7718 CAS.
- W. L. Jiao and L. Zhang, Particuology, 2013, 11, 743–747 CrossRef CAS PubMed.
- T. Yan, X. Wang, J. Long, H. Lin, R. Yuan, W. Dai, Z. Li and X. Fu, New J. Chem., 2008, 32, 1843–1846 RSC.
- B. L. Tao, Y. Zhang, D. Z. Han, Y. P. Li and Z. F. Yan, J. Mater. Chem. A, 2014, 2, 5455–5461 CAS.
- Z. Lou, L. L. Wang, T. Fei and T. Zhang, New J. Chem., 2012, 36, 1003–1007 RSC.
- L. J. Bie, X. N. Yan, J. Yin, Y. Q. Duan and Z. H. Yuan, Sens. Actuators, B, 2007, 126, 604–608 CrossRef CAS PubMed.
- P. Sun, X. Zhou, C. Wang, K. Shimanoe, G. Lu and N. Yamazoe, J. Mater. Chem. A, 2014, 2, 1302–1308 CAS.
- J. Q. Xu, J. J. Han, Y. Zhang, Y. A. Sun and B. Xie, Sens. Actuators, B, 2008, 132, 334–339 CrossRef CAS PubMed.
- H. Men, P. Gao, B. B. Zhou, Y. J. Chen, C. L. Zhu, G. Xiao, L. Q. Wang and M. L. Zhang, Chem. Commun., 2010, 46, 7581–7583 RSC.
- N. Yamazoe and K. Shimanoe, Sens. Actuators, B, 2008, 128, 566–573 CrossRef CAS PubMed.
- X. J. Liu, Z. Chang, L. Luo, X. D. Lei, J. F. Liu and X. M. Sun, J. Mater. Chem., 2012, 22, 7232–7238 RSC.
- T. Zhang, F. B. Gu, D. M. Han, Z. H. Wang and G. S. Guo, Sens. Actuators, B, 2013, 177, 1180–1188 CrossRef CAS PubMed.
- S. J. Kim, I. S. Hwang, J. K. Choi, Y. C. Kang and J. H. Lee, Sens. Actuators, B, 2011, 155, 512–518 CrossRef CAS PubMed.
- Z. Li and Y. Dzenis, Talanta, 2011, 85, 82–85 CrossRef CAS PubMed.
- L. Wang, F. Tang, K. Ozawa, Z. G. Chen, A. Mukherj, Y. Zhu, J. Zou, H. M. Cheng and G. Q. Lu, Angew. Chem., Int. Ed., 2009, 48, 7048–7051 CrossRef CAS PubMed.
- X. H. Sun, H. R. Hao, H. M. Ji, X. L. Li, S. Cai and C. M. Zheng, ACS Appl. Mater. Interfaces, 2014, 6, 401–409 CAS.
- X. J. Xu, H. T. Fan, Y. T. Liu, L. J. Wang and T. Zhang, Sens. Actuators, B, 2011, 160, 713–719 CrossRef CAS PubMed.
- X. Q. Wang, M. F. Zhang, J. Y. Liu, T. Luo and Y. T. Qian, Sens. Actuators, B, 2009, 137, 103–110 CrossRef PubMed.
|
| This journal is © The Royal Society of Chemistry 2014 |
Click here to see how this site uses Cookies. View our privacy policy here. ![[thin space (1/6-em)]](https://www.rsc.org/images/entities/char_2009.gif) cos
cos![[thin space (1/6-em)]](https://www.rsc.org/images/entities/char_2009.gif) θ
θ


![[thin space (1/6-em)]](https://www.rsc.org/images/entities/char_2009.gif) :
:![[thin space (1/6-em)]](https://www.rsc.org/images/entities/char_2009.gif) 0 and 20
0 and 20![[thin space (1/6-em)]](https://www.rsc.org/images/entities/char_2009.gif) :
:![[thin space (1/6-em)]](https://www.rsc.org/images/entities/char_2009.gif) 10. When the products were prepared at a volume ratio of 15
10. When the products were prepared at a volume ratio of 15![[thin space (1/6-em)]](https://www.rsc.org/images/entities/char_2009.gif) :
:![[thin space (1/6-em)]](https://www.rsc.org/images/entities/char_2009.gif) 15, considerable flower-like hierarchical nanostructures were obtained (Fig. 6(c)). As the sample prepared at volume ratio of 10
15, considerable flower-like hierarchical nanostructures were obtained (Fig. 6(c)). As the sample prepared at volume ratio of 10![[thin space (1/6-em)]](https://www.rsc.org/images/entities/char_2009.gif) :
:![[thin space (1/6-em)]](https://www.rsc.org/images/entities/char_2009.gif) 20, FESEM image (Fig. 6(d)) showed that In(OH)3 precursor transformed into the sphere-like architecture with diameters of 1 μm, only few plates were detected at the edge of the spheres. When the H2O–DMF volume ratio was 0
20, FESEM image (Fig. 6(d)) showed that In(OH)3 precursor transformed into the sphere-like architecture with diameters of 1 μm, only few plates were detected at the edge of the spheres. When the H2O–DMF volume ratio was 0![[thin space (1/6-em)]](https://www.rsc.org/images/entities/char_2009.gif) :
:![[thin space (1/6-em)]](https://www.rsc.org/images/entities/char_2009.gif) 30, no product was observed due to the absence of water (eqn (6)). FESEM images under different solvent ratios indicated that the solvent composition had a significant influence on the morphologies. And the detailed mechanism for the formation of flower-like In2O3 hierarchical nanostructures is still under investigation by our group.
30, no product was observed due to the absence of water (eqn (6)). FESEM images under different solvent ratios indicated that the solvent composition had a significant influence on the morphologies. And the detailed mechanism for the formation of flower-like In2O3 hierarchical nanostructures is still under investigation by our group.
![[thin space (1/6-em)]](https://www.rsc.org/images/entities/char_2009.gif) :
:![[thin space (1/6-em)]](https://www.rsc.org/images/entities/char_2009.gif) 0; (b) 20
0; (b) 20![[thin space (1/6-em)]](https://www.rsc.org/images/entities/char_2009.gif) :
:![[thin space (1/6-em)]](https://www.rsc.org/images/entities/char_2009.gif) 10; (c) 15
10; (c) 15![[thin space (1/6-em)]](https://www.rsc.org/images/entities/char_2009.gif) :
:![[thin space (1/6-em)]](https://www.rsc.org/images/entities/char_2009.gif) 15 and (d) 10
15 and (d) 10![[thin space (1/6-em)]](https://www.rsc.org/images/entities/char_2009.gif) :
:![[thin space (1/6-em)]](https://www.rsc.org/images/entities/char_2009.gif) 20.
20.


