A TiO2 nanofiber/activated carbon composite as a novel effective electrode material for capacitive deionization of brackish water

Ahmed G. El-Deena, Jae-Hwan Choib, Khalil Abdelrazek Khalilcd, Abdulhakim A. Almajidc and Nasser A. M. Barakat*ae
aBioNanosystem Department, Chonbuk National University, Jeonju 561-756, South Korea. E-mail: nasser@jbnu.ac.kr; Fax: +82632702348; Tel: +82632702363
bDepartment of Chemical Engineering, Kongju National University, 1223-24 Cheonan-daero, Seobuk-gu, Cheonan, Chungnam 331-717, Republic of Korea
cMechanical Engineering Department, King Saud University, P.O. Box 800, Riyadh 11421, Saudi Arabia
dMaterials Engineering and Design Department, Aswan University, Aswan, Egypt
eChemical Engineering Department, Faculty of Engineering, Minia University, El-Minia, Egypt

Received 6th September 2014 , Accepted 19th November 2014

First published on 19th November 2014


Abstract

Based on its excellent characteristics, high surface area, environmentally safe and availability in nature; activated carbon (AC) is the best candidate as a capacitive deionization (CDI) electrode material. Among the various modification methods for AC, incorporation of TiO2 nanoparticles into the activated carbon proved to be an effective approach to enhance the desalination performance. Compared to the nanoparticulate morphology, nanofibers have a large axial ratio which provides a better electrosorption performance. Herein, for the first time, TiO2 nanofibers (TNFs) prepared by the electrospinning process were exploited with activated carbon to form a hybrid network electrode for capacitive deionization. The phase morphology and crystal structure were characterized by scanning electron microscopy (SEM) and X-ray diffraction (XRD), respectively. The electrochemical behavior was evaluated by cyclic voltammetry (CV). Furthermore, the desalination performances under different applied voltages and salty water concentrations were investigated using a prototype CDI unit in a continuous mode water flow. The results indicated that the electrode prepared from 10 wt% nanofibers (ACTNF 10%) exhibits the best results compared to other electrodes having 5 and 15 wt% TiO2 nanofibers. Typically, the best electrode networks showed very good specific capacitance (380 F g−1), excellent electrosorptive capacity (17.7 mg per gcarbon) at a cell potential of 1.2 V and an initial NaCl concentration of 292 mg L−1, and a distinguished salt removal efficiency (∼89.6%). Moreover, the introduced electrode shows interesting recyclability and easy full regeneration.
1. Introduction

Fresh water shortages have become one of the greatest dilemmas facing the continuity of the mankind and other creatures in most countries. Moreover, contamination of water sources and the dramatic increase in the population make matters worse.1 Consequently, the availability of affordable clean water is the strongest challenge to the international community. Water desalination is a key technology offering an appropriate route to improve the quality and quantity of pure water.2 Unfortunately, most of conventional desalination methodologies including multiple-effect distillation (MED), multi-stage flash distillation (MSF), reverse osmosis (RO) and electrodialysis require a great deal of energy, secondary chemical wastes and high capital cost. Hence, alternative desalination technologies are needed to avoid the drawbacks of the traditional desalination techniques.3,4 Capacitive deionization (CDI) is a promising electrosorption technology to desalinate brackish water; it has been recently attracting unprecedented attention in desalination field due to the power saving, eco-friendly and easily operational and maintenance processes.5–9 CDI, in essence, is a purely capacitive process based on the principle of electrosorption of ions on charged pours electrodes formed by the electrical double layer (EDL). Electrostatically, the adsorbed ions may be either released from the electrode pore surfaces by shunting the electrodes together, or, at least in the membrane version, may be actively driven off by reversing polarity.10,11 A problem with capacitive deionization is the concentration polarization of the electrodes. This kind of polarization refers to a depletion of ions at the electrode surface. This has deleterious effects, such as an increased resistance. Therefore, reducing the concentration polarization of the capacitive carbons is important to attaining improved performance, not only for capacitive deionization, but for electric double layer capacitors (ELDC's) in general. Methods which increase surface wettability are expected to be important in this regard.

Typically, high surface area, good chemical inertia, wettability characteristics, excellent electrochemical performance as well as low electric polarization are the most important features for optimum CDI electrode material.12,13 In fulfilling the foregoing requirements, carbon materials are the best candidates as CDI electrode. Recently, porous carbon materials such as carbon aerogels,14 macro and mesoporous carbon (MC),15–18 multi-channels and hollow carbon nanofibers,19–21 carbon nanotube22–24 and graphene composite25–30 have been investigated as electrode materials. However, up to date, activated carbon (AC) is a commonly used as porous CDI electrode material because of its great surface area with a high degree of porosity and exceptional adsorption capability as well as low cost.31 Unfortunately, the AC electrodes are polarisable. As well known, the polarization reduces accumulation of ions on the double-layer of AC.32 A recent, surprising development regarding surface modification of the carbon electrodes for capacitive deionization is the discovery that ionic group molecules incorporated within the Debye length region of the double layer volume of the electrode pores polarize the electrodes with respect to anions or cations. This achieves coulombic efficiency without use of membranes. Coulombic efficiency is necessary to achieve better purification, water, and energy efficiency.33,34

Among various metal oxides, TiO2 is a low cost, eco-friendly and having known photocatalytic ability for degradation of the organic pollutants and annihilation of some microorganisms. Moreover, its good charged surface leads to reduce the polarization of AC thereby the electrosorption capacity could be increased.35,36 The aggregation of TiO2 nanoparticles (NPs) is a severe dilemma negatively affects the performance of conventional TiO2 NPs/AC electrodes.37,38 In other words, most of reported methods for modified AC by TiO2 nano or microparticles still can't prevent agglomeration process and pore blocking of the electrode surface. Among the reported nanostructures, nanofibrous morphology has a large axial ratio that leads to prevent intra aggregation and inter agglomeration in TiO2 nanofibers/AC composite (ACTNF). Hence, using TiO2 nanofibers with AC as CDI electrode is expected to increase the accessibility for ion adsorption, and accelerate ions diffusion pathway form saline solution to surface electrode.

In this study, the TiO2 nanofibers intercalated AC (ACTNF) as hybrid network CDI electrode is introduced. To evaluate the desalination behavior of the modified AC electrode, the proposed composite electrode was investigated under different factors during CDI process. It is noteworthy, this network composite achieved a lot of electrode requirements; cost-effective, good wettability, decrease polarization of the surface, prevent agglomerations process and easy regeneration.

2. Experimental

2.1. Materials

Titanium(IV) isopropoxide (C12H28O4Ti, 98.0 assay), poly (vinyl acetate) (PVAc, MW = 500[thin space (1/6-em)]000 g mol−1) was obtained from Aldrich, USA. N,N-Dimethylformamide (DMF 99.5% assay; SAMCHUN Pure Chemical Co., South Korea), activated carbon powder (CEP-21K, PCT Co., Korea, BET surface area = 2110 m2 g−1), poly (vinylidene fluoride) (PVdF, MW = 530[thin space (1/6-em)]000, Aldrich) and dimethylacetamide (DMAc, Aldrich). All reagents were used without any further purification.

2.2. Synthesis TiO2 nanofibers by electrospinning

The TiO2 nanofibers were synthesized by electrospinning technique.39 In detail, 1 g titanium isopropoxide Ti(OiPr)4 was added to 2 g poly(vinyl acetate) (PVAc, 14 wt% in DMF) then few drops of acetic acid were added until the solution became transparent, the mixture was stirred at 25 °C for 2 h to form sol gel. Electrospinning of the sol gel solutions was carried out at 20 kV and 18 cm distance between the collector and the tip of the syringe. The obtained electrospun nanofiber mats were initially dried for 24 h at 60 °C in a vacuum and then sintered in air atmosphere at 700 °C for 1 h with a heating rate of 5 °C min−1.

2.3. Fabrication of activated carbon/TiO2 nanofibers nanocomposite electrodes

To fabricated ACTNF networks CDI electrode, specific amount of the obtained TNFs (5 wt%, 10 wt% and 15 wt%) were combined with dispersion solution of AC in DMAC then the mixture was sonicated for 1 h, the sol–gel of polyvinylidene fluoride (PVDF, 10 wt%) dissolved in DMAC was added as a binder. The mixture transferred into high speed mixer (AR-100, THINKY Co., Japan) for 20 min at 20[thin space (1/6-em)]000 rpm to ensure homogeneity. The obtained slurry was casted onto graphite foil (F02511, Dongbang Carbon Co., Korea) using a doctor blade (the thickness nanocomposite electrode material was ∼250 μm). The final electrode was dried at under vacuum at 60 °C for 2 h to remove all organic solvent. The electrode area was maintained as 10 × 10 cm2 active area (100 cm2).

2.4. Characterization

The surface morphology was studied by a JEOL JSM-5900 scanning electron microscope (JEOLLtd., Japan) and field-emission scanning electron microscope (FESEM Hitachi S-7400, Japan). The phase and crystallinity were characterized using Rigaku X-ray diffractometer (XRD, Rigaku Co., Japan) with Cu Kα (λ = 1.54056 Å) radiation over a range of 2θ angles from 10 to 70°. Cyclic voltammetry measurement was carried out using different concentrations (0.1, 0.5 and 1 M) NaCl solutions, the sweep potential rang was adjusted from −0.4 to 0.6 V in an electrochemical cell with three-electrode system: platinum wire as counter electrode, Ag/AgCl as reference electrode and the prepared materials as working electrode. This system was controlled using VersaStat4 potentiostat device. Herein, the specific capacity was calculated by integrating the area of the CV curve to determine the average value according to the following equation.40,41
 
image file: c4ra09948f-t1.tif(1)
where Cs is the specific capacitance (F g−1), I is the current (A), ν is the scan rate (V s−1), ΔV is the applied potential window (V), and m is the mass of active electrode materials (g).

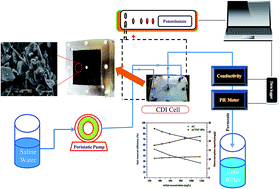
2.5. CDI unit cell setup and electrosorptive capacity measurements

Capacitive deionization system consisting of a reservoir, peristaltic pump, potentiostat (WPG100, WonA Tech Co., Korea), CDI cell, conductivity meter (Model ET901, eDAQ) and pH meter was utilized; Fig. 1 displays the used system setup. The CDI unit cell composed of two parallel electrode sheets separated by a non-conductive spacer (nylon cloth, 100 μm thick) and fixed with rubber gasket.42 The saline solution (influent) was continuously pumped into the CDI cell with 20 mL min−1 and the initial conductivity was approximately 560 μS cm−1 using single-pass experiment (SP-method). The different potentials (0.8-2.0 V) were applied in the CDI cell to study the desalination performance. The salt removal efficiency (ηd) and the electrosorption capacity (Q) of the electrode could be examined by the salt concentration change during the adsorption process:43,44
 
image file: c4ra09948f-t2.tif(2)
 
image file: c4ra09948f-t3.tif(3)
where Co (mg L−1) is the initial NaCl concentration, Cavr is the average NaCl concentration of the effluent during the adsorption process and V (L) is the total volume of the NaCl aqueous solutions, and M (g) represents the mass of active electrode materials.

image file: c4ra09948f-f1.tif
Fig. 1 Schematic diagram of capacitive deionization process.

3. Results and discussion

3.1. Phase morphology

Electrospinning has been recognized as an efficient technique for the fabrication of nanofibers structure. Electrospun fibers can adopt the diameter and porous morphology undergoes natural polymer composited and directing polymer solution from syringe nozzle design.45 Accordingly, good nanofibers morphology is expected from the electrospinning process. Fig. 2A depicts SEM image of the fabricated PVAc/Ti(OiPr)4 electrospun mats after drying under vacuum at 60 °C for 24 h. Clearly, the results reveal good morphology nanofibers without beads. After calcination, the obtained powder demonstrates smooth and good continuous nanofibrous morphology as shown in Fig 2B. It is noteworthy, the diameter frequency charts have been determined for the electrospun mat and the final TiO2 nanofibers and displayed as the insets Fig. 2A and B, respectively. From the obtained data, the average diameters were estimated to be 437 and 352 nm for electrospun mat and TiO2 nanofibers, respectively. Fig. 2C displays the microstructure of the utilized activated carbon. Panel 2D displays the low magnification SEM images for ACTNF 10% hybrids networks; the inset is a high magnification display. Obviously, the TiO2 nanofibers intercalated into activated carbon to form networks structure that leads to reduce the particles agglomeration furthermore avoid clogging pores of the activated carbon. Moreover, Fig. S1 in ESI shows the SEM image of ACTNFs 5% and ACTNFs 15% composite electrode. As shown, the surface of ACTNFs electrode having 15 wt% was almost coated by TiO2 NFs. Energy dispersive X-ray spectroscopy (EDX) spectrum in Fig. 2E conforms the presence of C, Ti and O elements in the investigated area and the inset table shows the atomic and weight ratios.
image file: c4ra09948f-f2.tif
Fig. 2 (A and B) SEM images of PVAc/Ti(OiPr)4 electrospun nanofiber mat and pure TiO2 nanofibers after calcination, pristine activated carbon (C), SEM images of the ACTNF 10% and inset is high magnification (D) and EDX analysis for the ACTNF 10% electrode (E).

The XRD analysis technique is widely employed to identify the crystallographic structures for the fabricated materials. Fig. 3 shows XRD spectra of pristine AC, pure TiO2 NFs and ACTNF 10%. AC reveals two very weak broad characteristic peaks positioned at 2θ = 24.1° and 43.3° corresponding to diffraction from (002) and (100) crystal planes of graphite, respectively. The broad diffraction peaks reflect a highly disordered and amorphous framework of the utilized activated carbon. The middle spectrum reveals the distinctive peaks corresponding to (101), (004), (200), (105), and (211) for pure anatase TiO2 NFs. On the other hand, the ACTNF 10% composite exhibits similar diffraction peaks of TiO2 indicating the TiO2 NFs incorporated into AC.


image file: c4ra09948f-f3.tif
Fig. 3 XRD patterns for the fabricated electrode materials; pristine AC, Pure TiO2 NFs and ACTNF 10%.

3.2. Surface wettability test

To investigate the surface characteristics for the fabricated electrode materials, static contact angles were measured from the water drop on the fabricated electrode at room temperature. As shown in Fig. 4, the static contact angle of a water droplet for pristine AC was approximately 129.7°. On the other hand, the ACTNF 10% composite electrode displays a noticeable decrease in contact angel ∼77.53°. Consequently, the incorporated TiO2 nanofibers into AC electrode revealed a marked improvement in the surface wettability due to the hydrophilicity of TiO2. The most important finding, the designed TiO2 nanofibers in the ACTNF 10% electrode revealed good wettability behavior without pore blocking that leads to enhance the adsorption rate from the saline solution to the electrode surface more than coating method.
image file: c4ra09948f-f4.tif
Fig. 4 (A) Contact angle of water droplet on the pristine AC and ACTNF 10% (B) electrodes.

3.3. Electrochemical behavior

Cyclic voltammetry (CV) measurements are often applied as effective tools to investigate the electrosorption behavior and evaluate the specific capacitance of the fabricated electrodes materials. Fig. 5A shows the CV profiles of the AC and ACTNF (5%, 10% and 15%) composite electrodes at a scan rate of 10 mV s−1 in a 1 M NaCl aqueous solution. Obviously, in all formulations, there are no observed redox peaks during the measurement indicates that the ions are adsorbed on the electrode surface by forming an electric double layer due to coulombic interaction rather than electrochemical reaction. Furthermore, the obtained rectangular shape implies excellent electrochemical double-layer capacitance behavior.46 Moreover, the impact of TiO2 loading on electrosorption behavior can be observed in Fig. 5A. The ACTNF (10 wt% TiO2 NFs) electrode demonstrates the largest encircled area under CV curve indicating higher and distinguished electrochemical performances. However, the ACTNF 15 wt% shows significant loss in EDL capacitance which can be attributed to the blockage of the pores of AC electrode and increasing in the contact resistance between AC and TNFs compared to ACTNF 10 wt%. Fig. 5B displays CV curves of ACTNF 10% electrode at different scan rates in 1 M NaCl. As shown, gradual change from ideal rectangular shapes to oval shapes can be observed which can be attributed to the inherent resistivity of the salt solutions as well as the electrode polarization.47 Another interesting finding can be observed from Fig. 5C, with increasing concentration, the CV curve inclined to typical rectangular shape and the circulated area became wider indicating large amount of salt ions can be electrostatically adsorbed as well as high corresponding specific capacitance. It should be worthwhile noting that this result demonstrates an excellent reversible ion adsorption/desorption capability due to the uniform network distribution of TiO2 nanofibers between AC particles without cover the active pore site of AC.
image file: c4ra09948f-f5.tif
Fig. 5 (A) Cyclic voltammetry curves for the fabricated materials at a scan rate of 10 mV s−1 in 1 M NaCl concentration, (B) CV profiles of the ACTNF 10% at different scan rates in 1 M NaCl concentration and (C) comparison CV plot for the ACTNF 10% at a scan rate of 50 mV s−1 and NaCl concentrations of 0.1, 0.5 and 1 M.

The specific capacitances have been calculated from IV cycles based on eqn (1). It well known that, a lower scan rate is desirable for the electrosorption capacitance because of high accessibility to accumulate the ions on the electrode surface. Fig. 6A displays the corresponding specific capacitance plot for the synthesized electrode materials versus scan rates. Obviously, the ACTNF 10% revealed a significant increase compared to the other fabricated electrodes. Typically, at 10 mV s−1 scan rate, the specific capacitances are determined to be 219, 349.6, 380 and 111 F g−1 for AC, ACTNF 5%, 10% and 15%, respectively (Fig. S2 in ESI). Herein, the optimum ratio for TNFs intercalated into AC hybrid CDI electrode is 10 wt%. Although the overloading of the incorporated TNFs into AC electrode can enhance the surface wettability based on hydrophilicity of TiO2, it has negative impact on electrochemical capacitance behavior due to increase the internal resistance.48 Based on hydrophilicity of TiO2, increasing of TiO2 content on AC leads to enhance the wettability behavior of composite electrode. Although TiO2 itself has very low capacitance, incorporating of TiO2 into carbon materials can enhance the capacitance of the composite due to the interaction between carbon and TiO2 and surface polarization. On the other hand, with increasing of the TiO2 content in composite, the electrochemical capacitance decreased due to the following phenomena: (i) the further decrease in polarization, and (ii) increase of the contact resistance between AC and TiO2.


image file: c4ra09948f-f6.tif
Fig. 6 (A) Specific capacitances for the prepared materials in 1 M NaCl solution at different sweep rates and capacitance retention of the ACTNF 10% electrode, the inset is comparative CV (B).

Cycle lifetime of the ACTNFs 10% as active material was examined at scan rate of 50 mV s−1 for 50 cycles and the capacitance retention was calculated for each cycle as shown in Fig. 6B. Obviously, neglected decrease in the electrochemical capacitance can be observed as the capacitance retention maintained at ∼98.9% over 50 successive cycles which evidenced their excellent cycle stabilities.

3.4. Desalination performance and electrosorption capacity

Single pass mode experiments were conducted in NaCl aqueous solution during adsorption and desorption process, the electrosorption behavior of the fabricated ACTNF 10% networks and AC electrodes were studied under various conditions. The typical condition of desalination experiment was conducted in NaCl solution with an initial conductivity ∼560 μS cm−1 and 20 mL min−1 as flow rate. The change in conductivity of effluent during adsorption/desorption process under cell potential of 1.2 V was depicted in Fig. 7A. Obviously, a sharp decrease in the conductivity reflects significant variation in the NaCl concentration during charge step corresponding to the ability of the introduced material towards ionic adsorption process in CDI cell. With time going, the rate of the adsorption of ions represented in conductivity curve becomes slowly because of saturation of the adsorption capacity of the electrode.49 As shown in the figure, the ACTNF 10% network electrode declined the conductivity from 560 to 58 μS cm−1 however it decreased from 560 to 272 μS cm−1 in case of utilizing pristine AC electrode reflects noticeable improvement in desalination efficiency during the CDI process under same condition. It is worth mentioning, the sharp increase in conductivity at desorption stage corresponds to the expulsion of ions adsorbed at reverse current under 0 V. This indicates that desorption proceeded of ACTNF 10% electrode is faster and easier than pristine AC. This excellent deionization capacity for the ACTNF 10% electrode can be attributed to decreasing the electric polarization of the AC and increasing the wettability by anchoring of TiO2. Moreover, designed of TiO2 nanofiber structure provides rapid and easily adsorption of the ions through intra-channel pathway on electrode surface.
image file: c4ra09948f-f7.tif
Fig. 7 (A) Desalination performance and (B) regeneration plot for the ACTNF 10% hybrid networks electrode and pristine AC under cell potential of 1.2 V in 5 mM NaCl solution with flow rate of 20 mL min−1.

Regeneration behavior is the most important factor for evaluating the cost and lifetime efficiency of the CDI electrode. Fig. 7B displays successive adsorption/desorption processes for AC and the modified ACTNF 10% hybrid electrode. Apparently, the ACTNF 10% demonstrated high stability of adsorption capacity during four consecutive cycles. Moreover, a great similarity in the cycle's profiles can be observed which indicates full regeneration during the adsorption processes. Generally, the applied voltage is the key factor to the CDI efficiency. Consequently, the desalination performance for the ACTNF 10% electrodes under different cell potentials from 0.8 to 2.0 V were investigated. As shown in Fig. 8A, the CDI profile for multi consecutive cycles versus applied potential confirmed an increase in the desalination performance. By applying eqn (2) and (3), the salt removal efficiency and electrosorptive capacity were calculated and plotted versus the applied voltages in Fig. 8B. Typically, the adsorption capacity of both electrode increases with increasing the applied voltage. However, The ACTNF 10% demonstrated significant outweigh on AC pure electrode under all applied voltages. Influence of NaCl concentration as an important indication to evaluate full performance of CDI electrode materials was also studied. Fig. 9 displays the salt removal efficiency and electrosorption capacity for proposed electrodes during CDI process as a function of NaCl concentration solution. The decline in desalination ratio can be attributed to the saturation of electrode surface with increasing the initial NaCl concentration. Interestingly, the ACTNFs 10% electrode achieved 143% increase in the desalination ratio; more than double times of electrosorption capacity at 1200 mg L−1 initial NaCl concentration compared to pure AC. Based on all of the foregoing results, the ACTNF 10% networks electrode has significantly outweigh throughout CDI measurements compared to original AC. It should be noted that, the salt removal efficiency and electrosorption capacity of the TiO2 nanofibers intercalated into AC to form ACTNF 10% networks electrode outperforms most efficient titania-doped AC CDI electrode which were recently reported are summarized in Table 1 for comparison; as shown the introduced electrode is superior.


image file: c4ra09948f-f8.tif
Fig. 8 (A) CDI profile versus cell potential and (B) electrosorption capacity of the pristine AC and ACTNF 10% networks electrode under different cell potential.

image file: c4ra09948f-f9.tif
Fig. 9 Salt removal efficiency and electrosorption capacity for the pristine AC and ACTNF 10% hybrid electrode in different initial concentration under applied voltage of 1.2 V.
Table 1 Comparison of desalination performances for different AC/TiO2 recently published CDI electrode. SP: single-pass; BM: batch model
Materials Initial NaCl concentration (mg L−1) Cell voltage (V) Electrosorption capacity (mg per gcarbon) Salt removal efficiency% Operational mode Reference
TiO2 NPs/AC 100 1.2 ∼8.04 13% BM CDI 37
TiO2/AC 500 2 ∼4.75 58% BM CDI 50
TiO2/AC 500 1.3 3.8 30% BM CDI 51
AC/TiO2 spray ∼584 1.2 17 35% SP CDI 38
AC/TiO2 NPs 500 1.2 ∼2.7 BM CDI 52
AC/TiO2 NPs 1000 1.2 ∼3.1 BM CDI 52
ACTNF 10% 292 1.2 17.7 89.6% SP CDI The present work
ACTNF 10% 584 1.2 19.26 80% SP CDI The present work
ACTNF 10% 876 1.2 21.73 73.5% SP CDI The present work


4. Conclusion

Hybrid networks CDI electrode can be fabricated by intercalating TiO2 nanofibers into AC. Compared to surface modification methods of AC, the incorporating of TiO2 nanofibers structured into AC submitted a remarkable increase for the desalination performance. The distinct performance can be attributed to unique designed of the nanofibrous morphology that avoids blocking pores surface of AC and open interfacial pathway between AC particles to increase the adsorption rate of ions from salt solution to electrode surface. Additionally, the amount of incorporated TiO2 should be optimized to achieve the highest desalination efficiency; 10 wt% is the recommended percentage. The proposed ACTNF 10% network electrode has a good surface wettability, superiority in electrochemical behaviour, excellent desalination efficiency moreover complete regeneration. Hence, the introduced ACTNF 10% can be successfully utilized as electrodes in capacitive deionization system.

Acknowledgements

The Authors extend their appreciation to the Deanship of Scientific Research at King Saud University for funding the work through the research group project no. IRG14-11.

References

  1. M. A. Shannon, P. W. Bohn, M. Elimelech, J. G. Georgiadis, B. J. Mariñas and A. M. Mayes, Nature, 2008, 452, 301–310 CrossRef CAS PubMed.
  2. M. Schiffler, Desalination, 2004, 165, 1–9 CAS.
  3. M. Elimelech and W. A. Phillip, Science, 2011, 333, 712–717 CrossRef CAS PubMed.
  4. T. Hillie and M. Hlophe, Nat. Nanotechnol., 2007, 2, 663–664 CrossRef CAS PubMed.
  5. S. Porada, R. Zhao, A. Van Der Wal, V. Presser and P. Biesheuvel, Prog. Mater. Sci., 2013, 58, 1388–1442 CrossRef CAS PubMed.
  6. T. Welgemoed and C. Schutte, Desalination, 2005, 183, 327–340 CrossRef CAS PubMed.
  7. Y. Oren, Desalination, 2008, 228, 10–29 CrossRef CAS PubMed.
  8. O. N. Demirer, R. M. Naylor, C. A. Rios Perez, E. Wilkes and C. Hidrovo, Desalination, 2013, 314, 130–138 CrossRef CAS PubMed.
  9. M. A. Anderson, A. L. Cudero and J. Palma, Electrochim. Acta, 2010, 55, 3845–3856 CrossRef CAS PubMed.
  10. F. A. AlMarzooqi, A. A. Al Ghaferi, I. Saadat and N. Hilal, Desalination, 2014, 342, 3–15 CrossRef CAS PubMed.
  11. C. A. R. Perez, O. N. Demirer, R. L. Clifton, R. M. Naylor and C. H. Hidrovo, J. Electrochem. Soc., 2013, 160, E13–E21 CrossRef CAS PubMed.
  12. B. P. Jia and L. D. Zou, Chem. Phys. Lett., 2012, 548, 23–28 CrossRef CAS PubMed.
  13. W. Huang, Y. Zhang, S. Bao and S. Song, Surf. Rev. Lett., 2013, 20, 1330003 CrossRef.
  14. J. C. Farmer, D. V. Fix, G. V. Mack, R. W. Pekala and J. F. Poco, J. Electrochem. Soc., 1996, 143, 159–169 CrossRef CAS PubMed.
  15. C. Tsouris, R. Mayes, J. Kiggans, K. Sharma, S. Yiacoumi, D. DePaoli and S. Dai, Environ. Sci. Technol., 2011, 45, 10243–10249 CrossRef CAS PubMed.
  16. S. Porada, L. Weinstein, R. Dash, A. Van der Wal, M. Bryjak, Y. Gogotsi and P. Biesheuvel, ACS Appl. Mater. Interfaces, 2012, 4, 1194–1199 CAS.
  17. Z. Peng, D. Zhang, L. Shi, T. Yan, S. Yuan, H. Li, R. Gao and J. Fang, J. Phys. Chem. C, 2011, 115, 17068–17076 CAS.
  18. J. Yang and L. Zou, Microporous Mesoporous Mater., 2014, 183, 91–98 CrossRef CAS PubMed.
  19. A. El Deen, K. Khalil, N. Barakat and K. H. Yong, J. Mater. Chem. A, 2013, 1, 11001–11010 CAS.
  20. A. G. El-Deen, N. A. Barakat, K. A. Khalil and H. Y. Kim, New J. Chem., 2014, 38, 198–205 RSC.
  21. Q. Dong, G. Wang, B. Qian, C. Hu, Y. Wang and J. Qiu, Electrochim. Acta, 2014, 137, 388–394 CrossRef CAS PubMed.
  22. Y. Liu, H. Li, C. Nie, L. Pan and Z. Sun, Desalin. Water Treat., 2013, 1–7 CrossRef.
  23. D. S. Zhang, T. T. Yan, L. Y. Shi, Z. Peng, X. R. Wen and J. P. Zhang, J. Mater. Chem., 2012, 22, 14696–14704 RSC.
  24. Z. Peng, D. Zhang, T. Yan, J. Zhang and L. Shi, Appl. Surf. Sci., 2013, 282, 965–973 CrossRef CAS PubMed.
  25. A. G. El-Deen, N. A. M. Barakat and H. Y. Kim, Desalination, 2014, 344, 289–298 CrossRef CAS PubMed.
  26. H. Li, L. Zou, L. Pan and Z. Sun, Environ. Sci. Technol., 2010, 44, 8692–8697 CrossRef CAS PubMed.
  27. X. Wen, D. Zhang, T. Yan, J. Zhang and L. Shi, J. Mater. Chem. A, 2013, 1, 12334–12344 CAS.
  28. X. Wen, D. Zhang, L. Shi, T. Yan, H. Wang and J. Zhang, J. Mater. Chem., 2012, 22, 23835–23844 RSC.
  29. H. Li, S. Liang, J. Li and L. He, J. Mater. Chem. A, 2013, 1, 6335–6341 CAS.
  30. A. G. El-Deen, N. A. Barakat, K. A. Khalil, M. Motlak and H. Yong Kim, Ceram. Int., 2014, 14627–14634 CrossRef CAS PubMed.
  31. L. Zou, G. Morris and D. Qi, Desalination, 2008, 225, 329–340 CrossRef CAS PubMed.
  32. D. Qu, J. Power Sources, 2002, 109, 403–411 CrossRef CAS.
  33. M. Andelman, J. Chem. Eng. Mater. Sci., 2014, 2, 2327–6053 Search PubMed.
  34. M. D. Andelman, Google Patents, 2012129532, 2012.
  35. L. Lu, Y. Zhu, F. Li, W. Zhuang, K. Y. Chan and X. Lu, J. Mater. Chem., 2010, 20, 7645–7651 RSC.
  36. M.-K. Seo and S.-J. Park, Curr. Appl. Phys., 2010, 10, 391–394 CrossRef PubMed.
  37. P.-I. Liu, L.-C. Chung, H. Shao, T.-M. Liang, R.-Y. Horng, C.-C. M. Ma and M.-C. Chang, Electrochim. Acta, 2013, 96, 173–179 CrossRef CAS PubMed.
  38. C. Kim, J. Lee, S. Kim and J. Yoon, Desalination, 2014, 342, 70–74 CrossRef CAS PubMed.
  39. M. Motlak, M. S. Akhtar, N. A. Barakat, A. Hamza, O. Yang and H. Y. Kim, Electrochim. Acta, 2014, 115, 493–498 CrossRef CAS PubMed.
  40. X. Ning, W. Zhong, S. Li, Y. Wang and W. Yang, J. Mater. Chem. A, 2014, 2, 8859–8867 CAS.
  41. N. A. Barakat, A. G. El-Deen, G. Shin, M. Park and H. Y. Kim, Mater. Lett., 2013, 99, 168–171 CrossRef CAS PubMed.
  42. J.-H. Lee, W.-S. Bae and J.-H. Choi, Desalination, 2010, 258, 159–163 CrossRef CAS PubMed.
  43. L. Li, L. Zou, H. Song and G. Morris, Carbon, 2009, 47, 775–781 CrossRef CAS PubMed.
  44. Y.-J. Kim and J.-H. Choi, Water Res., 2010, 44, 990–996 CrossRef CAS PubMed.
  45. Z.-M. Huang, Y.-Z. Zhang, M. Kotaki and S. Ramakrishna, Compos. Sci. Technol., 2003, 63, 2223–2253 CrossRef CAS.
  46. G. Wang, L. Zhang and J. Zhang, Chem. Soc. Rev., 2012, 41, 797–828 RSC.
  47. H. Wang, D. Zhang, T. Yan, X. Wen, L. Shi and J. Zhang, J. Mater. Chem., 2012, 22, 23745–23748 RSC.
  48. H. Liang, F. Chen, R. Li, L. Wang and Z. Deng, Electrochim. Acta, 2004, 49, 3463–3467 CrossRef CAS PubMed.
  49. B. Jia and L. Zou, Carbon, 2012, 50, 2315–2321 CrossRef CAS PubMed.
  50. L. Zou, L. Li, H. Song and G. Morris, Water Res., 2008, 42, 2340–2348 CrossRef CAS PubMed.
  51. H.-I. K. Jeong-Won Lee, H.-J. Kim and S.-G. Park, Appl. Chem. Eng., 2010, 21, 265–271 Search PubMed.
  52. H. Yin, S. Zhao, J. Wan, H. Tang, L. Chang, L. He, H. Zhao, Y. Gao and Z. Tang, Adv. Mater., 2013, 25, 6270–6276 CrossRef CAS PubMed.

Footnote

Electronic supplementary information (ESI) available. See DOI: 10.1039/c4ra09948f

This journal is © The Royal Society of Chemistry 2014