Novel magnetic multi-template molecularly imprinted polymers for specific separation and determination of three endocrine disrupting compounds simultaneously in environmental water samples

Ruixia Gao*a, Yi Haoab, Siqi Zhaoa, Lili Zhangab, Xihui Cuiab, Dechun Liuc, Yuhai Tang*ab and Yuansuo Zhenga
aInstitute of Analytical Science, School of Science, Xi'an Jiaotong University, Xi'an 710049, China. E-mail: ruixiagao@mail.xjtu.edu.cn; Fax: +86 29 82655399; Tel: +86 29 82655399
bCollege of Pharmacy, Xi'an Jiaotong University, Xi'an 710061, China. E-mail: tyh57@mail.xjtu.edu.cn
cDepartment of Hepatobiliary Surgery, First Hospital of Xi'an Jiaotong University, Xi'an 710061, China

Received 5th September 2014 , Accepted 27th October 2014

First published on 27th October 2014


Abstract

In order to improve the practical applied value of molecularly imprinted polymers, a novel concept of multiple templates was introduced to prepare an original type of magnetic molecularly imprinted polymers. The magnetic multi-template molecularly imprinted polymers were obtained by selecting silica-coated magnetic nanoparticles as supporters, three endocrine disrupting compounds (17β-estradiol (E2), estriol (E3), and diethylstilbestrol (DES)) as the multi-template, and two kinds of silane coupling agents (3-aminopropyltriethoxysilane (APTES) and phenyltrimethoxysilane (PTMOS)) as bifunctional monomers for simultaneously specific recognition of E2, E3, and DES. The as-synthesized polymers possessed homogeneous imprinting shells, stable crystalline phase, and super-paramagnetic properties. Meanwhile, the imprinted nanomaterials displayed not only extraordinarily fast kinetics, but also satisfactory adsorption capacity, as well as favorable selectivity. More importantly, the prepared polymers exhibited a similar recognition performance to a physical mixture of three single-template polymers, but the synthetic procedure of the former was simplified with significant reduction in both preparation time and solvent consumption. In addition, the imprinted nanoparticles were applied as a specific adsorbent coupled with HPLC-UV for rapid isolation and determination of E2, E3, and DES simultaneously. The limits of detection (LODs) of proposed method for three target estrogens of E2, E3, and DES were 0.27, 0.19, and 0.08 ng mL−1, respectively, which were lower than that obtained by some other sample pretreatment methods followed by HPLC-UV analysis. Furthermore, the developed method was successfully applied for detection of multiple aimed estrogens in environmental water samples with satisfactory recoveries in the range of 92.3–98.6%.

Introduction

Endocrine disrupting compounds (EDCs) are recognized as a diverse group of substances that interfere with central regulatory functions in human and wildlife by antagonizing or mimicking the effects of endogenous hormones.1–3 EDCs can bio-accumulate in the food chain and disrupt the synthesis, secretion, transport, and elimination of natural hormones in the body of humans and animals.4,5 With the rapid development of human life, the use of cosmetics, contraceptives, and hormone replacement therapy drugs increases dramatically, which together with their metabolites and transformation products enter the human living environment, particularly the aquatic environment.6–8 There has been much evidence that the accumulation of the natural or synthetic EDCs may cause feminization of fish and many diseases such as breast and prostate cancers of humans.9,10 What's more, some works reported that EDCs could lead to slow development in infants and inferior quantity and quality of human sperm.11,12 Therefore, accurate and reliable analysis of EDCs in complex environmental matrices at low concentration levels is of importance for human health and reproduction. The most commonly used methods for the determination of EDCs are immunological methods13,14 and chromatography hyphenated technology including GC-MS15,16 and LC-MS.17,18 Immunological methods are usually highly selective for aimed compound but the instability and complicated production of natural antibodies limit their applications to some extent. Chromatography hyphenated methods can effectively detect estrogens, however, the complex pretreatment process is required and the routine sample preparation technique generally lacks selectivity.19 To solve these problems, several novel pretreatment approaches using molecularly imprinted polymers (MIPs) as an efficient alternative solid phase extractant for separation of EDCs have been established.20,21

MIPs are artificial polymers that possess specific recognition sites complementary to the shape, size, and functional groups of predetermined analyte molecule. The advantages of MIPs over natural receptors include ease of preparation, low cost, and high mechanical stability, which have led them to be applied in a variety of fields, such as chromatography,22 chemical sensors,23 catalysis,24 and solid-phase extraction.25 Among these applications, MIPs used as sorbents for the solid phase extraction procedure are of desirableness for the selective removal or determination of pollutants from matrix samples. When Fe3O4 magnetic nanoparticles act as nano-sized supporters, the resultant MIPs not only have strong special recognition and adsorption ability, but also can be easily removed from the adsorbed solution in the presence of an external magnetic field.26 Therefore, Fe3O4 magnetic nanoparticles have been introduced to combine with the surface imprinting technique.

Currently, most of the imprinted polymers were prepared involving single template, whose recognition sites only for one template molecule, and could not exhibit high affinity and selectivity for a family of analytes. For another, the detection of only one analyte in complex real samples is of little practical value. To address these problems and expand the applicability of MIPs, some MIPs using two or multiple templates were prepared to shorten analytical time and economize the cost.27,28 Although this purpose can also be achieved by physically mixing the individually imprinted polymer particles, this method requires for synthesizing several polymers and demands on much time. Though there were many publications reporting on the separation/enrichment of EDCs based on MIPs by using a single estrogen as template,29,30 to the best of our knowledge, magnetic multi-template molecularly imprinted polymers for simultaneous determination of three EDCs has not been reported.

In this work, we prepared magnetic multi-template molecularly imprinted polymers combining the merits of surface imprinting technique, sol–gel approach, and magnetic separation for simultaneously selective recognition E2, E3, and DES. The morphology and composition of the resulting products were characterized by TEM, FT-IR, VSM, and XRD. The obtained imprinted polymers exhibited fast kinetics, excellent specific recognition, and favorable selective affinity towards three templates, and also had satisfactory regeneration potential. The adsorption capabilities of the resulting polymers were also compared with the mixture of three imprinted polymers using E2, E3, and DES as single template respectively. The resultant imprinted nanomaterials were coupled with HPLC-UV for the determination of three EDCs using spiked environmental water samples at trace concentration levels.

Experimental

Chemicals and reagents

Tetraethoxysilane (TEOS), APTES, and PTMOS were purchased from Alfa Aesar Chemical Company. Ferric chloride hexahydrate (FeCl3·6H2O), anhydrous sodium acetate (NaOAc), ethylene glycol, ethanol, methanol, polyvinyl pyrrolidone (PVP), ammonium hydroxide (25%), and acetic acid were from Xi'an Chemicals Ltd. Estrone (E1), E2, E3, DES, bisphenol A (BPA), bisphenol F (BPF), and 17α-ethynylestradiol (EE2) (Fig. 1) were obtained from Sigma. The highly purified water (18.0 MΩ cm−1) was obtained from a WaterPro water system (Axlwater Corporation, TY10AXLC1805-2, China) and used throughout the experiments. Environmental water samples were collected from local lake and river and filtered through 0.22 μm filters, stored in precleaned glass bottles. All reagents used were of at least analytical grade.
image file: c4ra09825k-f1.tif
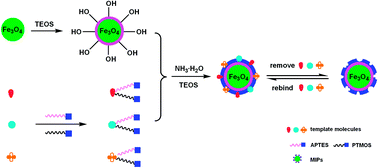
Fig. 1 Scheme of the synthetic route for Fe3O4@Multi-MIPs.

Instruments and HPLC analysis

A Tecnai G2 T2 S-TWIN transmission electron microscope and an SS-550 scanning electron microscopy (SEM) were used to examine TEM and SEM images of Fe3O4, Fe3O4@SiO2, and Fe3O4@Multi-MIPs. The infrared spectra were recorded with Nicolet AVATAR-330 Fourier transform infrared (FT-IR) spectrometer, the magnetic properties were measured with a vibrating sample magnetometer (VSM) (LDJ 9600-1, USA), and the crystalline phases were characterized by a Rigaku D/max/2500v/pc (Japan) X-ray diffractometer with a Cu Kα radiation.

The HPLC analyses were performed on a Hitachi L-2130 HPLC system including a binary pump and a variable wavelength UV detector. A Shimadzu VP-ODS C18 (5 μm particle size, 150 mm × 4.6 mm) analytical column was used for analyte separation. The mobile phase was methanol–H2O (60/40, v/v) delivered at a flow rate of 1.0 mL min−1. The injection volume was 20 μL, and the column effluent was monitored at 280 nm.

Synthesis of Fe3O4@Multi-MIPs and reference polymers

The monodispersed Fe3O4 and the silica-modified Fe3O4 (denoted as Fe3O4@SiO2) were prepared as our previous work.26 The multi-template imprinted polymers (denoted as Fe3O4@Multi-MIPs) were prepared via a sol–gel process. 30 mg of each E2, E3, and DES were dissolved in 20 mL of ethanol, and mixed with 100 μL of APTES and 100 μL of PTMOS. The mixture was stirred for 2 h to form template–monomer complex. Then, 0.2 g of Fe3O4@SiO2, 400 μL of TEOS, and 600 μL of ammonium hydroxide (25%) were added to the reaction mixture, which was allowed to proceed for 6 h. The obtained products were rinsed with highly purified water until the supernatant was neutral, and the mixture of methanol–HAc (95[thin space (1/6-em)]:[thin space (1/6-em)]5, v/v) was added as an eluent to remove the templates at room temperature. The resulting imprinted polymers were collected by an external magnetic field and repeatedly washed with highly purified water, and then dried under vacuum. In parallel, Fe3O4@E2-MIPs, Fe3O4@E3-MIPs, Fe3O4@DES-MIPs, and Fe3O4@NIPs were prepared by the same procedure with adding the template E2, E3, DES, and in the absence of the template EDCs, respectively.

Binding experiments of Fe3O4@Multi-MIPs and Fe3O4@NIPs

To investigate the adsorption kinetics of the obtained imprinted polymers, 20 mg of Fe3O4@Multi-MIPs and Fe3O4@NIPs were mixed with 10 mL of ethanol solution of three EDCs at a concentration of 30 μg mL−1, and the mixture was incubated at regular time intervals from 1 min to 6 min at room temperature. Then, the polymers were separated by a magnet and the concentrations of three EDCs in the supernatant were determined by HPLC-UV. The adsorption capacity (Q, mg g−1) for three EDCs bound to the imprinted polymers was calculated as following equation:
 
image file: c4ra09825k-t1.tif(1)
where C0 and C1 (μg mL−1) represent the initial and the free solution concentration of EDCs, respectively. V (mL) represents the volume of the solution and W (mg) represents the weight of the polymer.

To determine the isothermal adsorption capacity of the adsorbents, 20 mg of Fe3O4@Multi-MIPs and Fe3O4@NIPs were added to 10 mL of ethanol solution at varied initial concentration (0.50–50 μg mL−1) of three EDCs. Then, the Fe3O4@Multi-MIPs were isolated by a magnet and three EDCs residues in the supernatant were determined by HPLC-UV.

To evaluate the specific recognition of the imprinted nanomaterials, 10 mL of mixed standard solution of E2, E3, DES, E1, EE2, BPA, and BPF at initial concentration of 30 μg mL−1 was incubated with 20 mg Fe3O4@Multi-MIPs or Fe3O4@NIPs for 4 min, then the separation and detection procedures were conducted as described earlier in the isothermal adsorption experiment.

Recognition performance of Fe3O4@Multi-MIPs and reference polymers

To compare the templates recognition of Fe3O4@Multi-MIPs with reference polymers (Fe3O4@NIPs, Fe3O4@E2-MIPs, Fe3O4@E3-MIPs, Fe3O4@DES-MIPs, and the Fe3O4@E2-MIPs–Fe3O4@E3-MIPs–Fe3O4@DES-MIPs (1[thin space (1/6-em)]:[thin space (1/6-em)]1[thin space (1/6-em)]:[thin space (1/6-em)]1, w/w/w) mixture (denoted as M-MIPs)), 20 mg of Fe3O4@Multi-MIPs and reference polymers were incubated with the mixture of E2, E3, and DES respectively at a concentration of 30 μg mL−1 in 10 mL of ethanol at room temperature for 4 min. Then the extraction and detection procedures were conducted as described earlier adsorption experiment.

Reproducibility and reusability of Fe3O4@Multi-MIPs and Fe3O4@NIPs

20 mg of six batches of Fe3O4@Multi-MIPs and Fe3O4@NIPs prepared on different days were added to the solution of three EDCs in 10 mL of ethanol at a concentration of 30 μg mL−1 to investigate their reproducibility. After incubation for 4 min at room temperature, the supernatants and polymers were separated by a magnetic field and the bound amounts of three EDCs were measured by HPLC-UV.

To estimate the reusability of Fe3O4@Multi-MIPs and Fe3O4@NIPs, 20 mg of polymers were added to the solution of three EDCs in 10 mL of ethanol at a concentration of 30 μg mL−1 and incubated at room temperature for 4 min. Then, Fe3O4@Multi-MIPs and Fe3O4@NIPs were removed by a magnet and the bound amounts of three EDCs were quantified by HPLC. The recovered Fe3O4@Multi-MIPs and Fe3O4@NIPs were washed with a mixture of methanol–HAc (95[thin space (1/6-em)]:[thin space (1/6-em)]5, v/v) till we ensured complete removal of residual three EDCs in the polymers and washed with highly purified water for several times, then dried under vacuum at 40 °C, and then reused in succeeding adsorption–desorption cycles.

Analysis of three EDCs in environmental water samples

The lake and river water samples collected from the Xing Qing Park and Weihe River (Xi'an, China) were spiked with E2, E3, and DES at three levels (0.5, 1.0, and 3.0 ng mL−1). Then, the samples were filtered by 0.22 μm membrane filters without any other pretreatment and stored in the precleaned glass bottles at room temperature until they were analyzed. 100 mg of Fe3O4@Multi-MIPs or Fe3O4@NIPs were added to 100 mL of the lake and river water samples containing the three EDCs, respectively. After 4 minutes of incubation on an oscillator, the Fe3O4@Multi-MIPs or Fe3O4@NIPs were isolated by a magnet and the supernatant solution was discarded. The Fe3O4@Multi-MIPs or Fe3O4@NIPs which absorbed target molecules were eluted with a mixture of methanol–HAc (95[thin space (1/6-em)]:[thin space (1/6-em)]5, v/v) solution, and then the elution was collected and evaporated to dry under a stream of nitrogen. Finally, the residue of the elution was dissolved in 0.5 mL of methanol and measured by HPLC-UV.

Results and discussion

Synthesis of Fe3O4@Multi-MIPs

The general scheme for the synthesis of multi-template imprinted magnetic nanomaterials based on surface imprinting technique, sol–gel process, and magnetic supporter was illustrated in Fig. 1. The formation of the Fe3O4@Multi-MIPs included four major procedures: (1) Fe3O4 NPs were synthesized by a modified solvothermal method, and whose surfaces were transformed to silica shells using TEOS through a sol–gel process. (2) The template–monomer complex was obtained with E2, E3, and DES as multi-templates, APTES and PTMOS as bifunctional monomers. (3) The templates–monomers complex was anchored on the surface of Fe3O4@SiO2 using ammonium hydroxide as the catalyst through another sol–gel process. (4) A thin MIP layer which had specific recognition cavities for E2, E3, and DES was formed after the removal of the multiple templates.

The molecular recognition capability of Fe3O4@Multi-MIPs is greatly affected by the functional monomers which can create the molecular recognition sites through interacting with the template molecules and maintain their shape, size, and location of functionalities in the polymer network after the templates are removed. In this study, two kinds of silane coupling agents as co-monomers were selected to produce the imprinted binding sites according to the structures and features of E2, E3, and DES (Fig. 2). One is APTES which can form hydrogen bonds between its amino groups and hydroxyl groups of the templates. The other is PTMOS which can establish π–π interactions with the templates via the phenyl groups of the two.


image file: c4ra09825k-f2.tif
Fig. 2 Molecular structures of EDCs used in this study.

The effect of the volume ratios of APTES and PTMOS on the imprinting performance of Fe3O4@Multi-MIPs and Fe3O4@NIPs was investigated. As shown in Table 1, we found that the recognition ability of Fe3O4@Multi-MIPs towards E3/DES was more susceptible to the volume ratio of APTES/PTMOS. When inspecting the structures of E3 and DES, E3 possesses three –OH, which could have better ability than other two templates to form multiple hydrogen bonds with the –NH2 of APTES, while DES holds two phenyl groups and may have stronger capacity to establish π–π interactions with PTMOS. We found that the volume ratio of APTES and PTMOS was 1[thin space (1/6-em)]:[thin space (1/6-em)]1 which had the best adsorption ability to all three templates, not only in adsorption capacity (Q), but also in imprinting factor (IF). This might result from the coordinate effect of hydrogen bonds and π–π interactions which might achieve to the best condition between functional monomers and the template molecules when APTES and PTMOS were in the same volume. Therefore, the optimized volume ratio of APTES to PTMOS was confirmed as 1[thin space (1/6-em)]:[thin space (1/6-em)]1.

Table 1 Effect of volume ratios and amounts of functional monomers on the imprinting performance of Fe3O4@Multi-MIPs and Fe3O4@NIPsa
  Analytes QMIP (mg g−1) QNIP (mg g−1) IF
a In this experiment, 20 mg of Fe3O4@Multi-MIPs and Fe3O4@NIPs were incubated with the mixture of E2, E3, and DES at a concentration of 30 μg mL−1 in 10 mL of ethanol for 4 min at room temperature.
VAPTES/VPTMOS
1[thin space (1/6-em)]:[thin space (1/6-em)]0 E2 2.16 0.99 2.18
E3 4.29 1.03 4.16
DES 2.63 0.87 3.02
0[thin space (1/6-em)]:[thin space (1/6-em)]1 E2 1.76 0.73 2.41
E3 3.89 1.35 2.88
DES 4.96 2.87 1.72
1[thin space (1/6-em)]:[thin space (1/6-em)]2 E2 1.91 0.89 2.15
E3 3.64 1.05 3.47
DES 5.42 2.16 2.51
1[thin space (1/6-em)]:[thin space (1/6-em)]1 E2 3.45 0.91 3.79
E3 5.76 1.12 5.14
DES 6.44 2.21 2.91
2[thin space (1/6-em)]:[thin space (1/6-em)]1 E2 2.54 0.87 2.92
E3 4.58 1.08 4.24
DES 4.67 2.19 2.13
[thin space (1/6-em)]
VAPTES/PTMOS (μL)
50 E2 2.08 0.83 2.51
E3 3.57 1.01 3.53
DES 5.08 1.89 2.69
75 E2 2.76 0.87 3.17
E3 4.89 1.08 4.53
DES 5.72 1.97 2.90
100 E2 3.45 0.91 3.79
E3 5.76 1.12 5.14
DES 6.44 2.21 2.91
125 E2 2.83 0.89 3.18
E3 4.65 1.06 4.39
DES 5.91 2.15 2.75
150 E2 2.41 0.92 2.62
E3 4.22 1.09 3.87
DES 5.24 2.17 2.41


To achieve a satisfactory recognition quality, the binding performance of Fe3O4@Multi-MIPs and Fe3O4@NIPs with different amounts of functional monomers ranging from 50 μL to 150 μL was evaluated and listed in Table 1. It was observed obviously that the Q and IF increased as the amounts of functional monomers increased from 50 μL to 100 μL, due to the augment of the amounts of the recognition cavities on the thin MIP layers. However, a decrease of Q and IF was appeared with the increasing of the amounts of functional monomers from 100 μL to 150 μL, because agglomeration of the functional monomers would happen if whose amount was excess, and led to a reduction in the number of recognition cavities. The experimental results revealed that 100 μL of APTES and 100 μL of PTMOS were appropriate in this work.

Characterization of prepared nanomaterials

The morphology of Fe3O4, Fe3O4@SiO2, and Fe3O4@Multi-MIPs was characterized by SEM (Fig. S1) and TEM. As shown in Fig. 3A, the uncoated Fe3O4 nanoparticles were relatively homogeneous and well-dispersed with a mean diameter of about 200 nm. After coating with a thin SiO2 shell, the diameter of Fe3O4@SiO2 increased to about 240 nm (Fig. 3B), corresponding to a 10 nm thick SiO2 layer covered on Fe3O4. The SiO2 shell was uniformly coated on Fe3O4 magnetic core for all the samples, which could prevent oxidation of magnetic core and provide a biocompatible and hydrophilic surface. In addition, some interesting functionalities could be simply linked to the surface of Fe3O4@SiO2 through sol–gel reactions. The images in Fig. 3C displayed the formation of core–shell structured Fe3O4@Multi-MIPs after the template–monomer complex was anchored on the surface of Fe3O4@SiO2 via another sol–gel process under the optimized synthetic conditions. The SEM image (Fig. S1C) revealed a relatively uniform size distribution and the shell of as-prepared product was thicken to 15 nm appeared in TEM image (Fig. 3C), indicating that a MIP layer with thickness of about 5 nm was attached on the Fe3O4@SiO2 successfully. The thin MIP layers would be effective to the mass transport between solution and the surface of Fe3O4@Multi-MIPs.
image file: c4ra09825k-f3.tif
Fig. 3 TEM images of Fe3O4 (A), Fe3O4@SiO2 (B), and Fe3O4@Multi-MIPs (C).

The EDS analysis was also conducted to confirm the existence of imprinted polymer. For the Fe3O4, only Fe and O signals appeared, in accordance with its elemental composition (Fig. S2A). The signal of Si emerged and percentage of each element changed greatly after coating with SiO2 (Fig. S2B). The emergence of the signal of N in Fig. S2C provided additional evidence for the formation of imprinted shell on the surface of Fe3O4@SiO2.

The FT-IR spectra provided a direct proof for synthetic process of Fe3O4@Multi-MIPs. The characteristic peaks of the stretch of Fe–O group for Fe3O4, Fe3O4@SiO2, and Fe3O4@Multi-MIPs were all observed around 580 cm−1 (Fig. 4). The absorption peaks at 3442 cm−1 and 1640 cm−1 were assigned to stretching vibration and bending vibration of O–H (Fig. 4A), suggesting hydroxyl groups on the surface of Fe3O4.31 In comparison with the curve of pure Fe3O4, a strong peak at approximately 1100 cm−1 attributed to the stretching vibration of Si–O–Si could be observed in the curve of Fe3O4@SiO2 (Fig. 4B), which indicated the formation of silica film on the surface of Fe3O4. The typical peak at 3442 cm−1 arising from N–H stretching vibration might overlap with that of O–H stretching vibration,32 but the relatively high intensity of the peak and bending vibration of N–H at 1562 cm−1 still revealed the contribution of –NH2 groups. The absorbance at 1430 cm−1 was ascribed to the stretch of Si–C6H5 (Fig. 4C). The existence of these characteristic peaks derived from APTES and PTMOS proved that the MIP layer was successfully coated on Fe3O4@SiO2.


image file: c4ra09825k-f4.tif
Fig. 4 FT-IR spectra of Fe3O4 (A), Fe3O4@SiO2 (B), and Fe3O4@Multi-MIPs (C).

The X-ray diffraction (XRD) patterns of Fe3O4, Fe3O4@SiO2, and Fe3O4@Multi-MIPs were displayed in Fig. 5. In the 2θ range of 10–80°, six representative peaks of Fe3O4 (2θ = 30.38°, 35.58°, 43.14°, 53.48°, 57.08°, and 62.66°) were detected for the three samples. The peak positions at the corresponding 2θ values were indexed as (220), (311), (400), (422), (511), and (440), respectively, which matched well with the database of magnetite in the JCPDS-International Center for Diffraction Data (JCPDS card: 19-629) file. The XRD patterns showed that the synthetic nanoparticles were highly crystalline materials and the crystalline of magnetite remained unchanged during the preparation of Fe3O4@Multi-MIPs.


image file: c4ra09825k-f5.tif
Fig. 5 XRD patterns of Fe3O4 (A), Fe3O4@SiO2 (B), and Fe3O4@Multi-MIPs (C).

The magnetic properties of Fe3O4, Fe3O4@SiO2, and Fe3O4@Multi-MIPs were studied using a vibrating sample magnetometer at room temperature, and the plots of magnetization versus magnetic field (M − H loop) were illustrated in Fig. 6A. The remanent magnetizations of Fe3O4, Fe3O4@SiO2, and Fe3O4@Multi-MIPs were close to zero, suggesting that the three samples were all superparamagnetic. The saturation magnetization of Fe3O4@SiO2/Fe3O4@Multi-MIPs was reduced to 55.99/50.15 emu g−1 in comparison with 61.51 emu g−1 of Fe3O4. The decrease in magnetic saturation of Fe3O4@SiO2/Fe3O4@Multi-MIPs might be attributed to the increased mass of modified silane/MIP shells on the surface of Fe3O4/Fe3O4@SiO2. The two reduced saturation magnetization values were all about 5 emu g−1, which was rather small, demonstrating that the modified silane/MIP layers on the surface of Fe3O4/Fe3O4@SiO2 were quite thin. The thin MIP shells would be effective to adsorb and desorb template molecules between solution and Fe3O4@Multi-MIPs. Fig. 6B displayed the separation and redispersion process of Fe3O4@Multi-MIPs. The Fe3O4@Multi-MIPs can be attracted to the wall of the vial rapidly, and the dispersion became clear and transparent within several seconds in the presence of an external magnetic field. When the external magnetic field was absent, a dark homogeneous dispersion could be observed. The superparamagnetism of Fe3O4@Multi-MIPs prevented the polymers from aggregating and enabled rapid redispersion after the magnetic field was taken away, which was very useful for their application.


image file: c4ra09825k-f6.tif
Fig. 6 Magnetization curves of Fe3O4, Fe3O4@SiO2, and Fe3O4@Multi-MIPs (A); the separation and redispersion of a solution of Fe3O4@Multi-MIPs in the absence (left) and presence (right) of an external magnetic field (B).

Adsorption kinetics of Fe3O4@Multi-MIPs and Fe3O4@NIPs

The adsorption kinetics of E2, E3, and DES onto Fe3O4@Multi-MIPs and Fe3O4@NIPs were investigated. As presented in Fig. 7A, the imprinted nanomaterials displayed a fast adsorption rate. The adsorption capacity increased rapidly in the first 3 min and almost reached equilibrium after 4 min for all of three different templates. It took shorter time to reach adsorption saturation than that of some other surface imprinting technologies for EDCs,33,34 which demonstrated that three EDCs approached the surface imprinting cavities of Fe3O4@Multi-MIPs easily. The thin and uniform MIP shells of Fe3O4@Multi-MIPs provided efficient mass transport, thus overcoming some drawbacks of traditionally packed imprinted materials35 and non-thin imprinted nanomaterials.36
image file: c4ra09825k-f7.tif
Fig. 7 Adsorption kinetics (A) and isotherms (B) of Fe3O4@Multi-MIPs and Fe3O4@NIPs to DES (a and a′), E3 (b and b′), and E2 (c and c′), respectively.

Adsorption isotherms of Fe3O4@Multi-MIPs and Fe3O4@NIPs

The isothermal adsorption of E2, E3, and DES onto Fe3O4@Multi-MIPs and Fe3O4@NIPs were evaluated in the initial concentration range of 0.50–50 μg mL−1, and the corresponding results were shown in Fig. 7B. It could be seen that the adsorption capacity of Fe3O4@Multi-MIPs increased rapidly along with the increase of initial concentration and reached adsorption saturation when the initial concentration was above 30 μg mL−1. The amounts of the three EDCs bound to Fe3O4@Multi-MIPs were higher than that of Fe3O4@NIPs at the same initial concentration, which suggested that the imprinted recognition cavities played important roles in the process of the three EDCs binding to Fe3O4@Multi-MIPs. To estimate the binding properties of the imprinted nanomaterials, the saturation binding data were further processed by the Langmuir equation, which was expressed as following equation:
 
image file: c4ra09825k-t2.tif(2)
where Qe (mg g−1) is the amount of template molecules bound to Fe3O4@Multi-MIPs at equilibrium, Qmax (mg g−1) is the apparent maximum adsorption capacity, Ce (μg mL−1) is the free analytical concentration at equilibrium, and KL (L mg−1) is the Langmuir constant. The values of KL and Qmax can be calculated from the slope and intercept of the linear plotted in Ce/Qe versus Ce.

Langmuir model fitted the equilibrium data rather well from the deduction of linear correlation which were greater than 0.99 (Table S1). From the slopes and intercepts of the straight lines obtained, the values of apparent maximum adsorption capacities of E2, E3, and DES were 3.74 mg g−1, 6.02 mg g−1, and 6.89 mg g−1 for Fe3O4@Multi-MIPs, and 0.99 mg g−1, 1.22 mg g−1, and 2.40 mg g−1 for Fe3O4@NIPs, which were close to the maximum amounts of adsorption obtained from experimental results (Fig. 7B). It can be concluded that the adsorption of E2, E3, and DES onto Fe3O4@Multi-MIPs and Fe3O4@NIPs might be all monolayer adsorption.37 Furthermore, the adsorption was occurred uniformly on the active binding sites of the surface of the resultant imprinted nanomaterials and no further adsorption could take place at the site once a template molecule occupied this site.36

Specific recognition of Fe3O4@Multi-MIPs and Fe3O4@NIPs

In order to measure the specificity of Fe3O4@Multi-MIPs and Fe3O4@NIPs to E2, E3, and DES, four other EDCs (E1, EE2, BPA, and BPF) were selected as analogues. The adsorption performance of Fe3O4@Multi-MIPs and Fe3O4@NIPs to the mixture of E2, E3, DES, E1, EE2, BPF, and BPA at a concentration of 30 μg mL−1 in 10 mL of ethanol was investigated.

The imprinting factor (IF) and selectivity coefficient (SC) were usually used to evaluate the specific recognition property of the imprinted materials towards template molecules and structurally related compounds. The IF and SC were calculated by the following formulas:

 
image file: c4ra09825k-t3.tif(3)
 
image file: c4ra09825k-t4.tif(4)
where QMIP and QNIP (mg g−1) represent the adsorption capacity of EDCs for Fe3O4@Multi-MIPs and Fe3O4@NIPs, IFt and IFa are the imprinting factors for templates and analogues.

As presented in Table 2, the Q and IF of E2, E3, and DES for Fe3O4@Multi-MIPs were higher than those of four other EDCs, indicating that Fe3O4@Multi-MIPs had a relatively higher affinity for the template molecules than their analogues. Although the structures of E1, EE2, BPA, and BPF all contain hydroxyl and phenyl functional groups (Fig. 2) which are capable of forming hydrogen bonding and π–π interaction with Fe3O4@Multi-MIPs, the imprinted nanomaterials still exhibited high recognition for the template molecules. This could be explained as that the template molecules were imprinted on the MIP layers during the preparation of Fe3O4@Multi-MIPs, after removal of the template molecules, the complementarity of cavities in MIP layers to the templates both in size and shape were established. Furthermore, we surprisingly found that the IF of E2, E3, and DES in the mixture of seven EDCs were higher than those in the mixture solution of three EDCs. This phenomenon was probably ascribed to the fact that EDCs competed with each other much more drastically in seven EDCs than in three EDCs mixture, which led to the decrease of adsorption of three EDCs in both Fe3O4@Multi-MIPs and Fe3O4@NIPs. However, since the specific recognition sites existed on the MIP layers were complementary in shape, size, and spatial arrangement to template molecules, the template molecules had advantage in occupying the binding sites over three other EDCs. The adsorption of seven EDCs on Fe3O4@NIPs was non-specific, so every EDCs had the equal opportunity to be adsorbed. This resulted in that the adsorption capacities of template molecules on Fe3O4@NIPs in the seven EDCs mixed solution were smaller than those of the Fe3O4@NIPs in the three EDCs mixed solution. Besides, the Fe3O4@Multi-MIPs exhibited higher specificity for templates when compared with duo-molecularly imprinted polymer prepared by Xia et al.27 These results demonstrated satisfactory imprinting efficiency of the present method.

Table 2 The adsorption capacities, imprinting factors, and selectivity coefficients of templates and analogues for Fe3O4@Multi-MIPs and Fe3O4@NIPsa
Analytes QMIP (mg g−1) QNIP (mg g−1) IF SC
SC1b SC2c SC3d
a In this experiment, 20 mg of Fe3O4@Multi-MIPs and Fe3O4@NIPs were incubated with the mixture of E2, E3, DES, E1, EE2, BPA, and BPF at a concentration of 30 μg mL−1 in 10 mL of ethanol for 4 min at room temperature.b SC1 = IFE2/IFa.c SC2 = IFE3/IFa.d SC3 = IFDES/IFa.
E2 2.98 0.93 3.20
E3 5.23 0.82 6.38
DES 5.97 1.05 5.69
E1 1.87 0.741 2.52 1.27 2.53 2.26
EE2 1.52 0.683 2.23 1.43 2.86 2.55
BPA 0.945 0.512 1.85 1.73 3.45 3.08
BPF 1.29 0.718 1.80 1.78 3.54 3.16


Reproducibility and reusability of Fe3O4@Multi-MIPs and Fe3O4@NIPs

The reproducibility of the obtained imprinted magnetic nanomaterials was investigated by using six batches of Fe3O4@Multi-MIPs and Fe3O4@NIPs prepared on different days. Five independent replicates were measured for each batch. The average adsorption capacity of the six batches of Fe3O4@Multi-MIPs and Fe3O4@NIPs for E2, E3, and DES were 3.45, 5.76, and 6.44 mg g−1, and 0.91, 1.12, and 2.21 mg g−1, respectively. The relative standard deviation (RSD) of every batch was listed in Table S2. The results exhibited that the reproducibility of six batches of Fe3O4@Multi-MIPs and Fe3O4@NIPs were all satisfactory with a RSD less than 8.6%.

The reusability of polymers was considered to have a great cost benefit on extending their utilization. Based on this, the adsorption–desorption cycle was repeated six times by using the same Fe3O4@Multi-MIPs and Fe3O4@NIPs to evaluate their stability. The change of the amounts of adsorbed three template EDCs after six regeneration cycles, as shown in Fig. 8, indicated that the adsorption capacities of Fe3O4@Multi-MIPs still maintained at almost steady values of 93.2%, 94.1%, and 92.6% for E2, E3, and DES, whereas the binding amounts of Fe3O4@NIPs remained almost unchanged. The decreased affinity adsorption of the Fe3O4@Multi-MIPs might be ascribed to the fact that some recognition sites in the network of imprinted polymers could be jammed after regeneration or destructed after rewashing. On the other hand, the adsorption affinity of Fe3O4@NIPs was nonspecific and the effect of washing steps could be negligible. The regeneration experiments of Fe3O4@Multi-MIPs and Fe3O4@NIPs verified the favorable stability of the nanomaterials prepared in this work.


image file: c4ra09825k-f8.tif
Fig. 8 Reusability of Fe3O4@Multi-MIPs and Fe3O4@NIPs.

Template recognition of Fe3O4@Multi-MIPs and reference polymers

We evaluated template recognition of Fe3O4@Multi-MIPs in parallel experiments with the reference polymers for E2, E3, and DES in a mixture solution. The Q and IF of the EDCs absorbed by the polymers were summarized in Table 3. It can be seen that Fe3O4@E2-MIPs, Fe3O4@E3-MIPs, and Fe3O4@DES-MIPs all had high adsorption to their corresponding template. In addition, compared with Fe3O4@NIPs, Fe3O4@E2-MIPs exhibited higher adsorption capacity to E3 and Fe3O4@E3-MIPs also absorbed higher amount to E2, which may be attributed to the resemblance of E2 and E3, particularly in their functional groups and structures. Fe3O4@E2-MIPs and Fe3O4@E3-MIPs both absorbed less DES, and Fe3O4@DES-MIPs absorbed less E2 and E3, which may be because of definite structural differences between DES and E2/E3, resulting in worse matching of Fe3O4@E2-MIPs and Fe3O4@E3-MIPs to DES and Fe3O4@DES-MIPs to E2/E3. These results demonstrated that the imprinted recognition cavities played important roles in the process of EDCs adsorption. The recognition capacity of Fe3O4@Multi-MIPs and M-MIPs for three EDCs was similar with the order of DES > E3 > E2. This may be due to the three EDCs containing different functional groups, DES has two phenyl groups and two hydroxyl groups, E3 contains one phenyl group and three hydroxyl groups, and E2 holds one phenyl group and two hydroxyl groups. After the comprehensive comparison of the experimental results, we can deduced that π–π interactions played a more important role in the recognition process compared with hydrogen bonding interactions. Although the adsorption effects of Fe3O4@Multi-MIPs and M-MIPs for three EDCs were similar, Fe3O4@Multi-MIPs prepared using three EDCs as the mixed-template molecules not only made the extraction procedure to be carried out in a single step for three EDCs, but also simplified the synthesis and processing procedures with distinct reduction in both preparation time and solvent consumption.
Table 3 The adsorption capacities and imprinting factors of Fe3O4@Multi-MIPs and reference polymersa
Polymers Q (mg g−1) IF
E2 E3 DES E2 E3 DES
a In this experiment, 20 mg of Fe3O4@Multi-MIPs and reference polymers were incubated with the mixture of E2, E3, and DES at a concentration of 30 μg mL−1 in 10 mL of ethanol for 4 min at room temperature.
Fe3O4@NIPs 0.912 1.12 2.21
Fe3O4@E2-MIPs 9.87 3.49 2.57 10.8 3.12 1.16
Fe3O4@E3-MIPs 2.84 11.5 2.63 3.11 10.3 1.19
Fe3O4@DES-MIPs 1.57 2.13 13.52 1.72 1.90 6.12
Fe3O4@Multi-MIPs 3.45 5.76 6.44 3.78 5.14 2.91
M-MIPs 3.82 5.38 6.57 4.19 4.80 2.97


Method performance

Under the optimal conditions, the experimental parameters were investigated to validate the proposed method (Table 4). The relatively high correlation coefficients (R2 > 0.9995) of the Fe3O4@Multi-MIPs solid-phase extraction coupled with HPLC method was achieved in the range of 0.3–100.0 ng mL−1 for three steroids estrogens (E2, E3, and DES). The limits of detection (LODs) and the limits of quantitation (LOQs) for three steroids estrogens, defined as signal-to-noise ratio of 3 and 10, were in the range of 0.08–0.27 and 0.29–0.94 ng mL−1, proving that the proposed method was sensitive. To investigate the precision, relative standard deviations (RSDs) of intra- and inter-day tests were measured at three different concentrations of 1.0, 10.0, and 100.0 ng mL−1. RSDs of intra- and inter-day precisions were obtained in the range of 2.3–4.5% and 3.2–5.9%, which demonstrated that the developed method had a satisfactory reproducibility.
Table 4 The performance parameters of the proposed method (n = 6)
Compounds Linearity range (ng mL−1) R2 RSD (%) LODs (ng mL−1) LOQs (ng mL−1)
Intra-day Inter-day
E2 1.0–100 0.9996 3.8–4.5 4.3–5.9 0.27 0.94
E3 0.8–100 0.9997 2.7–3.9 3.5–4.8 0.19 0.72
DES 0.3–100 0.9998 2.3–3.5 3.2–3.6 0.08 0.29


Different methods for determination of steroids estrogens were summarized briefly in Table 5. As can be seen, the present approach had lower LODs than those of other reported methods followed by HPLC-UV analysis,21,38 and possessed the merits of solvent-saving and easy separation of sorbent after extraction under an external magnetic field compared with the liquid–liquid–liquid micro-extraction and non-magnetic molecularly imprinted solid-phase extraction, respectively. Meanwhile, the developed method based on using Fe3O4@Multi-MIPs as solid extractant had comparable LODs in comparison with the method of UPLC-MS-MS,17 proving that the pretreatment in this work was much effective and selective. Furthermore, although the LODs obtained in this work was slightly higher than that of GC-MS analysis method,39 the one more step of derivatization was needed before GC-MS analysis, which was complex and hard to control. Through the comparison, we could conclude that the method developed in this work was simple, time-saving, reliable, effective, and sensitive.

Table 5 Comparison of LODs with other published methods for the determination of estrogens
Analytes Extraction method Analytical system LODs (ng mL−1) Reference
a MISPE: molecularly imprinted solid-phase extraction.b HF-LLLME: hollow fiber liquid–liquid–liquid microextraction.c ZIF-8-MSPE: zeolitic imidazolate framework-8 micro-solid-phase extraction.
E2, E3, DES MISPEa HPLC-UV 1.00–8.00 21
E2, E3, DES HF-LLLMEb HPLC-UV 0.11–0.66 38
E2, E3 ZIF-8-MSPEc UPLC-MS-MS 0.05 17
E2, E3, DES GC-MS 0.0034–0.0042 39
E2, E3, DES Fe3O4@Multi-MIPs-SPE HPLC-UV 0.08–0.27 This work


Analysis in environmental water samples

To evaluate the accuracy and potential application of the developed method that uses Fe3O4@Multi-MIPs as the SPE adsorbents coupled with HPLC-UV for selective separation and detection of E2, E3, and DES in environmental water samples. The environmental water samples spiked with three levels of E2, E3, and DES (0.5, 1.0, and 3.0 ng mL−1) were analyzed (Table 6). The recoveries of river water and lake water samples were ranged from 93.4 to 98.6% and 92.3–98.2%, respectively. The RSD was less than 6.5%. The chromatograms of water samples spiked with E2, E3, and DES at the concentration of 3.0 ng mL−1, and the elution of adsorbed Fe3O4@Multi-MIPs and Fe3O4@NIPs to E2, E3, and DES washed with a mixture of methanol–HAc (95[thin space (1/6-em)]:[thin space (1/6-em)]5, v/v) were exhibited in Fig. 9. The peaks of E2, E3, and DES could not be observed from chromatograms of the spiked river and lake water samples (Fig. 9a). Through the preconcentration of spiked river or lake water samples by Fe3O4@Multi-MIPs, and washing by methanol–HAc (95[thin space (1/6-em)]:[thin space (1/6-em)]5, v/v), the peaks of E2, E3, and DES appeared and other interference peaks were almost completely eliminated (Fig. 9c). The results demonstrated that Fe3O4@Multi-MIPs offered a simple method for simultaneously selective enrichment and efficient separation of E2, E3, and DES in spiked environmental water samples, while presenting an extremely high anti-interference ability compared with Fe3O4@NIPs (Fig. 9b). These results revealed that Fe3O4@Multi-MIPs could be directly applied for simultaneously selective isolation and determination of E2, E3, and DES in environmental water samples.
Table 6 Recoveries of Fe3O4@Multi-MIPs binding E2, E3, and DES for spiked lake and river water samples (n = 5)
Analytes Lake water River water
0.50 ng mL−1 1.0 ng mL−1 3.0 ng mL−1 0.50 ng mL−1 1.0 ng mL−1 3.0 ng mL−1
Recovery (%) RSD (%) Recovery (%) RSD (%) Recovery (%) RSD (%) Recovery (%) RSD (%) Recovery (%) RSD (%) Recovery (%) RSD (%)
E2 92.3 6.3 93.7 4.8 95.1 3.2 93.4 6.5 94.1 5.4 96.5 2.8
E3 93.2 5.1 94.9 4.2 97.4 2.4 93.8 5.3 95.6 3.2 98.1 2.1
DES 93.6 4.5 95.5 3.6 98.2 1.9 94.2 4.4 96.3 3.7 98.6 1.6


image file: c4ra09825k-f9.tif
Fig. 9 Chromatograms of lake (A) and river (B) water samples. (a) Samples spiked with templates at the concentration of 3.0 ng mL−1, elution of (b) Fe3O4@NIPs and (c) Fe3O4@Multi-MIPs after the polymers adsorbing 100 mL of lake or river water spiked samples, respectively.

Conclusions

In this study, an innovative method was developed to prepare the multi-template imprinted polymers by combining the advantages of surface imprinting technique, sol–gel approach, and magnetic separation for the specific extraction of three EDCs simultaneously. The prepared imprinted nanomaterials exhibited fast kinetics, excellent recognition performance, and favorable selective affinity towards three templates, and also had regeneration potential for reuse at least six times without significant degradation in the binding property. Meanwhile, the resulting products were used as absorbents coupled with HPLC-UV for specific isolation and detection of three EDCs from environmental water samples concurrently. The proposed method showed the features of simplicity, sensitivity and reliability. At the same time, good recoveries and low LODs were obtained. Our research findings suggested that multi-templates imprinted polymers can be triumphantly utilized for efficient and selective removal of a class of pollutants from environmental matrices.

Acknowledgements

The authors are grateful for financial support from the National Natural Science Foundation of China (no. 21305107), the Fundamental Research Funds for the Central Universities (nos 08143081, 08142034), and China Postdoctoral Science Foundation (no. 2014M562388).

References

  1. D. W. Kolpin, E. T. Furlong, M. T. Meyer, E. M. Thurman, S. D. Zaugg, L. B. Barber and H. T. Buxton, Environ. Sci. Technol., 2012, 36, 1202–1211 CrossRef .
  2. I. Robinson, G. Junqua, R. V. Coillie and O. Thomas, Anal. Bioanal. Chem., 2007, 387, 1143–1151 CrossRef CAS PubMed .
  3. J. B. Gadd, L. A. Tremblay and G. L. Northcott, Environ. Pollut., 2010, 158, 730–736 CrossRef CAS PubMed .
  4. A. Vallejo, A. Usobiaga, M. Ortiz-Zarragoitia, M. P. Cajaraville, L. A. Fernández and O. Zuloaga, Anal. Bioanal. Chem., 2010, 398, 2307–2314 CrossRef CAS PubMed .
  5. D. Fatta-Kassinos, I. K. Kalavrouziotis, P. H. Koukoulakis and M. I. Vasquez, Sci. Total Environ., 2011, 409, 3555–3563 CrossRef CAS PubMed .
  6. M. S. Souza, P. Hallgren, E. Balseiro and L. A. Hansson, Environ. Pollut., 2013, 178, 237–243 CrossRef CAS PubMed .
  7. M. Kostich, R. Flick and J. Martinson, Environ. Pollut., 2013, 178, 271–277 CrossRef CAS PubMed .
  8. M. Grassi, L. Rizzo and A. Farina, Environ. Sci. Pollut. Res., 2013, 20, 3616–3628 CrossRef CAS PubMed .
  9. V. Okoh, A. Deoraj and D. Roy, Biochim. Biophys. Acta, 2011, 1815, 115–133 CAS .
  10. W. Y. Hu, G. B. Shi, D. P. Hu, J. L. Nelles and G. S. Prins, Mol. Cell. Endocrinol., 2012, 354, 63–73 CrossRef CAS PubMed .
  11. P. A. Fowler, M. Bellingham, K. D. Sinclair, N. P. Evans, P. Pocar, B. Fischer, K. Schaedlich, J. S. Schmidt, M. R. Amezaga, S. Bhattacharya, S. M. Rhind and P. J. O'Shaughnessy, Mol. Cell. Endocrinol., 2012, 355, 231–239 CrossRef CAS PubMed .
  12. C. Stouder and A. Paoloni-Giacobino, Reproduction, 2011, 141, 207–216 CrossRef CAS PubMed .
  13. C. P. Silva, D. L. D. Lima, R. J. Schneider, M. Otero and V. I. Esteves, J. Environ. Manage., 2013, 124, 121–127 CrossRef CAS PubMed .
  14. S. K. Garnayak, J. Mohanty, T. V. Rao, S. K. Sahoo and P. K. Sahoo, Aquaculture, 2013, 392–395, 148–155 CrossRef CAS .
  15. G. Saravanabhavan, R. Helleur and J. Hellou, Chemosphere, 2009, 76, 1156–1162 CrossRef CAS PubMed .
  16. C. M. Lu, M. T. Wang, J. Mu, D. C. Han, Y. P. Bai and H. Q. Zhang, Food Chem., 2013, 141, 1796–1806 CrossRef CAS PubMed .
  17. Y. H. Wang, S. G. Jin, Q. Y. Wang, G. H. Lu, J. J. Jiang and D. R. Zhu, J. Chromatogr. A, 2013, 1291, 27–32 CrossRef CAS PubMed .
  18. T. M. Penning, S. H. Lee, Y. Jin, A. Gutierrez and I. A. Blair, J. Steroid Biochem. Mol. Biol., 2010, 121, 546–555 CrossRef CAS PubMed .
  19. E. Tahmasebi, Y. Yamini, M. Moradi and A. Esrafili, Anal. Chim. Acta, 2013, 770, 68–74 CrossRef CAS PubMed .
  20. Z. K. Lin, W. J. Cheng, Y. Y. Li, Z. R. Liu, X. P. Chen and C. J. Huang, Anal. Chim. Acta, 2012, 720, 71–76 CrossRef CAS PubMed .
  21. C. D. Zhao, X. M. Guan, X. Y. Liu and H. X. Zhang, J. Chromatogr. A, 2012, 1229, 72–78 CrossRef CAS PubMed .
  22. Q. C. Zhang, X. H. Xiao and G. K. Li, Talanta, 2014, 123, 63–70 CrossRef CAS PubMed .
  23. B. Wu, Z. H. Wang, Z. H. Xue, X. B. Zhou, J. Du, X. H. Liu and X. Q. Lu, Analyst, 2012, 137, 3644–3652 RSC .
  24. Y. Guo and T. Y. Guo, Chem. Commun., 2013, 49, 1073–1075 RSC .
  25. T. Madrakian, M. Ahmadi, A. Afkhami and M. Soleimani, Analyst, 2013, 138, 4542–4549 RSC .
  26. A. Zengin, E. Yildirim, U. Tamerb and T. Caykara, Analyst, 2013, 138, 7238–7245 RSC .
  27. X. L. Xia, E. P. C. Lai and B. Örmeci, Environ. Sci. Pollut. Res., 2013, 20, 3331–3339 CrossRef CAS PubMed .
  28. Y. P. Duan, C. M. Dai, Y. L. Zhang and L. Chen, Anal. Chim. Acta, 2013, 758, 93–100 CrossRef CAS PubMed .
  29. Y. M. Ren, J. Yang, W. Q. Ma, J. Ma, J. Feng and X. L. Liu, Water Res., 2014, 50, 90–100 CrossRef CAS PubMed .
  30. J. Zhang, L. L. Wang and Y. T. Han, J. Sep. Sci., 2013, 36, 3486–3492 CrossRef CAS PubMed .
  31. S. Mohapatra, N. Pramanik, S. Mukherjee, S. K. Ghosh and P. Pramanik, J. Mater. Sci., 2007, 42, 7566–7574 CrossRef CAS .
  32. Q. W. Peng, J. Gan, S. F. Wang, L. B. Kong, G. R. Chen, Y. X. Yang and G. J. Huang, Ind. Eng. Chem. Res., 2013, 52, 7713–7717 CrossRef CAS .
  33. Z. K. Lin, Q. Y. He, L. T. Wang, X. D. Wang, Q. X. Dong and C. J. Huang, J. Hazard. Mater., 2013, 252–253, 57–63 CrossRef CAS PubMed .
  34. S. Wang, R. Y. Wang, X. L. Wu, Y. Wang, C. Xue, J. H. Wu, J. L. Hong, J. Liu and X. M. Zhou, J. Chromatogr. B: Anal. Technol. Biomed. Life Sci., 2012, 905, 105–112 CrossRef CAS PubMed .
  35. J. Gañán, A. Gallego-Picó, R. M. Garcinuño, P. Fernández-Hernando, S. Morante, I. Sierra and J. S. Durand, Anal. Bioanal. Chem., 2012, 403, 3025–3029 CrossRef PubMed .
  36. X. Kong, R. X. Gao, X. W. He, L. X. Chen and Y. K. Zhang, J. Chromatogr. A, 2012, 1245, 8–16 CrossRef CAS PubMed .
  37. F. F. Chen, X. Y. Xie and Y. P. Shi, J. Chromatogr. A, 2013, 1300, 112–118 CrossRef CAS PubMed .
  38. B. B. Chen, Y. L. Huang, M. He and B. Hu, J. Chromatogr. A, 2013, 1305, 17–26 CrossRef CAS PubMed .
  39. N. Migowska, M. Caban, P. Stepnowski and J. Kumirska, Sci. Total Environ., 2012, 441, 77–88 CrossRef CAS PubMed .

Footnote

Electronic supplementary information (ESI) available. See DOI: 10.1039/c4ra09825k

This journal is © The Royal Society of Chemistry 2014
Click here to see how this site uses Cookies. View our privacy policy here.