SnO2 decorated graphene nanocomposite anode materials prepared via an up-scalable wet-mechanochemical process for sodium ion batteries

Sheng Lia, Yazhou Wanga, Jingxia Qiua, Min Linga, Haihui Wangb, Wayde Martensc and Shanqing Zhang*a
aCentre for Clean Environmental and Energy, Environmental Futures Research Institute, and Griffith School of Environment, Griffith University, Gold Coast, QLD 4222, Australia. E-mail: s.zhang@griffith.edu.au; Tel: +61-7-5552-8155
bCollege of Chemistry and Chemical Engineering, South China University of Technology, Guangzhou 510640, China
cDiscipline of Nanotechnology and Molecular Science, Queensland University of Technology, GPO Box 2434, Brisbane, Queensland 4001, Australia

Received 3rd September 2014 , Accepted 1st October 2014

First published on 1st October 2014


Abstract

A facile and up-scalable wet-mechanochemical process is designed for fabricating ultra-fine SnO2 nanoparticles anchored on graphene networks for use as anode materials for sodium ion batteries. A hierarchical structure of the SnO2@graphene composite is obtained from the process. The resultant rechargeable SIBs achieved high rate capability and good cycling stability.

Introduction

Rechargeable batteries are not only important to satisfy our energy requirements in daily life, but are also vital to address the emerging environmental issues and the world energy crisis. In the last decade, lithium ion batteries (LIBs) have achieved remarkable progress in electronic appliance applications and electrical vehicles.1–5 However, large-scale applications of LIBs have been heavily restricted by their high cost and limited supply of lithium on the earth. In this regard, sodium ion batteries (SIBs) are considered as one of the most promising alternatives to LIBs, due to their significantly lower cost and the abundance of sodium. This is especially true in the smart grid applications where large scale, long term stability and low cost are the dominant factors.6–8 Though LIBs and SIBs share similar chemistry in the charge/discharge processes, the essential components of LIBs cannot be simply adopted for SIBs owing to the fact that the Na ion is substantially larger (55% in radius) than the Li ion. For instance, graphite, the most commonly used LIB anode material, is not suitable for SIBs due to its poor Na ion insertion property.9–11 The electrode materials for SIBs should contain large and abundant transport channels for Na ion transportation.

Nevertheless, several anode materials such as carbon, alloys, metal sulfates and metal oxides have been investigated for SIBs.7,12–21 Among them, SnO2 is one of the most promising candidates due to its high theoretical specific capacity of 667 mA h g−1.18,22 In order to achieve the full capacity, the inherent deficiencies of SnO2, such as poor electronic conductivity, and severe volume change during the charge/discharge processes which causes pulverization of the electrode and needs to be addressed.8,23 Mounting small SnO2 particles on a resilient conductive substrate could be an effective strategy to tackle the above limitations. In this regard, graphene could benefit the entire battery process as it possesses superior conductivity, good mechanical strength, large surface area and unique sheet structure.21,24

In this work, a wet-mechanochemical method is designed for fabricating uniform SnO2@graphene nanocomposites from SnCl2 and graphene oxide (GO) which are ball-milled in aqueous media. Compared with other multi-step sophisticated methods,8,22,25,26 this strategy is simple, rapid, facile, economical and most importantly up-scalable. The precursors (SnCl2 and GO) are firstly dispersed homogeneously in water, before the constant and powerful mechanical striking of the milling media constrains Sn2+ at the surface of GO sheets where redox reactions are initiated by the high impact energy. As a result, GO is reduced to graphene while Sn2+ is oxidized to SnO2, as shown in eqn (1):

 
image file: c4ra09699a-t1.tif(1)

Due to the necessity of both an oxidant and a reductant, only the impacts at the surface of the GO will result in successful reactions which producing in SnO2 particles strongly bonded to the surface of the graphene. The random and high frequency nature of the impacts on the surface of GO ensure a relatively even SnO2 coating. It is expected that a hierarchical SnO2@graphene structure would form in this process which is beneficial to electrochemical performances of SIBs. Moreover, with the uniform coating, graphene sheets could be avoided from stacking together, enabling the efficient transportation in the electrode of Na ions.

Experimental

SnCl2·2H2O (0.45 g, Merck Pty. Ltd.) and graphene oxide (GO, 0.1 g, Tianjin Plannano Technology Co. Ltd.) are firstly dispersed in 10 mL deionized water. The resultant mixture is added to a planetary zirconia ball miller at room temperature at a speed of 500 rpm for 3 h. Then the as-prepared product SnO2@graphene is washed in water and ethanol in sequence, and subsequently dried in a vacuum oven at 60 °C. Commercial tin oxide nanopowder (SnO2, Nanostructured & Amorphous Materials Inc.) was used as a control sample.

The morphology was examined by a scanning electron microscope (SEM, JSM-7001F) and transmission electron microscopy (TEM, FEI Model Tecnai G20). X-ray diffraction (XRD) was also tested using CuKα radiation over the 2θ range of 10–80° (Model LabX-6000, Shimadzu, Japan). The multipoint Brunauer–Emmett–Teller (BET) surface area was estimated using adsorption data obtained from a surface area analyser (Micromeritics Tristar 3020). For X-ray photoelectron spectroscopy (XPS, Kratos Axis ULTRA incorporating a 165 mm hemispherical electron energy analyzer) test, all binding energies were referenced to the C1s peak (284.8 eV). Raman spectra were examined at room temperature by a Renishaw 100 system (Raman spectrometer using 514 nm Argon green laser as light source).

As active materials, the samples are mixed with 10 wt% carbon black and 10 wt% polyvinylidene difluoride (PVDF, Aldrich) in N-methyl-2-pyrrolidone (NMP, Aldrich) solvent to form homogeneous slurries. The resultant slurries are uniformly coated onto Cu foils with an area of 1 cm2. The loading of the electrode material is ca. 1–2 mg. The pasted Cu foils are dried in a vacuum oven at 60 °C and then pressed by a double-roll compressor. CR2032 coin-type cells are assembled in an argon-filled M-Braun glove box. A glass fiber (GA-55) membrane is used as the separator, a sodium metal sheet as the counter electrode, and 1 M NaClO4 in a 1[thin space (1/6-em)]:[thin space (1/6-em)]1 (v/v) mixture of ethylene carbonate (EC) and propylene carbonate (PC) as the electrolyte. To measure the electrochemical capacity and cycle life of the working electrodes, the cells are charged and discharged using LANDCT 2001A battery tester (Wuhan, PRC) in a voltage range from 0.01 to 2.5 V vs. Na/Na+. Cyclic voltammetry (CVs) were performed using a CHI 660D electrochemical workstation (CH Instrument, Shanghai, PRC). CVs were recorded between 2.5 V and 0.01 V at a scan rate of 0.1 mV s−1, using the composite as the working electrode and a sodium sheet as both counter electrode and reference electrode. Electrochemical impedance spectroscopy (EIS) was also carried out in this two-electrode system with amplitude of 5 mV over the frequency range from 100 kHz to 0.01 Hz.

Results and discussion

The SEM images in Fig. 1a and b display the morphologies of the GO and SnO2@graphene samples, respectively. After wet ball-milling, the sheet-like shape of the graphene in SnO2@graphene samples is maintained, but are now less-transparent, suggesting that the sheet thickness has been significantly increased, seemingly due to the SnO2 nanoparticles anchored onto the graphene sheets. The anchored SnO2 nano particles prevents the graphene sheets from stacking together, and the interlaced sheets would create some voids/channels in the electrode which are tolerant for the dramatic volume change during the charge/discharge process. The corresponding selected-area electron diffraction (SAED) pattern in Fig. 1c (inset) shows that the rings from inside to outside are well-indexed to the (100), (101), and (211) planes of SnO2, respectively, confirming the formation of SnO2. It can be observed that the SnO2 particles are fine and uniform, densely attached on graphene sheets. The HRTEM images in Fig. 1d and S1 clearly show that the regular inter-plenary spacing of 0.34 nm can be ascribed to the (110) planes of SnO2 and the average SnO2 particle size is only ca. 3 nm.
image file: c4ra09699a-f1.tif
Fig. 1 (a) SEM image of the GO; (b) SEM image of SnO2@graphene; (c) TEM image with the SAED pattern (inset) of SnO2@graphene and (d) HR-TEM image of SnO2@graphene sample.

The XRD pattern in Fig. 2a confirms the formation of SnO2 (PDF 41-1445). According to the Scherrer equation, the crystal diameter can be approximated as ca. 3 nm, agreeing well with the results of HRTEM. Achieving such a small particle size can be considered as a unique advantage of the proposed wet mechanochemical method as the dry mechanochemical method can commonly achieve as small as several micrometres.27 This ultra-fine size would be beneficial to Na ions mass transport as it shortens the diffusion path length of the Na ions. The adsorption–desorption isotherms belong to type IV based on the hysteresis loop (Fig. 2b), which indicates the existence of 3-D channels and the network structure. The SnO2@graphene composites exhibit a high surface area of 273 m2 g−1 according to the BET measurement. This also implies successful inhibition to the aggregation of nanoparticles and restacking of graphene sheets, which may enable the insertion/extraction of Na ions for the graphene sheets. The weight percentage of SnO2 of the composites is characterizes by TGA test as ca. 70%.


image file: c4ra09699a-f2.tif
Fig. 2 (a) XRD image and (b) BET adsorption measurement of the SnO2@graphene; (c) XPS of C 1s for GO and SnO2@graphene samples; (d) Raman spectra of SnO2@graphene sample and GO. (e) The reaction mechanism and the colours of reactants and products.

The reduction degree of GO by reaction (1) was investigated by XPS measurements. Fig. 2c displays the data of C 1s for GO and SnO2@graphene samples. The oxygen functional groups could be clearly observed from GO profile, which are corresponding to C*–CO, C–O, C[double bond, length as m-dash]O and COOH, respectively.24 In comparison, for SnO2@graphene, after the wet ball-milling process, the oxygen functional groups on the surface of graphene decreased dramatically, indicating the successful reduction from GO to graphene. The color of the samples also changes from brown to black as shown in Fig. 2e, suggesting the successful reduction of GO. D band and G band peaks could be observed in Raman spectra (Fig. 2d) for both the SnO2@graphene composite and GO. It is established that the ratio of the D band and G band intensities (ID/IG) reflects the extent for the disruption of the symmetrical hexagonal graphitic lattice.28–30 In this case, the ID/IG for SnO2@graphene is higher than that of GO due to the interaction of the between SnO2 and graphene leads to the disruption. This implies that the SnO2 nano particles are successfully anchored on graphene sheets.

Electrochemical characteristics of the commercial SnO2 and SnO2@graphene samples were investigated systematically as anodes of SIBs. Fig. 3a and b present the CV curves of the commercial SnO2 and SnO2@graphene samples with a scan rate of 0.1 mV s−1. At the first cycle of SnO2 electrode, three obvious irreversible cathodic peaks could be observed at 0.75 V, 0.4 V and 0.01 V, which are attributed to the formation of NaSn5, NaSn and NaxSn4 (x ≥ 9), respectively, according to the density functional theory (DFT) calculation results for the Sn sodiation voltages of SIBs.31

 
SnO2 → Sn → NaSn5 → NaSn → Na9Sn4 → Na15Sn4. (2)


image file: c4ra09699a-f3.tif
Fig. 3 (a) CV profiles for the first 3 cycles of commercial SnO2 sample and (b) SnO2@graohene sample as the electrodes materials for SIBs. (c) The charge/discharge profiles for the SnO2@graphene SIB; and (d) the charge/discharge capacities and the coulombic efficiency of the SnO2@graphene and the capacities of the commercial SnO2 at a current density of 0.1 A g−1.

In contrast, the CV curve of the first cycle for SnO2@graphene (Fig. 3b) shows only a cathodic broad peak at 0.01–0.4 V which is contributed by the reduction for SnO2 nanoparticles to Na15Sn4, the formation of solid electrolyte interface (SEI) and the insertion of Na ions into graphene 3-D network. The shapes of the CV curves in the following two cycles are similar as the first one. It can be concluded as the capacity of SnO2@graphene for SIBs is a combination of two parts: the insertion/extraction of Na ion in graphene 3-D framework and the alloying/dealloying between Sn and Na15Sn4. It can be described as eqn (3)–(5):8,22

 
SnO2 + 4Na+ + 4e → Sn + 2Na2O (3)
 
4Sn + 15Na+ + 15e ↔ 4Na15Sn4 (4)
 
C + xNa+ + xe ↔ NaxC (5)

The shapes of CV profile for SnO2@graphene sample is quite similar as the shapes of carbon material,32 but the capacity is much higher than that of graphene sample (about 176 mA h g−1 at 0.1 A g−1 (ref. 33)).

The charge/discharge voltage profiles of the commercial SnO2 and SnO2@graphene samples are evaluated at 0.1 A g−1 in the range of 0.1–2.5 V as shown in Fig. 3c. A characteristic irreversible discharge plateau from 0.8 V vs. Na+/Na is observed and the resultant electrode delivers a high specific capacity at 750 mA h g−1 at the 1st cycle while it maintains only 407 mA h g−1 at the 2nd cycle due to the irreversible reactions at the first cycle, agreeing well with the CV result. From the 2nd cycle, this plateau disappears, and the charge/discharge curves almost overlap, indicating that the electrochemical reduction process is completed since the reduction reaction of SnO2 is an irreversible reaction18 and the SEI is stabilized.

In comparison with the control sample, the SnO2@graphene shows a lot better cycling stability as shown in Fig. 3d. After 50 cycles, the capacity of the SnO2@graphene is 286 mA h g−1 and maintains at 270 mA h g−1 after 100 cycles (86% retention for the 5th cycle). Interestingly, the extraordinary coulombic efficiencies (>100%) are observed in first 3 cycles mainly due to due to there is an irreversible discharge process, (reaction (3)) in addition to the reversible discharge process (reaction (4)). After 3 cycles, the charge/discharge capacities stabilize and the coulombic efficiency continuously maintain at ca. 100%, showing a good reversibility. The commercial SnO2 only delivers a low initial irreversible discharge capacity (315 mA h g−1) and then drops rapidly to zero.

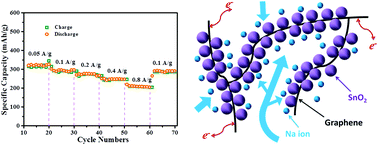
The rate capacities of the SnO2@graphene samples are further investigated in Fig. 4a. The SnO2@graphene delivers a discharge capacity of 320 mA h g−1 at a current density of 0.05 A g−1. When the rate rises to 0.1, 0.2, 0.4 and even 0.8 A g−1, the specific capacities are retained and are quantified as 290, 274, 246 and 207 mA h g−1, respectively. An excellent rate capability and stability was observed in that only 28.6% capacity loss when the rates increase from 0.1 to 0.8 A g−1. The high rate capacity (0.8 A g−1) for the SnO2@graphene composites is among the best of current literatures,8,18,25 which is due to the small particle size of SnO2 and the special networks structure with a large specific area. After the varied rate cycles, the capacity of the electrode could nearly recover to the initial capacity of over 285 mA h g−1 at 0.1 A g−1. Fig. 4b presents the charge and discharge profiles of SnO2@graphene for SIB at different current densities. It could be observed that with the increase of the current density, the curves shape does not change, suggesting the SnO2@graphene electrode can enable a fast transportation of Na ions for SIBs. The structure and the chemistry during the charge and discharge process are all stabilized, which is benefited from the framework structure of the electrode.


image file: c4ra09699a-f4.tif
Fig. 4 (a) the rate charge/discharge capability for SnO2@graphene and (b) their charge and discharge curves from 0.05 A g−1 to 0.8 A g−1 (from the 15th, 25th, 35th, 55th cycles, respectively), (c) Nyquist plots of the SnO2@graphene and commercial SnO2. (d) Schematic representation of the hierarchical structure of the SnO2@graphene nanocomposite for SIBs.

EIS measurements are conducted for the SnO2@graphene and SnO2 control samples after 3 cycles charge/discharge. Both of the Nyquist plots shown in Fig. 4c display depressed semicircles in high-middle frequency region, which are ascribed to the charge transfer resistance (Rct, directly proportional to the radius of the semicircles); and a 45° inclined line in the low frequency region, which can be considered to be Warburg impedance. A much smaller Rct (∼320 Ω for SnO2@graphene; ∼2338 for commercial SnO2) could be observed for the SnO2@graphene, which can be attributed to robust and strong links between the SnO2 and graphene sheets as well as the highly conductive nature of the graphene.

The mechanism responsible for the exceptional electrochemical performance and resilient stability of the resultant SIBs can be concluded in Fig. 4d. Firstly, the achievement of ultra-small size of the SnO2 particles (ca. 3 nm), the successful prevention of the graphene stacking and the strong links between the SnO2 and graphene sheets facilitate thorough electrochemical reduction of SnO2 for Sn production. Secondly, the superior electronic conductivity of graphene, produced by the thorough reduction reaction of GO in the wet-mechanochemical process, which guarantees high electron collection percentage within the 3-D network. Last but not least, such robust 3-D conductive networks and the hierarchical structure of the nanocomposites would accommodate the dramatic volume change of SnO2 and Sn during charge/discharge progress. Large surface areas and channels in the electrode not only enhance rapid mass transport of the Na ions within the resultant 3-D networks and the alloying/dealloying process, but also enables the insertion and extraction of Na ions in graphene sheets.

Conclusions

SnO2@graphene nanocomposites are successfully synthesized via a facile wet-mechanochemical route. The SnO2 nanoparticles are uniformly anchored onto graphene sheets, forming a hierarchical 3-D network on the electrode. This process prohibits the aggregation of SnO2, eliminates the restacking of graphene sheets and therefore enhances the mass transport of Na ions within the 3-D conductive graphene network. Consequently, the SnO2@graphene composite could overcome the problems of pulverization and high resistance of SnO2, delivering outstanding energy capacity and cycling stabilities in SIBs. This process is a promising way for mass production of low cost and high quality anode materials for SIBs.

Acknowledgements

The authors acknowledge the financial supports from Australia Research Council and Griffith University, Australia, and the facilities and the scientific and technical assistance of the Australian Microscopy & Microanalysis Research Facility at the Center for Microscopy and Microanalysis (CMM) at the University of Queensland, Australia.

Notes and references

  1. J. Qiu, S. Li, E. Gray, H. Liu, Q.-F. Gu, C. Sun, C. Lai, H. Zhao and S. Zhang, J. Phys. Chem. C, 2014, 118, 8824 CAS.
  2. J. B. Goodenough and K. S. Park, J. Am. Chem. Soc., 2013, 135, 1167 CrossRef CAS PubMed.
  3. B. Guo, Y. Li, Y. Yao, Z. Lin, L. Ji, G. Xu, Y. Liang, Q. Shi and X. Zhang, Solid State Ionics, 2011, 204–205, 61 CrossRef CAS PubMed.
  4. M. Ling, J. Qiu, S. Li, G. Liu and S. Zhang, J. Mater. Chem. A, 2013, 1, 11543 CAS.
  5. J. Qiu, C. Lai, S. Li and S. Zhang, RSC Adv., 2014, 4, 18899 RSC.
  6. T. Chen, Y. Liu, L. Pan, T. Lu, Y. Yao, Z. Sun, D. H. C. Chua and Q. Chen, J. Mater. Chem. A, 2014, 2, 4117 CAS.
  7. J. Qian, X. Wu, Y. Cao, X. Ai and H. Yang, Angew. Chem., Int. Ed., 2013, 52, 4633 CrossRef CAS PubMed.
  8. D. Su, H. J. Ahn and G. Wang, Chem. Commun., 2013, 49, 3131 RSC.
  9. M. D. Slater, D. Kim, E. Lee and C. S. Johnson, Adv. Funct. Mater., 2013, 23, 947 CrossRef CAS.
  10. S.-W. Kim, D.-H. Seo, X. Ma, G. Ceder and K. Kang, Adv. Energy Mater., 2012, 2, 710 CrossRef CAS.
  11. V. Palomares, P. Serras, I. Villaluenga, K. B. Hueso, J. Carretero-González and T. Rojo, Energy Environ. Sci., 2012, 5, 5884 CAS.
  12. X. Zhou and Y.-G. Guo, ChemElectroChem, 2014, 1, 83 CrossRef.
  13. Y. Shao, J. Xiao, W. Wang, M. Engelhard, X. Chen, Z. Nie, M. Gu, L. V. Saraf, G. Exarhos, J. G. Zhang and J. Liu, Nano Lett., 2013, 13, 3909 CrossRef CAS PubMed.
  14. C. W. Mason, I. Gocheva, H. E. Hoster and D. Y. Yu, Chem. Commun., 2014, 50, 2249 RSC.
  15. H. Xiong, M. D. Slater, M. Balasubramanian, C. S. Johnson and T. Rajh, J. Phys. Chem. Lett., 2011, 2, 2560 CrossRef CAS.
  16. S. Yuan, X. L. Huang, D. L. Ma, H. G. Wang, F. Z. Meng and X. B. Zhang, Adv. Mater., 2014, 26, 2273 CrossRef CAS PubMed.
  17. C. Deng, S. Zhang, Z. Dong and Y. Shang, Nano Energy, 2014, 4, 49 CrossRef CAS PubMed.
  18. Y.-X. Wang, Y.-G. Lim, M.-S. Park, S.-L. Chou, J. H. Kim, H.-K. Liu, S.-X. Dou and Y.-J. Kim, J. Mater. Chem. A, 2014, 2, 529 CAS.
  19. L. Xiao, Y. Cao, J. Xiao, W. Wang, L. Kovarik, Z. Nie and J. Liu, Chem. Commun., 2012, 48, 3321 RSC.
  20. P. Senguttuvan, G. Rousse, V. Seznec, J.-M. Tarascon and M. R. Palacín, Chem. Mater., 2011, 23, 4109 CrossRef CAS.
  21. Z. Jian, B. Zhao, P. Liu, F. Li, M. Zheng, M. Chen, Y. Shi and H. Zhou, Chem. Commun., 2014, 50, 1215 RSC.
  22. Y. Wang, D. Su, C. Wang and G. Wang, Electrochem. Commun., 2013, 29, 8 CrossRef CAS PubMed.
  23. H. Zhu, Z. Jia, Y. Chen, N. Weadock, J. Wan, O. Vaaland, X. Han, T. Li and L. Hu, Nano Lett., 2013, 3093 CrossRef CAS PubMed.
  24. S. Li, Y. Wang, C. Lai, J. Qiu, M. Ling, W. N. Martens, H. Zhao and S. Zhang, J. Mater. Chem. A, 2014, 2, 10211 CAS.
  25. Y. Xu, Y. Zhu, Y. Liu and C. Wang, Adv. Energy Mater., 2013, 3, 128 CrossRef CAS.
  26. C. Gu, H. Zhang, X. Wang and J. Tu, Mater. Res. Bull., 2013, 48, 4112 CrossRef CAS PubMed.
  27. C. Lai, Z. Wu, Y. Zhu, Q. Wu, L. Li and C. Wang, J. Power Sources, 2013, 226, 71 CrossRef CAS PubMed.
  28. C. Zhong, J. Wang, Z. Chen and H. Liu, J. Phys. Chem. C, 2011, 115, 25115 CAS.
  29. Y.-H. Hwang, E. G. Bae, K.-S. Sohn, S. Shim, X. Song, M. S. Lah and M. Pyo, J. Power Sources, 2013, 240, 683 CrossRef CAS PubMed.
  30. J. Liang, W. Wei, D. Zhong, Q. Yang, L. Li and L. Guo, ACS Appl. Mater. Interfaces, 2012, 4, 454 CAS.
  31. V. L. Chevrier and G. Ceder, J. Electrochem. Soc., 2011, 158, A1011 CrossRef CAS PubMed.
  32. T. Chen, L. Pan, T. Lu, C. Fu, D. H. C. Chua and Z. Sun, J. Mater. Chem. A, 2014, 2, 1263 CAS.
  33. Y.-X. Wang, S.-L. Chou, H.-K. Liu and S.-X. Dou, Carbon, 2013, 57, 202 CrossRef CAS PubMed.

Footnote

Electronic supplementary information (ESI) available: Further characterizations of TEM and Raman tests. See DOI: 10.1039/c4ra09699a

This journal is © The Royal Society of Chemistry 2014