Catalytic dehydration of fructose to 5-hydroxymethylfurfural over a mesoscopically assembled sulfated zirconia nanoparticle catalyst in organic solvent

Ningning Wang, Yuan Yao, Wei Li, Yan Yang, Zhanxin Song, Wentao Liu, Haijun Wang*, Xiao-Feng Xia and Haiyan Gao
The Key Laboratory of Food Colloids and Biotechnology, Ministry of Education, School of Chemical and Material Engineering, Jiangnan University, Wuxi 214122, Jiangsu, China. E-mail: wanghj329@outlook.com

Received 1st September 2014 , Accepted 28th October 2014

First published on 28th October 2014


Abstract

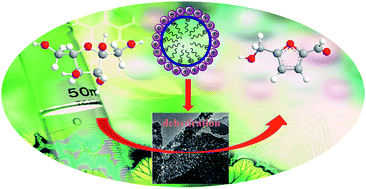
The catalytic dehydration of fructose to 5-hydroxymethylfurfural (HMF) in DMSO was performed over a sequence of mesoscopically assembled sulfated zirconium nanostructures (MASZN) derived from zirconyl chloride with a template as a fastening agent. The materials were characterized by X-ray diffraction, FTIR spectroscopy, NH3 temperature-programmed desorption, pyridine FTIR spectroscopy, field emission scanning electron microscopy, transmission electron microscopy, and N2 sorption. The heterogeneous catalyst MASZN with Lewis–Brønsted acid sites had a superior performance in the dehydration of fructose to HMF. With MASZN-3 as catalyst, a HMF yield of 91.9% with a 98.5% fructose conversion was obtained at 110 °C for 120 min in DMSO. Finally, the catalyst MASZN-3 was recycled in four consecutive cycles with scarcely any loss of activity. The excellent catalytic properties together with its easy synthesis, low cost, and nontoxic nature make this MASZN a promising catalyst for the development of new and efficient processes for biomass-based chemicals.


1. Introduction

With the diminishing supply of fossil fuels, much effort has been devoted to the search for innovative strategies and resources for the sustainable production of fuels and chemicals from renewable materials.1–4 Biomass with an estimated global production of around 1.0 × 10¹¹ Tons per year has received enormous attention due to its considerable potential as a raw material for the production of green fine chemicals, fuels and fuel additives.5–8 Carbohydrates are the major components of biomass. Thus it is highly desirable to convert carbohydrates to platform molecules selectively under mild conditions, which can subsequently be used for the production of various chemicals.

5-Hydroxymethylfurfural (HMF), a valuable biomass-derived platform compound, is usually derived from degradation of cellulose, and subsequent dehydration of saccharides, can be converted to numerous various chemical products9,10 and liquid fuel or fuel additives,11–14 potentially useful for fine chemicals, pharmaceuticals, the petroleum industry, and furanose-based polymers. This necessitates the development of sustainable processes for the conversion of biomass and carbohydrates into HMF to bridge the growing gap between supply and demand of energy and chemicals.15,16

In recent years, great progress has been made on effective routes for the synthesis of HMF from C6-based carbohydrates. High HMF yields were obtained from C6-based carbohydrates in various catalytic systems.17–20 Relative to other C6-based carbohydrates, the production of HMF from fructose is much easier because of the fact that the fructofuranoic structure is more reactive to dehydration. Therefore, fructose has always been chosen as an ideal model substrate to evaluate the performance of catalytic systems for biomass conversion.21 The traditional approach to the synthesis of HMF from fructose requires the use of homogeneous mineral acids, organic acids and ionic liquid.22–25 The use of homogeneous catalysts for biomass conversion has been extensively studied and is known to be highly effective. However, there are several drawbacks to this approach, including catalyst separation, reactor corrosion, and recyclability. In pursuit of economical, simple, efficient, and environmentally friendly HMF production process, various heterogeneous catalysts have been tested under different conditions, such as zeolites,26 functionalized silica,27 sulfonic acid-functionalized metal–organic frameworks (MOF-SO3H),28 heteropolyacids (HPAs),29 acidic TiO2 nanoparticles,30 biomass-derived sulfonated carbonaceous materials,31 and bifunctional SO4/ZrO2.32

Among these heterogeneous catalysts, solid acid ZrO2 is most widely used and has inspired great interest in carbohydrate dehydration systems. Their advantageous catalytic characteristics stem from not only the strength of the acid, but also the type of acidity33 (Brønsted and Lewis); therefore, enabling enhanced activity and selectivity. As a result, much attempt was previously devoted to synthesizing high active sulfated ZrO2 catalyst. Karen Wilson and co-workers used bifunctional sulfated zirconia as catalyst for the conversion of fructose and glucose to HMF in 8.3 and 6.8% yields, respectively.32 Although the bifunctional SO4/ZrO2 solid catalysts are promising in terms of recyclability and easy separation, they suffer from poor yield and selectivity. More recently, Yadong Yin reported the synthesis of sulfated ZrO2 hollow nanostructures with controllable physical and chemical properties and their catalytic application in the dehydration of fructose to HMF (64%).34

It has been demonstrated that catalytic systems that contain both Lewis and Brønsted acidity are more beneficial for HMF production than Lewis or Brønsted acidic catalysts alone.35 Herein, we report the synthesis of mesoscopically assembled sulfated zirconia nanoparticles (MASZN) with special physical and chemical properties and their catalytic application in the dehydration of fructose to 5-hydroxymethylfurfural (HMF). A high surface area facilitates the integration of the sulfate functionality and an open framework structure provides easy access to the active sites in the chemical reactions. The flexible synthetic procedure allows easy structural optimization and produces MASZN with higher catalytic performance than solid particles. The mesoporous nano-assemblies provided efficient catalytic reusability in the fructose reaction with negligible loss of activity.

2. Experimental

2.1. Chemicals

Anionic structure-directing agent CH3(CH2)11OSO3Na (SDS) and zirconyl chloride (ZrOCl2·8H2O), ammonia (NH3, 28%, aqueous solution), and nitric acid (HNO3, 60%), fructose (BR) were obtained from the Sinopharm Chemical Reagent Co. Ltd. (Shanghai, China). DMSO, 1-allyl-3-methylimidazolium chloride ([AMIM]Cl) and other chemicals (AR) are commercially available and used without further purification unless otherwise stated. Deionized water was produced by using a laboratory water-purification system (RO DI Digital plus).

2.2. Catalyst preparation

The synthesis involved two steps: (1) the synthesis of ZrO2 nanoparticles and (2) the fabrication of a mesoscopic nanoassembly architecture.
2.2.1 Preparation of a sol of uniform monodisperse ZrO2 nanoparticles. ZrO2 nanoparticles were prepared by using suitable modification of previous work published elsewhere.36 First of all, zirconium hydride Zr(OH)4 was synthesized by dissolving 3.22 g of zirconyl chloride (ZrOCl2·8H2O, 10 mmol) in 100 mL distilled water, followed by precipitation with ammonium hydroxide solution controlled at a pH of 10. The precipitate was repeatedly washed with distilled water till free of chloride and ammonium ions (using AgNO3 as test reagent). Then the precipitate was transferred to an aqueous acidic (HNO3) solution and was sonicated until a transparent nanoparticles sol was generated. The final pH of the solution was <1, and the generated particles remained highly dispersible without sedimentation for a prolonged period.
2.2.2 Preparation of MAZN. MAZN were constructed by using premade ZrO2 nanoparticles as building blocks. In the synthetic procedure, premade ZrO2 nanoparticles (1 mmol) were added to SDS solution (0.320 g, 1.1 mmol) in water (80 mL) at vigorous stirring at ambient temperature. The slurry was stirred for 2 h at ambient temperature, then stirred further in an oil bath at 353 K for 3 h and slowly cooled down to RT. The self-assembled nanoparticles were filtered and dried at 80 °C overnight, and then calcined at 873 K for 5 h in the presence of air to obtain template-free MAZN. This sample was designated as MAZN-1.

The other three materials were prepared by varying the molar ratio of the precursors, such as XZrO2/YSDS/ZH2O. In all these cases X = 1, and only Y and Z were varied. The four sets of variation were Y = 0.56, Z = 2224; Y = 0.28, Z = 1112; and Y = 0.14, Z = 556. The sample abbreviations were MAZN-2, MAZN-3, and MAZN-4, respectively.

2.2.3 Preparation of MASZN. Mesoporous sulfated zirconia was synthesized by treating 1 g of the above prepared calcined mesoporous zirconia sample twice with 15 mL of 1 N sulfuric acid followed by calcination in air at 833 K for 2 h.

2.3. Characterisation techniques

X-ray diffraction (XRD) analyses of the samples were performed by using a D8 Advance Bruker AXS diffractometer operated at 18 kW and calibrated with a standard silicon sample. XRD patterns were obtained using a X-ray diffractometer with Ni-filtered Cu-Kα (λ = 0.15406 nm) radiation and a beam voltage of 40 kV and 40 mA beam current.

Transmission electron micrographs (TEM) of catalysts were obtained by using a JEOL JEM model 2100 microscope operated at 200 kV. TEM images were obtained by using a CCD camera. Samples were dispersed in ethanol and a drop of the dispersion was placed on a carbon coated copper grid (300 mesh) and allowed to dry.

Field emission scanning electron microscopy (FESEM) micrographs were taken on a HITACHI S-4800 emission scanning microscope at an accelerating voltage of 3 kV with a beam current of 1 μA.

The Brunauer–Emmett–Teller (BET) surface areas were determined by N2 adsorption/desorption measurements (Micromeritics ASAP 2020) done at 77 K. Prior to the gas adsorption/desorption measurements, all samples were degassed at 473 K for 4 h to remove water and other physically adsorbed species. Surface areas were calculated using the Brunauer–Emmett–Teller (BET) method over the range P/P0 = 0.05–0.30, where a linear relationship was maintained. Pore size distributions were calculated using the Barrett–Joyner–Halenda (BJH) model.

NH3 temperature-programmed desorption (NH3-TPD) experiments were carried out on a chemisorption apparatus (Micromeritics; AutoChem II 2920) equipped with a TCD detector. Prior to the adsorption of NH3, ca. 100 mg sample was first preheated at 383 K under flowing He for 0.5 h to remove undesirable physisorbed species, followed by heating under He environment at 873 K for 1 h, then cooled to 393 K. Subsequently, the sample was exposed to flowing ammonia gas mixture (5% NH3 in He) for 1 h, then purged by He gas for 40 min to remove excessive physisorbed ammonia. All NH3-TPD profiles were carried out by ramping the temperature from 373 to 873 K at a rate of 10 K min−1.

The FTIR spectra of these samples were obtained by using an IR FTLA2000-104 spectrophotometer from ABB-Bomem Inc. FTIR spectra of adsorbed pyridine were also recorded on this spectrometer. Prior to the measurements, the catalysts were pressed in self-supporting disks and activated in the IR cell attached to a vacuum line at 300 °C for 4 h. Adsorption of pyridine (Py) was performed at 150 °C for 30 min. The excess of Py was further evacuated at 150 °C for 1 h in vacuum.

2.4. Catalytic reactions

The batch catalytic experiments were conducted in a 50 mL stainless steel autoclave with glass liner tube. Fructose (1 mmol) as substrate and 3 mL of DMSO as solvent were firstly added in the reactor and then 10 mg of catalyst was added into the mixture, the mixture was vigorously stirred at 110 °C for the desired duration of time. Under these conditions the mass transfer effect was eliminated. When the reaction was completed, the reactor was cooled to room temperature, the catalyst was separated by centrifugation and the post-reaction sample was diluted with deionized water, and analyzed by high-performance liquid chromatography (HPLC).

The liquid samples were analyzed with HPLC using a Agilent Alliance System instrument (1100 series) equipped with a refractive index detector and a UV detector, and a Shodex SUGAR SP0810 (300 × 8.0) columns for analysis. Deionized water was used as the eluent phase, with a flow rate of 0.7 mL min−1 and 70 °C column temperature. Product yields were calculated from response factors determined from multi-point calibration curves. Conversion of the reactant, yield and selectivity of the products were calculated as follows:

Conversion of reactant (%) = [Creactant,t=0Creactant]/Creactant,t=0 × 100%

Yield of product i (%) = Ci/Creactant,t=0 × 100%

Selectivity of product i (%) = Ci/[Creactant,t=0Creactant] × 100%
here, Ci is the molar concentration of species i.

3. Results and discussion

3.1. Catalyst characterisation

3.1.1 TEM and FE-SEM analysis. FE-SEM image of the mesoporous zirconia sample is shown in Fig. 1(a) and (b). As seen from the figure, this mesoporous zirconia material is composed of similar spherical particles, which shows a regular self-assembled arrangement. Since we sonicated the sample before the TEM measurement, these zirconia nanoparticles lost their regular self-assembled arrangement as seen in the TEM image. The TEM images confirmed the nano-size nature of synthesized ZrO2 particles (Fig. 1(c) and (d)). In the image, low electron density spots (pores) are seen throughout the specimen, and the particles of size approximately 7.0–8.0 nm are arranged in a regular mesoscopic order. Interparticle pores as seen in this image (low electron density spots) vary from 4.0 to 6.0 nm in the length scale. The TEM image shows that the powder sample consists of aggregated nanoparticles and estimated pore size were consistent with N2 adsorption/desorption measurements, as shown in Table 1. Otherwise, the nano singular structure (in Fig. 1(d)) may be result of the oriented aggregation of nanoparticles.37
image file: c4ra09585e-f1.tif
Fig. 1 (a and b) FE-SEM images of calcined samples MASZN-3. (c and d) TEM images of calcined samples MASZN-3 seen through the direction perpendicular to the pore axis.
Table 1 Physico-chemical properties of mesoscopic-assembly zirconia and sulfated zirconia nanoparticles
Entry Sample type Surface area [m2 g−1] Pore volume [cm3 g−1] Average pore size [nm] Acid concentrationa [mmol g−1]
a Acid concentration values were determined through NH3-TPD.
1 MAZN-1 124.2 0.283 5.91 0.032
2 MAZN-2 113.7 0.245 4.39 0.027
3 MAZN-3 102.8 0.214 4.36 0.018
4 MAZN-4 66.5 0.101 4.10 0.022
5 MASZN-1 92.7 0.175 5.73 0.124
6 MASZN-2 86.3 0.134 4.57 0.137
7 MASZN-3 95.4 0.203 4.19 0.165
8 MASZN-4 53.8 0.127 4.82 0.110


3.1.2 Powder X-ray Diffraction (XRD). The powder X-ray diffraction patterns for calcined self-assembled zirconia and sulfated self-assembled zirconia materials are shown in Fig. 2 and 3, respectively. The XRD results for both types of materials exhibited a mixture of well-resolved characteristic of monoclinic and tetragonal phases of individual ZrO2 nanoparticles.38–41 Calcined MAZN possessed a tetragonal phase, which is its major characteristic (Fig. 2). After sulfating integration, the monoclinic phase became more prominent, as observed in the Fig. 3. Thus, integrated sulfate ions had a strong influence on phase modification. Sulfate ions converted the metastable tetragonal phase to its more thermodynamically stable monoclinic phase.32 In the research, the particle sizes of catalysts were calculated by using the Scherrer equation. The estimated particle sizes varied from 7.0 to 8.0 nm (see the ESI). These results were in agreement with the TEM image analysis results (Fig. 1(c) and (d)). Otherwise, more monoclinic ZrO2 generated via calcination, which had been reported to exhibit predominantly Lewis acidity.42,43
image file: c4ra09585e-f2.tif
Fig. 2 Wide-angle PXRD patterns of mesoscopic-assembly zirconia samples: (a) MAZN-1, (b) MAZN-2, (c) MAZN-3; (d) MAZN-4 (*) monoclinic phase, (°) tetragonal phase.

image file: c4ra09585e-f3.tif
Fig. 3 Wide-angle PXRD patterns of sulfated samples: (a) MASZN-1, (b) MASZN-2, (c) MASZN-3; (d) MASZN-4 (*) monoclinic phase, (°) tetragonal phase.
3.1.3 N2 sorption studies. N2 sorption studies are important to determine the porous nature of the materials. In the current research, the BET surface area, average pore diameter and pore volume for the calcined and sulfated mesoporous MAZN are shown in Table 1 (entries 1–4 for the calcined MAZN and entries 5–8 for the MASZN). The BET surface area of the calcined MAZN-1, MAZN-2, MAZN-3, and MAZN-4 were 124.2, 113.7, 102.8, and 66.5 m2 g−1, respectively. The surface area of the MASZN-1, MASZN-2, MASZN-3 and MASZN-4 were 92.7, 86.3, 95.4 and 53.8 m2 g−1, respectively. These average pore sizes in Table 1 are consistent with the above-mentioned TEM experimental data. The pore volumes of the corresponding calcined materials decreased after the incorporation of the sulfate group, as shown in Table 1 (entries 5–8). Thus, the surface areas as well as the pore volumes of the calcined matrices decreased upon sulfate integration, which can be attributed to the dispersion of sulfate groups on the surface of the porous framework. Moreover, a kind of pore blocking can also occur.44 Material MASZN-3 acid site concentration of 0.165 mmol g−1 was estimated using the NH3-TPD. The higher acid site concentration of MASZN-3 could be attributed to a high external surface area because of the tiny nanoparticle morphology, large pore size, and high pore volume that expose a larger number of acid sites at the surface of the material, comparing with other MASZN materials.
3.1.4 FTIR spectroscopy. The IR spectra of the calcined and sulfated MASZN are shown in Fig. 4. The absence of bands at approximately ν = 2854 and approximately 2925 cm−1 in these samples, which are ascribed to the symmetric and asymmetric vibrations of the C–H groups, indicated the complete removal of SDS molecules after calcination. A broad band in the range of 3000–3600 cm−1 and 1620 cm−1 can be assigned to asymmetric OH stretching vibrations of the adsorbed water molecule, respectively.45
image file: c4ra09585e-f4.tif
Fig. 4 FTIR spectra of the sulfated samples: (a) MASZN-1, (b) MASZN-2, (c) MASZN-3 and (d) MASZN-4. In the inset, the FTIR spectra of MASZN-3 ranging from n = 1800 to 600 cm−1 are shown.

The spectral feature ranging from ν = 1400 to 900 cm−1 was very important in characterizing the presence of sulfate moieties in MASZN, and all MASZN materials exhibited almost similar spectral features. Vibrational bands are observed attributable to νs (S–O) at 1010, νas (S–O) at 1128, and νas (S[double bond, length as m-dash]O) at 1380 cm−1, consistent with bidentate or tridentate SO42−.46,47 This spectral investigation described the integration of sulfate moieties into the ZrO2 nanoparticles. The partial ionic nature of the S–O bonds was responsible for the strong Brønsted acidity of the sulfate-modified ZrO2 nanoparticles.48 The non-surface MAZN samples were also investigated by FTIR spectroscopy (see ESI, Fig. S4). When the mesoporous ZrO2 samples were directly calcined at 600 °C without introducing any sulfate ions, it shows only broad absorption bands in the range of 500–650 and 990–1250 cm−1 without any clear peaks related to the sulfate groups. The high surface area of the mesoporous MAZN facilitated the integration of the sulfate functionality to a suitable extent within its framework; hence, acid-catalyzed reactions were accelerated.

3.1.5 Acidity characterization by pyridine-IR spectroscopy and NH3-TPD. In order to gain more information about acid sites on the surface of these sulfate catalysts, the infrared spectra of pyridine adsorbed on the MASZN samples were recorded and the results were shown in Fig. 5. In the pyridine-adsorption FTIR spectrum, four peaks were observed in the region between 1400–1600 cm−1 due to C–C stretching vibrations of pyridine. The peak at 1450 cm−1 was assigned to pyridine adsorbed on Lewis acid sites; the peak at 1540 cm−1 and 1640 cm−1 are characteristic of pyridine adsorbed on Brønsted acid sites,49 whereas the band at 1495–1500 cm−1 is normally attributed to a combination band associated with both B- and L-sites. The results indicate that catalysts MASZN have Lewis–Brønsted acid sites simultaneously. NH3-TPD experiments were conducted to determine the relative strengths of acid sites of MASZN-3 (see ESI, Fig. S1). In this profile, a major desorption occurred between 250 to 500 °C, and one broad peak centered at 355 °C was observed. Compared to the desorption peak observed for sulfated zirconia supported over mesoporous silica at 257 °C,50 our self-assembled mesoporous sulfated zirconia sample showed a peak at much higher temperature (355 °C). This peak (TCD signal maxima) can be assigned because of the formation of strongly bound (chemisorbed) ammonia on highly acidic sulfated zirconia surface.
image file: c4ra09585e-f5.tif
Fig. 5 FTIR spectra of pyridine adsorbed over MASZN: (a) MASZN-1, (b) MASZN-2, (c) MASZN-3 and (d) MASZN-4.

3.2. Catalytic study

3.2.1 Dehydration of fructose over MAZN and MASZN. The catalytic dehydration of fructose to HMF in DMSO using MAZN and MASZN as catalysts at 110 °C was investigated. Fig. 6 shows the reaction results of the MAZN and MASZN samples varying the molar ratio of XZrO2/YSDS/ZH2O, respectively. Obviously, catalytic performance of the catalysts was noticeably affected by the molar ratio of precursors. The MAZN-1 and MASZN-3 have the superior performance in conversion of fructose into HMF among the series of MAZN materials. When the reaction was carried out at 110 °C, the results showed that the catalyst MASZN-3 gave the highest yield of HMF, which is closely related with its structure and surface acidity. The sample MASZN-3 is mesoporous, and it has the higher BET surface area and the highest concentration of acid sites (entry 7, Table 1). The Fig. 6(c) also indicates that HMF yield monotonously increases with the reaction time, attaining the maximum value of 91.9% after 120 min. Nevertheless, higher reaction times barely improve the formation of HMF, possibly due to the preferential formation of soluble polymers and humins, as well as the deposition of residues formed from intermediates condensation on the active sites.
image file: c4ra09585e-f6.tif
Fig. 6 Fructose transformation into HMF using mesoscopic assembly zirconia and sulfated zirconia nanoparticles as catalysts. Reaction conditions: initial reactant (1 mmol), catalysts (10 mg), solvents system DMSO (3 mL), 110 °C.
3.2.2 Effect of reaction temperature and MASZN-3 loading on dehydration. Temperature and dosage of catalyst as the most critical parameters were initially investigated in the systematic evaluation process. To confirm the best conditions, the degradation of fructose in DMSO media was studied. Firstly, the influence of the temperature on the catalytic reaction has been evaluated by using the MASZN-3 catalyst. The catalytic results reflect that HMF yield rises with increase of temperature and time at first, achieving a value close to 92% at 110 °C (Fig. 7(a)). Then the drastic decreasing in HMF yield from 110 to 130 °C can be explained by the rapid formation of humins on the catalyst surface, thus covering some acid sites and limiting the transformation of fructose; in fact, the catalyst became brown after 20 min of reaction at the highest temperature (130 °C). As is shown in Fig. 7(a), both too high temperature and too long time were not conducive to the stability of HMF due to the side reaction. The highest yield of HMF was 91.9% obtained at 110 °C for 120 min. From these date, 110 °C was considered as optimal reaction temperature to study other parameters of the catalytic process.
image file: c4ra09585e-f7.tif
Fig. 7 (a) Effect of the reaction temperature on the yield of HMF from the dehydration of fructose catalyzed by MASZN-3. Conditions: fructose (1 mmol), DMSO (3 mL), MASZN-3 weight (10 mg); (b) results of the experiment into the dosage of MASZN-3 on the direct transformation of fructose into HMF in DMSO. Conditions: fructose (1 mmol), DMSO (3 mL), T = 110 °C, reaction time: all reactions were performed at the same catalyst space time; blue bar: HMF yield, red bar: fructose conversion.

Next, the influence of the MASZN-3 loading at 110 °C for 120 min was evaluated. The variation of the amount of catalyst (5–15 mg) shows that the fructose conversion barely improves with increasing MASZN-3 loading, possibly as a consequence of the higher activity of MASZN-3 in conversion of fructose in DMSO (Fig. 7(b)). When the dosage of MASZN-3 was 10 mg, the reaction time was setted as 2 h. The other reactions would be conducted at the same catalyst space time (e.g. for double the amount of catalyst taking half the reaction time). Initially, the HMF yield augments with the increase of catalyst weight. However, when the loading of MASZN-3 is above 10 mg, the HMF yield begins to monotonically decrease, while the dosage of MASZN-3 increases, thus meaning that the increased amounts of catalyst has not facilitated the transformation of fructose into HMF but into undesired products such as soluble polymers and humins.

3.2.3 HMF synthesis from various substrates. The promising catalytic activity of the mesoporous MASZN for fructose dehydration has prompted us to test the effectiveness of this catalyst for HMF synthesis from glucose and other carbohydrate such as sucrose, inulin in [AMIM]Cl.

The reaction conditions of glucose, sucrose, inulin dehydration reactions and corresponding HMF yields, conversions and HMF selectivity were summarized in Table 2. Under comparable reaction conditions, MASZN-3 catalyzed reaction in DMSO from fructose produced 72.8%, 91.9%, and 73.7% HMF for various reaction time, respectively (entries 1–3, Table 2). These results clearly indicates that mesoporous MASZN-3 is an effective catalyst for HMF synthesis from fructose. Several experiments were designed for screening the catalytic effectiveness of various MASZN catalysts for HMF production from glucose in [AMIM]Cl, and MASZN-2 was regarded as the optimized catalyst, leading to 67.8% of glucose conversion, 15.4% of HMF yield and 22.7% of HMF selectivity; this activity could be assigned to the participation of the Lewis and Brønsted acid sites. When MASZN-3 acted as catalyst, 43.7% and 54.8% HMF yields were achieved from sucrose and inulin dehydration in [AMIM]Cl, respectively. Under identical reaction conditions, glucose dehydration reaction produced less HMF than that of sucrose dehydration reaction. The probable reason is that sucrose is a disaccharide consisting of glucose and fructose, and only the ketose product (fructose) could efficiently convert into HMF.

Table 2 Conversion, yield and product selectivity following sugars dehydration over mesoscopic assembly zirconia and sulfated zirconia nanoparticlesa
Entry Substrate Catalysis t (min) T (°C) Conversion (%) HMF yieldb (%) HMF selectivity (%)
a Conditions: initial reactant (1 mmol), each catalyst is 10 mg; solvent of fructose is DMSO (3 mL); solvent of other sugar is [AMIM]Cl (3 mL).b HMF yield was equal to mol (HMF)/mol (total monomer).
1 Fructose MASZN-3 30 110 97.1 72.8 75.0
2 Fructose MASZN-3 120 110 98.5 91.9 92.9
3 Fructose MASZN-3 180 110 99.6 73.7 74.0
4 Glucose MASZN-1 60 120 42.6 5.6 13.1
5 Glucose MASZN-2 60 120 67.8 15.4 22.7
6 Glucose MASZN-3 60 120 45.2 7.4 16.3
7 Glucose MASZN-4 60 120 49.5 9.2 18.6
8 Sucrose MASZN-3 180 120 98.8 43.7 44.2
9 Inulin MASZN-3 120 110 95.3 54.8 57.5


3.2.4 Catalyst recycles. The stability of the MASZN catalysts as well as the heterogeneous nature of the catalysis were tested by recycling the catalyst. The hot filtration of a MASZN-3 catalyst solution in optimized reaction conditions allowed the separation of the solid catalyst, which was then reused with fresh reagents in the same reaction conditions.

No loss of catalytic activity was observed. After each catalytic run the catalyst was recovered by filtration, washed thoroughly with methanol, and drying in an oven at 373 K overnight. The catalyst was subsequently activated at 473 K for 4 h under air flow, and was then utilized for the following reaction. In all four consecutive catalytic runs, the HMF yield remained constant at about 90–92% for 2 h, as shown in Fig. 8(a). Otherwise, the loss of activity of the catalyst, in terms of conversion of fructose, after four cycles was negligible (Fig. 8(b)). The loss of activity was mainly caused by the formation of carbon deposition on the catalyst surface. This clearly demonstrates that the catalytic performance of the MASZN-3 is preserved in the consecutive runs, and that the catalyst system is highly suitable for reuse. Thus, the sulfated mesoporous MASZN described herein have a great potential to be used as a stable and highly active recyclable solid acid catalyst in biomass dehydration.


image file: c4ra09585e-f8.tif
Fig. 8 (a) HMF yields in various runs, upon catalyst recycling for transformation of fructose with DMSO by using sulfated MASZN-3 catalyst. (b) Recyclability study of the MASZN-3 catalyst for the conversion of fructose. Reaction conditions: fructose (1 mmol), catalysts (10 mg), solvents system DMSO (3 mL), 110 °C.

4. Conclusions

In summary, we have presented a synthesis route for mesoscopically assembled sulfated zirconia nanoparticles with an average diameter of ca. 5.0 nm and high crystalline pore walls of mesoscopic order through evaporation-induced self-assembly method using SDS as the template. The presence of sulfonic acid groups and Lewis acidic ZrO2 in the material has been confirmed by FTIR and pyridine-desorption FTIR spectroscopy, NH3 temperature-programmed desorption, XRD, FESEM, TEM, and N2 adsorption/desorption. The total surface acid density of MASZN-3 was 0.165 mmol g−1. The material shows a good catalytic activity for the dehydration of biomass-derived glucose, sucrose, and inulin to 5-hydroxymethylfurfural (HMF), which enables maximum yields of 21.5, 43.7, and 54.8%, respectively, in a [AMIM]Cl solvent system. MASZN-3 catalyst has demonstrated to be the most active, exhibiting high fructose conversion (98.5%) and HMF yield (91.9%) at 110 °C and after 120 min of reaction time in DMSO. The recyclability experiments show that the catalyst retained full activity after four consecutive cycles, and the loss in activity, in terms of HMF yield, was only 2%. These newly discovered mesoscopically assembled sulfated zirconia nanoparticles for biomass conversion open up a new avenue of cost effective biomass refinery processes toward the production of affordable biochemicals and biofuels.

Acknowledgements

The authors are grateful to the National Natural Science Foundation of China (21206057), the Natural Science Foundation of Jiangsu Province, China (BK2012118) and (BK2012547), and MOE & SAFEA for the 111 Project (B13025) for financial support.

Reference

  1. Y.-S. Jang, B. Kim, J. H. Shin, Y. J. Choi, S. Choi, C. W. Song, J. Lee, H. G. Park and S. Y. Lee, Biotechnol. Bioeng., 2012, 109, 2437 CrossRef CAS PubMed.
  2. A. I. Rushdi, K. F. Al-Mutlaq, S. K. Sasmal and B. R. T. Simoneit, Fuel, 2013, 103, 970 CrossRef CAS PubMed.
  3. D. M. Alonso, J. Q. Bond and J. A. Dumesic, Green Chem., 2010, 12, 1493 RSC.
  4. P. N. Vennestrom, C. M. Osmundsen, C. H. Christensen and E. Taarning, Angew. Chem., Int. Ed., 2011, 50, 10502 CrossRef CAS PubMed.
  5. A. Corma, S. Iborra and A. Velty, Chem. Rev., 2007, 107, 2411 CrossRef CAS PubMed.
  6. P. Daorattanachai, P. Khemthong, N. Viriya-empikul, N. Laosiripojana and K. Faungnawakij, Carbohydr. Res., 2012, 363, 58 CrossRef CAS PubMed.
  7. S. Singh, M. A. Nahil, X. Sun, C. Wu, J. Chen, B. Shen and P. T. Williams, Fuel, 2013, 105, 585 CrossRef CAS PubMed.
  8. A. J. Ragauskas, C. K. Williams, B. H. Davison, G. Britovsek, J. Cairney, C. A. Eckert, W. J. Frederick Jr, J. P. Hallett, D. J. Leak, C. L. Liotta, J. R. Mielenz, R. Murphy, R. Templer and T. Tschaplinski, Science, 2006, 311, 484 CrossRef CAS PubMed.
  9. J. Lewkowski, ARKIVOC, 2001, 17 Search PubMed.
  10. Y. Román-Leshkov, J. N. Chheda and J. A. Dumesic, Science, 2006, 312, 1933 CrossRef PubMed.
  11. G. Tian, R. Daniel, H. Li, H. Xu, S. Shuai and P. Richards, Energy Fuels, 2010, 24, 3898 CrossRef CAS.
  12. S. Zhong, R. Daniel, H. Xu, J. Zhang, D. Turner, M. L. Wyszynski and P. Richards, Energy Fuels, 2010, 24, 2891 CrossRef CAS.
  13. J. P. Lange, E. van der Heide, J. van Buijtenen and R. Price, ChemSusChem, 2012, 5, 150 CrossRef CAS PubMed.
  14. M. J. Climent, A. Corma and S. Iborra, Green Chem., 2014, 16, 516 RSC.
  15. J. B. Binder and R. T. Raines, J. Am. Chem. Soc., 2009, 131, 1979 CrossRef CAS PubMed.
  16. T. Wang, M. W. Nolte and B. H. Shanks, Green Chem., 2014, 16, 548 RSC.
  17. H. Yan, Y. Yang, D. Tong, X. Xiang and C. Hu, Catal. Commun., 2009, 10, 1558 CrossRef CAS PubMed.
  18. Q. Zhao, L. Wang, S. Zhao, X. Wang and S. Wang, Fuel, 2011, 90, 2289 CrossRef CAS PubMed.
  19. H. Zhao, J. E. Holladay, H. Brown and Z. C. Zhang, Science, 2007, 316, 1597 CrossRef CAS PubMed.
  20. M. Dashtban, A. Gilbert and P. Fatehi, RSC Adv., 2014, 4, 2037 RSC.
  21. R. Liu, J. Chen, X. Huang, L. Chen, L. Ma and X. Li, Green Chem., 2013, 15, 2895 RSC.
  22. Y.-N. Li, J.-Q. Wang, L.-N. He, Z.-Z. Yang, A.-H. Liu, B. Yu and C.-R. Luan, Green Chem., 2012, 14, 2752 RSC.
  23. Z. Kelemen, O. Hollóczki, J. Nagyc and L. Nyulászi, Org. Biomol. Chem., 2011, 9, 5362 CAS.
  24. J. O. Metzger, Angew. Chem., Int. Ed., 2006, 45, 696 CrossRef CAS PubMed.
  25. T. Buntara, S. Noel, P. H. Phua, I. Melian-Cabrera, J. G. de Vries and H. J. Heeres, Angew. Chem., Int. Ed., 2011, 50, 7083 CrossRef CAS PubMed.
  26. J. González-Rivera, I. R. Galindo-Esquivel, M. Onor, E. Bramanti, I. Longo and C. Ferrari, Green Chem., 2014, 16, 1417 RSC.
  27. A. J. Crisci, M. H. Tucker, M.-Y. Lee, S. G. Jang, J. A. Dumesic and S. L. Scott, ACS Catal., 2011, 1, 719 CrossRef CAS.
  28. J. Chen, K. Li, L. Chen, R. Liu, X. Huang and D. Ye, Green Chem., 2014, 16, 2490 RSC.
  29. S. Zhao, M. Cheng, J. Li, J. Tian and X. Wang, Chem. Commun., 2011, 47, 2176 RSC.
  30. C.-H. Kuo, A. S. Poyraz, L. Jin, Y. Meng, L. Pahalagedara, S.-Y. Chen, D. A. Kriz, C. Guild, A. Gudz and S. L. Suib, Green Chem., 2014, 16, 785 RSC.
  31. X. Qi, H. Guo, L. Li and R. L. Smith Jr, ChemSusChem, 2012, 5, 2215 CrossRef CAS PubMed.
  32. A. Osatiashtiani, A. F. Lee, D. R. Brown, J. A. Melero, G. Morales and K. Wilson, Catal. Sci. Technol., 2014, 4, 333 CAS.
  33. T. Wang, Y. J. Pagán-Torres, E. J. Combs, J. A. Dumesic and B. H. Shanks, Top. Catal., 2012, 55, 657 CrossRef CAS.
  34. J. B. Joo, A. Vu, Q. Zhang, M. Dahl, M. Gu, F. Zaera and Y. Yin, ChemSusChem, 2013, 6, 2001 CrossRef CAS PubMed.
  35. E. Nikolla, Y. Román-Leshkov, M. Moliner and M. E. Davis, ACS Catal., 2011, 1, 408 CrossRef CAS.
  36. A. S. Deshpande, N. Pinna, P. Beato, M. Antonietti and M. Niederberger, Chem. Mater., 2004, 16, 2599 CrossRef CAS.
  37. H. Z. Cui, J. Q. Sun and Y. Wang, Mater. Rev., 2009, 23, 138 Search PubMed.
  38. H. Chen, J. Shi, Z. Liu, J. Gao, M. Ruan and D. Yan, Adv. Mater., 2005, 17, 2010 CrossRef CAS.
  39. B. M. Reddy, P. M. Sreekanth and P. Lakshmanan, J. Mol. Catal. A: Chem., 2005, 237, 93 CrossRef CAS PubMed.
  40. J. R. Sohn, T.-D. Kwon and S.-B. Kim, Bull. Korean Chem. Soc., 2001, 22, 1309 CAS.
  41. Y.-S. Hsu, Y.-L. Wang and A.-N. Ko, J. Chin. Chem. Soc., 2009, 56, 314 CAS.
  42. C. M. Vera Bolis, M. Volante, L. Orio and B. Fubini, Langmuir, 1990, 6, 695 CrossRef.
  43. V. Bolis, G. Cerrato, G. Magnacca and C. Morterra, Thermochim. Acta, 1998, 312, 63 CrossRef CAS.
  44. M. K. Bhunia, S. K. Das, P. Pachfule, R. Banerjee and A. Bhaumik, Dalton Trans., 2012, 41, 1304 RSC.
  45. S. K. Das, M. K. Bhunia, M. Motin Seikh, S. Dutta and A. Bhaumik, Dalton Trans., 2011, 40, 2932 RSC.
  46. S. J. HUG, J. Colloid Interface Sci., 1997, 188, 415 CrossRef CAS.
  47. F. Haase and J. Sauer, J. Am. Chem. Soc., 1998, 120, 13503 CrossRef CAS.
  48. T. Yamaguchi, T. Jin and K. Tanabe, J. Phys. Chem., 1986, 90, 3148 CrossRef CAS.
  49. F. Babou, G. coudurier and J. C. Vedrine, J. Catal., 1995, 152, 341 CrossRef CAS.
  50. X.-R. Chen, Y.-H. Ju and C.-Y. Mou, J. Phys. Chem. C, 2007, 111, 18731 CAS.

Footnote

Electronic supplementary information (ESI) available. See DOI: 10.1039/c4ra09585e

This journal is © The Royal Society of Chemistry 2014