BSA-conjugated CdS/Ag2S quantum dots: synthesis and preliminary antineoplastic assessment

Sha-Sha Wua, Jian-Zhou Zhangb, Xue-Hong Yua, Ying Cao*a and Hua-Jie Wang*ac
aCollaborative Innovation Center of Henan Province for Green Manufacturing of Fine Chemicals, Key Laboratory of Green Chemical Media and Reactions, Ministry of Education, School of Chemistry and Chemical Engineering, Henan Normal University, Xinxiang, Henan 453007, P. R. China. E-mail: wanghuajie972001@163.com; Fax: +86-373-3328507; Tel: +86-373-3326335
bDepartment of Environmental Engineering and Chemistry, Luoyang Institute of Science and Technology, No. 90, Wangcheng Road, Luoyang 471023, P. R. China
cXinxiang R&J Chemistry and Biotechnology Co. Ltd, No. 1 Chuangye Road, High-Tech Development Zone, Xinxiang 453003, People's Republic of China

Received 31st August 2014 , Accepted 7th November 2014

First published on 7th November 2014


Abstract

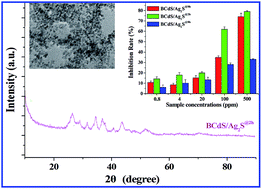
Tumours are one of the most difficult diseases to cure, and traditional chemotherapy drugs are always intimidating for use in tumour treatments because of their highly toxic side effects. This drives the research and development of innovative drugs. As a product, nanomaterials, particularly nano-drugs, are exhibiting great potential for use in tumour treatments. Based on the understanding of the Trojan horse-antineoplastic mechanism of nano-drugs, we tried to introduce the drug-combination opinion into nano-drugs and successfully developed a facile and eco-friendly synthesis route to fabricate bovine serum albumin-conjugated CdS/Ag2S quantum dots. It is notable that the double metallic sulphides showed a synergistic inhibition between Cd2+ and Ag+ on rat pheochromocytoma (PC 12) cells. Summarily, the present study substantiated the potential of synergistic anti-cancer opinion at the design of innovative nano-drugs with higher antineoplastic activity.
1. Introduction

Given the inadequacies of traditional strategies for tumour treatments (i.e., chemotherapy), nanotechnology, one of the frontier sciences, offers new hope to tumour patients.1–6 Because of the excellent optic properties and anti-cancer activity, interest in the applications of semi-conductor sulphides nanomaterials in the medical field is now growing.7–9

Typically, Singh et al. found that CdS quantum dots could induce reactive oxygen species-mediated apoptotic cell death in prostate cancer cells.10 In particular, several groups, including ours, have previously demonstrated that some semi-conductor sulphides nanomaterials could directly kill tumour cells by inducing cell physiological functional disorder.8,11,12 Moreover, the size, crystal structure and surface reactivity of nanomaterials were reported to have strong ties to their structure–function relationships.11–14

Among the structure–function relationships, the composition of nanomaterials will produce a great effect on their functions. Based on the understanding of the Trojan horse-antineoplastic mechanism of nano-drugs, we tried to introduce the drug-combination opinion into nano-drugs and to develop a facile and eco-friendly synthesis route to fabricate bovine serum albumin (BSA)-conjugated CdS/Ag2S (BCdS/Ag2S) quantum dots. Here, albumin is a water-soluble and globular protein, and one of the most abundant proteins. Moreover, albumin has been documented to be a biocompatible chemical and is widely applied for clinical use.15,16 The biomimetic technique allows the synthesis of nanomaterials in the presence of biomolecules under mild conditions.11,12 Therefore, BSA was chosen as the structure-directing molecule to control the size of quantum dots via the biomimetic synthesis route. In addition, the cooperation inhibition between Cd and Ag was tested using PC 12 cells as the model cells.

2. Material and methods

2.1 Materials

Silver nitrate (≧99.8%, Mw = 169.87 AR) and cadmium chloride (≧99%, Mw = 183.32 AR) were purchased from Tianjin Chemical Reagent Factory (Tianjin, China). Bovine serum albumin (≧98%, Mw = 68[thin space (1/6-em)]000) was purchased from Xiamen Sanland Chemicals Company Limited (Xiamen, China). All other solvents and chemicals were of analytical grade.

2.2 Biomimetic synthesis of BSA-conjugated CdS nanocomposites

The biomimetic technique was used to synthesize BSA-conjugated CdS nanocomposites according to our previous work, and with minor changes.17 In brief, 40 mL of a 9.15 mg mL−1 cadmium chloride solution was added dropwise into 20 mL of 1.0 mg mL−1 BSA solution while stirring. The mixed solution was allowed to remain static for 12 h. Then, it was quickly poured into 20 mL of a 3.75 mg mL−1 thioacetamide solution; the reactive system was kept at room temperature for 3 days. The precipitate was separated by centrifugation at 13[thin space (1/6-em)]040g for 10 min, quickly washed 3 times with the double-distilled water, and dried in a vacuum freeze-drying for 24 h.

2.3 Ion exchange for fabrication of BCdS/Ag2S quantum dots

The BCdS/Ag2S quantum dots were fabricated using the ion-exchange method under green and mild conditions. Typically, 28.8 mg of the BSA-conjugated CdS product was ultrasonically dispersed in 20 mL of a 17 mg mL−1 silver nitrate solution. After 4 h of exchange at room temperature, the as-prepared product was separated using the centrifugation at 13[thin space (1/6-em)]040g for 10 min, quickly washed 3 times with the double-distilled water, and vacuum-freeze dried for 2 days.

2.4 Characterization

The morphology of quantum dots was observed by a transmission electron microscope with a working voltage of 200 kV (TEM, JEOL-100CX, JEOL, Japan). The sample was ultrasonically dispersed into a mixing solution of alcohol and double-distilled water (v[thin space (1/6-em)]:[thin space (1/6-em)]v = 1[thin space (1/6-em)]:[thin space (1/6-em)]1). A 5 μL droplet was added on a carbon-coated copper grid, and vacuum dried for further microscopic examination.

The organic component was confirmed by Fourier transform infrared spectrograph analysis (FTIR, FTS-40, Bio-Rad Laboratories, Hercules, CA, USA). The FTIR sample was prepared by pressing quantum dots and KBr into pellets with a 3[thin space (1/6-em)]:[thin space (1/6-em)]100 ratio. The scanning wave number ranged from 4000 cm−1 to 400 cm−1, and the spectra were collected at a 2 cm−1 resolution with 128 scans.

The inorganic components were certified using a Bruker D and advance X-ray diffractometer with graphite monochromatized Cu/Kα (γ = 0.15406 nm). The pattern range was from 2θ 0° to 90° and the scanning rate was 0.05° s−1.

Additionally, the organic component content was measured on an EXSTAR TG/DTA 6300 instrument (Seiko, Japan) at a heating rate of 10 °C min−1 in an oxygen atmosphere. The content of inorganic component was determined using atomic adsorption spectroscopy (AAS, Z-5000, Hitachi, Tokyo, Japan).

2.5 Synergistic anti-cancer effects

2.5.1 Exposure of PC 12 cells to nanocomposites. PC 12 cells were chosen as the model and routinely cultured using the High Glucose-Dulbecco Modified Eagle medium (H-DMEM), supplemented with 10% fetal bovine serum. The logarithmic phase cells were released and seeded in a 96-well tissue culture plate at the density of 104 cells per cm2. 4 h later, the medium was refreshed with the fresh H-DMEM medium containing 0.5–500 ppm nanocomposites. Moreover, the nanocomposites had been sterilized by UV radiation for 20 min and immersed into the medium for 1 h prior to that.
2.5.2 Cell viability analysis. After exposing PC 12 cells to nanocomposites for 48 h, the cell medium was removed, and the cells were washed with phosphate buffered solution (PBS, pH 7.2, and 0.1 M). Then, 200 μL H-DMEM medium containing 10% 3-(4,5-dimethylthiazol-2-yl)-2,5-diphenyl tetrazolium bromide assay (MTT) was added and another 4 h process of cell culture was carried out. Following that, the solution was replaced with 200 μL of dimethyl sulfoxide and the optical density (OD) of each well was read on a Mutiskan MK3 microplate reader (Thermo Labsystems, USA). The inhibition rate of nanocomposites on cells could be calculated using the following equation:
Inhibition rate = (ODc − ODt)/ODc × 100%
where ODc and ODt represent the OD 490 nm values of the control group and treatment group, respectively.
2.5.3 Cell proliferation observation. At the same time, the number and distribution of attached cells after exposure to nanocomposites for 48 h were visualized using a microscopic technique. Before observation, the cells were rinsed in PBS, and stained with acridine orange florescent dye for 5 min. Then, the cells were counted on a fluorescence microscope (Aioskop 40, Carl Zeiss, Gottingen, Germany).18
2.5.4 Cell morphology and membrane damage. The LDH analysis was firstly applied to probe membrane integrity post-nanocomposite treatment. Briefly, after exposure to 20 ppm of different nanocomposites for 48 h, the LDH release from PC 12 cells was quantified using a LDH assay kit (Sigma-Aldrich inc., St. Louis, MO, USA) according to the protocol, and OD values at 490 nm were measured on a microplate reader. Here, 100% LDH leakage was performed using the lysis solution to treat PC 12 cells.

In addition, scanning electron microscopy (SEM, JSM6390LV, JEOL, Japan) was also used to observe the cell morphologies and membrane damage. Cells were immersed into 2.5% glutaraldehyde solution and allowed to stand in the fixative at 4 °C for over 2 h. Following a standard dehydration in ethanol graded series, the samples were attached on stubs, vacuum-coated with gold, and examined by SEM.

2.6 Statistics

All data represent mean ± SD; the number of independent replications is shown individually for each experiment. The analysis of data was carried out by one-way factorial analysis of variances (ANOVA) and multiple comparisons (Fisher's method as post hoc test, p < 0.05).

3. Results

The BCdS/Ag2S quantum dots were abbreviated as BCdS/Ag2S@0h, BCdS/Ag2S@2h, BCdS/Ag2S@4h, and BCdS/Ag2S@8h, respectively, according to their ion-exchange time, aiming at clear presentation of the data.

3.1 Construction of the green synthesis route of BCdS/Ag2S quantum dots

Fig. 1 shows the XRD patterns of BSA-conjugated CdS precursors (BCdS/Ag2S@0h) and the final products. It can be seen that the diffraction pattern of the precursors is consistent with that of a hexagonal CdS phase (JSPDS no. 41-1049) and the characteristic peaks appear at 2θ 26.6°, 44.1° and 51.9°, corresponding to the three crystal planes of (111), (220) and (311), respectively.10,19,20 As for the ion-exchange products, the characteristic peaks of Ag2S can be detected and are located at 2θ 26.0°, 29.0°, 31.5°, 34.5°, 40.7°, 53.1°, and 63.7°, which match well with monoclinic Ag2S (JSPDS no. 65-2356).21
image file: c4ra09526j-f1.tif
Fig. 1 XRD patterns of the BCdS/Ag2S quantum dots obtained by an ion exchange technique for different reaction times using BSA-conjugated CdS as the precursor (BCdS/Ag2S@0h).

Fig. 2 displays the FTIR spectrum of the BCdS/Ag2S@0h quantum dots. The adsorption peaks at 3173 cm−1, 2953 cm−1, 1650 cm−1, and 1515 cm−1 can be attributed to the stretching vibration of hydroxyl group, amide A′, amide I, and amide II of BSA, respectively.11


image file: c4ra09526j-f2.tif
Fig. 2 FTIR spectrum of the BCdS/Ag2S@0h quantum dots.

Fig. 3 shows the TG/DSC curves of the BCdS/Ag2S@0h quantum dots. In general, the total weight loss of the quantum dots changes to 18.5% from 250 °C to 650 °C according to the TG curve. In the DSC curve, there are one endothermic peak and three exothermic peaks. The endothermic DSC peak at 91 °C corresponds to water evaporation. The first exothermic phase ranges from 250 °C to 420 °C and belongs to the carbonization process of BSA. The second stage is the side chain-burning process of BSA, ranging from 420 °C to 560 °C. The last exothermic process varies from 560 °C to 660 °C, corresponding to the main carbon-burning.22


image file: c4ra09526j-f3.tif
Fig. 3 TG/DSC curves of the BCdS/Ag2S@0h quantum dots.

Fig. 4 shows the Cd and Ag contents in different BCdS/Ag2S quantum dots. With the prolongation of the ion-exchange time, the Cd content decreases from 64.2% to 1.29%. On the contrary, the Ag content increases from 0% to 27.4%.


image file: c4ra09526j-f4.tif
Fig. 4 Cd and Ag content change of BCdS/Ag2S quantum dots obtained by an ion exchange method with different reaction times determined by atomic absorption spectroscopy.

Fig. 5 indicates the morphology and size of the BCdS/Ag2S@2h quantum dots. The sample has a spherical structure and the particle size is 6.1 nm ± 1.5 nm average diameters (Fig. 5A). In addition, the quantum dots are well dispersed and show a special UV adsorption peak at 204 nm and a fluorescence emission peak at 530 nm (Fig. 5C and D). However, the resulting products obtained in the absence of BSA are irregular and have bulk characteristics (Fig. 5B).


image file: c4ra09526j-f5.tif
Fig. 5 The TEM images of the BCdS/Ag2S@2h quantum dots (A) and control prepared in the absence of BSA (B). The optical properties of the BCdS/Ag2S@2h quantum dots, (C) UV spectra and (D) fluorescent emission spectra.

Fig. 6 shows the metabolic viability of PC 12 cells after exposure to different BCdS/Ag2S quantum dots for 48 h. This was determined by the MTT method, which was associated with the mitochondrial function.23 In general, the cell viability is significantly inhibited after exposure to the quantum dots in a dose-dependent manner. However, the antineoplastic activity of the BCdS/Ag2S quantum dots differ with the ratio change of Cd/Ag. The IC50, defined as the killing concentration that induces 50% inhibition, approaches 287 ppm, 195 ppm, and 598 ppm.


image file: c4ra09526j-f6.tif
Fig. 6 The inhibition rate of BCdS/Ag2S@0h, BCdS/Ag2S@2h, and BCdS/Ag2S@8h quantum dots on the metabolism of rat pheochromocytoma cell line PC 12 measured by the MTT method.

Fig. 7 displays the number and distribution of PC 12 cells after exposure to different BCdS/Ag2S quantum dots for 48 h. In the control group, the cells form an almost consistent layer and the cell number is the highest (Fig. 7A). The cells develop a spindle-like morphology. The cell nuclei are green due to the binding of acridine orange to DNA, and the cytoplasm is orange due to the binding of acridine orange to RNA. After exposure to different BCdS/Ag2S quantum dots, the cell number and morphologies change greatly. In the BCdS/Ag2S@0h group and BCdS/Ag2S@2h group (20 ppm), the cell number decreases significantly. In particular, most cells lose their characteristic morphology and assume a spherical shape (Fig. 7B and C). Their nuclei also lose the green colour and turn dark. The cytoplasm is yellow. In the BCdS/Ag2S@8h group, the cell number significantly decreases, but their morphology undergoes no obvious change (Fig. 7D).


image file: c4ra09526j-f7.tif
Fig. 7 The number and distribution of PC 12 cells after exposure to 20 ppm of BCdS/Ag2S quantum dots for 48 h. (B) BCdS/Ag2S@0h, (C) BCdS/Ag2S@2h, and (D) BCdS/Ag2S@8h. Here, the group without any addition was chosen as the control (A). The magnification was 100×.

The LDH analysis was performed to probe membrane integrity post-QD treatment. As shown in Fig. 8, 20 ppm of BCdS/Ag2S@0h and BCdS/Ag2S@2h induce a significant increase of LDH release in PC 12 cells compared with the control. The treatment of cells with BCdS/Ag2S@8h at 20 ppm does not cause significant LDH leakage compared to the control.


image file: c4ra09526j-f8.tif
Fig. 8 LDH release of PC 12 cells after exposure to BCdS/Ag2S@0h, BCdS/Ag2S@2h, and BCdS/Ag2S@8h for 48 h. Here, 100% LDH leakage was performed using the lysis solution to treat PC 12 cells.

Fig. 9 is a closer observation by SEM on PC 12 cells after exposure to different BCdS/Ag2S quantum dots for 48 h. In the control group, cells produce numerous filopodia and communicate with each other, and the cell membrane remains integrated (Fig. 9A). In the presence of the BCdS/Ag2S@0h quantum dots, the cell membranes are almost destroyed and many pores on the membranes could be observed (Fig. 9B). Cells lose their cytoplasm and nucleus. As for the BCdS/Ag2S@2h quantum dots, it is more serious than that in the BCdS/Ag2S@0h group (Fig. 9C). The BCdS/Ag2S@8h quantum dots have no obvious effect on the cell morphology and membrane (Fig. 9D).


image file: c4ra09526j-f9.tif
Fig. 9 The morphologies of PC 12 cells after exposure to 20 ppm of BCdS/Ag2S quantum dots for 48 h. (A) Control, (B) BCdS/Ag2S@0h, (C) BCdS/Ag2S@2h, and (D) BCdS/Ag2S@8h. The red pane represents the magnified section.

4. Discussion

In general, cancer cells can be directly killed by inorganic nanomaterials by two ways.24,25 On the one hand, these sulphide nanomaterials can be taken by pinocytosis, non-specific endocytosis or phagocytosis. With the aid of the Trojan-horse carrier mechanism, the uptaken nanomaterials slowly release metal ions that interact with the surrounding biomolecules, inducing the functional disorder and cell death. On the other hand, the uptaken nanomaterials could directly induce the oxidative-stress mediated cancer cell death.10 Different metal ions employ different routes to kill cancer cells. Thus, is it possible to evoke a synergistic inhibition on cancer cells between different metal ions? It is well known that Cd, as a heavy metal, could cause the precipitation of functional proteins, increase the membrane permeability and induce cell death.26,27 Additionally, CdS also could cause cancer cell death via the oxidative-stress route.10 As for Ag and Ag2S, their anti-cancer activities have been well reported and are related to DNA damage and cell apoptosis.11,28 In this study, we tried to construct a green and facile route to combine Cd and Ag into a nano-material. Among different synthetic techniques, the biomimetic synthesis supplied a good opportunity to us to fabricate the CdS in nano-scale. Here, BSA acted as a structure-directing agent and also supplied more sites for further modifications in the future (Fig. 2 and 3).6,29 More importantly, BSA could be degraded and release CdS and Ag2S through enzymolysis in cells. Then, the following ion-exchange process would be easily performed and we could exactly control the Cd/Ag ratio in the nanocomposites by tuning the exchange time (Fig. 4). In the entire synthetic process, no organic solvents were used, thereby reducing the potential danger to humans from solvents and avoiding contamination of the surrounding environment. According to the results of cytotoxicity of the BCdS/Ag2S quantum dots to PC 12 cells, it can be seen that the activity is in the order of BCdS/Ag2S@2h > BCdS/Ag2S@0h > BCdS/Ag2S@8h. The BCdS/Ag2S@0h and BCdS/Ag2S@2h quantum dots could destroy the membrane system and cause the death of cells (Fig. 6–9). However, the BCdS/Ag2S@8h quantum dots could inhibit the cell proliferation (Fig. 7). From Fig. 4, we could observe that the BCdS/Ag2S@0h quantum dots are composed of BCdS and the BCdS/Ag2S@8h quantum dots are mainly composed of BAg2S, with only 1.66% of CdS. However, the Cd/Ag ratio in the BCdS/Ag2S@2h quantum dots is 1[thin space (1/6-em)]:[thin space (1/6-em)]3.4. That is, there is a positive cooperative inhibition between Cd and Ag in the BCdS/Ag2S@2h quantum dots on the growth of PC 12 cells.

5. Conclusions

A green and facile route has been successfully developed to synthesize BCdS/Ag2S quantum dots. The obtained products are well dispersed and controllability of the Cd/Ag ratio is possible. Such a synthesis route could be used to fabricate other dual or multi-metal nanomaterials.

In addition, the cytotoxicity of such quantum dots to PC 12 cells invokes a positive cooperative effect between Cd and Ag. Consequently, the application of the synergistic anti-cancer opinion at searching for novel nano-drugs with the higher activity is worth anticipating.

Acknowledgements

This work was financially supported by the National Natural Science Foundation of China (31000774 and 20971039) and the Program for Innovative Research Team in University of Henan Province (2012IRTSTHN006) and the National Basic Research Program of China (Grant no. 2005CB724306).

Notes and references

  1. V. Biju, S. Mundayoor, R. V. Omkumar, A. Anas and M. Ishikawa, Biotechnol. Adv., 2010, 28, 199 CrossRef CAS PubMed.
  2. A. J. Cole, V. C. Yang and A. E. David, Trends Biotechnol., 2011, 29(7), 323 CrossRef CAS PubMed.
  3. T. Jamieson, R. Bakhshi, D. Petrova, R. Pocock, M. Imani and A. M. Seifalian, Biomaterials, 2007, 28, 4717 CrossRef CAS PubMed.
  4. S. L. Kerr and B. Sharp, Chem. Commun., 2007, 4537 RSC.
  5. J. E. Schroeder, I. Shweky, H. Shmeeda, U. Banin and A. Gabizon, J. Controlled Release, 2007, 124, 28 CrossRef CAS PubMed.
  6. S. R. Whaley, D. S. English, E. L. Hu, P. F. Barbara and A. M. Belcher, Nature, 2000, 405, 665 CrossRef CAS PubMed.
  7. C. Li, Y. Zhang, M. Wang, Y. Zhang, G. Cheng, L. Li, D. Wu and Q. Wang, Biomaterials, 2014, 35(1), 393 CrossRef CAS PubMed.
  8. M. E. Mathew, J. C. Mohan, K. Manzoor, S. V. Nair, H. Tamura and R. Jayakumar, Carbohydr. Polym., 2010, 80, 442 CrossRef CAS PubMed.
  9. A. Jayasree, S. Sasidharan, M. Koyakutty, S. Nair and D. Menon, Carbohydr. Polym., 2011, 85, 37 CrossRef CAS PubMed.
  10. B. R. Singh, B. N. Singh, W. Khan, H. B. Singh and A. H. Naqvi, Biomaterials, 2012, 33, 5753 CrossRef CAS PubMed.
  11. L. Yang, H. J. Wang, H. Y. Yang, S. H. Liu, B. F. Zhang, K. Wang, X. M. Ma and Z. Zheng, Chem. Commun., 2008, 2995 RSC.
  12. H. J. Wang, L. Yang, H. Y. Yang, K. Wang, W. G. Yao, K. Jiang, X. L. Huang and Z. Zheng, J. Inorg. Biochem., 2010, 104, 87 CrossRef CAS PubMed.
  13. A. Asati, S. Santr, C. Kaittanis and J. M. Perez, ACS Nano, 2010, 4(9), 5321 CrossRef CAS PubMed.
  14. X. Zhao, S. Ng, B. C. Heng, J. Guo, L. Ma, T. T. Tan, K. W. Ng and S. C. Loo, Arch. Toxicol., 2013, 87(6), 1037 CrossRef CAS PubMed.
  15. F. Iemma, U. G. Spizzirri, F. Puoci, R. Muzzalupo, S. Trombino, R. Cassano, S. Leta and N. Pcci, Int. J. Pharm., 2006, 312, 151 CrossRef CAS PubMed.
  16. H. J. Wang, L. Di, Q. S. Ren and J. Y. Wang, Materials, 2009, 2, 613 CrossRef CAS PubMed.
  17. H. J. Wang, J. C. Huang, S. S. Wu, C. F. Wang, X. H. Yu and Y. Cao, J. Nanosci. Nanotechnol., 2015, 15(4), 2634 CrossRef PubMed.
  18. M. D. Lovelace and D. M. Cahill, J. Neurosci. Methods, 2007, 165, 223 CrossRef CAS PubMed.
  19. B. Sambandam, T. Muthukumar, S. Arumugam, P. L. Paulose and P. T. Manoharan, RSC Adv., 2014, 4, 22141 RSC.
  20. S. Huang, Y. Lin, J. Yang, X. Li, J. Zhang, J. Yu, H. Shi, W. Wang and Y. Yu, RSC Adv., 2013, 3, 20782 RSC.
  21. P. Jiang, C. N. Zhu, Z. L. Zhang, Z. Q. Tian and D. W. Pang, Biomaterials, 2012, 33, 5130 CrossRef CAS PubMed.
  22. C. Ando, H. Kishi, H. Oguchi and M. Senna, J. Am. Ceram. Soc., 2006, 89, 1709 CrossRef CAS PubMed.
  23. T. Mosmann, J. Immunol. Methods, 1983, 65(1–2), 55–63 CrossRef CAS.
  24. L. K. Limbach, P. Wick, P. Manser, R. N. Grass, A. Bruinink and W. J. Stark, Environ. Sci. Technol., 2007, 41, 4158 CrossRef CAS.
  25. Y. N. Chang, M. Zhang, L. Xia, J. Zhang and G. Xing, Materials, 2012, 5(12), 2850 CrossRef CAS PubMed.
  26. M. S. M. Li, F. P. Filice and Z. Ding, J. Inorg. Biochem., 2014, 136, 177 CrossRef CAS PubMed.
  27. S. Petanidis, M. Hadzopoulou-Cladaras and A. Salifoglou, J. Inorg. Biochem., 2013, 121, 100 CrossRef CAS PubMed.
  28. C. Krishnaraj, P. Muthukumaran, R. Ramachandran and M. D. Balakumaran, Biotechnology Reports, 2014, 4, 42 CrossRef PubMed.
  29. Y. Cao, H. J. Wang, C. Cao, Y. Y. Sun, L. Yang, B. Q. Wang and J. G. Zhou, J. Nanopart. Res., 2011, 13, 2759 CrossRef CAS.

This journal is © The Royal Society of Chemistry 2014
Click here to see how this site uses Cookies. View our privacy policy here.