Contribution of silica–rubber interactions on the viscoelastic behaviors of modified solution polymerized styrene butadiene rubbers (M-S-SBRs) filled with silica
Liangliang Qu*,
Lijing Wang,
Ximing Xie,
Guozhu Yu and
Shaohua Bu
Yanshan Branch of Beijing Research Institute of Chemical Industry, China Petroleum & Chemical Company (Sinopec Corp.), Beijing 102500, China. E-mail: quliangliang.bjhy@sinopec.com; Fax: +86 10 69341930; Tel: +86 10 69347049
First published on 11th November 2014
Abstract
A series of modified solution-polymerized styrene butadiene rubbers (M-S-SBRs) with different molar contents of polar groups were prepared through grafting 3-mercaptopropionic acid into solution-polymerized styrene butadiene rubber (S-SBR) chains. The molar contents of the polar groups in M-S-SBR were calculated using 1H nuclear magnetic resonance (1H NMR) spectroscopy. Thermodynamic analytical methods, including the surface energy of M-S-SBR and filler flocculation, show that the introduction of polar groups increases the work of adhesion of filler–rubber (Wrf), which is an indicator for the compatibility of the filler with rubber. The thermodynamic results can be further proved by TEM micrographs. Strain sweep experiments were carried out to investigate the temperature dependent nonlinear strain-dependence of elastic moduli, referred to as the Payne effect. The filler–filler network and interfacial strength were studied in terms of critical strain γc and activation energy Ea. Dynamic mechanical measurements show that a combination of higher energy dissipation in the low temperature range and higher elasticity in the high temperature region were achieved for M-S-SBR/Silica when compared with their non-modified counterpart.
Introduction
In rubber science and technology, the reinforcement of rubbers by fillers is of practical and technical importance to improve final performance and hence has continuously been a research focus. Carbon black (CB) was the first commercial filler used in the rubber industry. Precipitated silica has been proved to be the filler of choice for the manufacture of high performance pneumatic passenger car tires since the introduction of the so-called “Green tire” by Michelin in the 1990s.1,2 Technological development of changing the active filler from carbon black to precipitated silica in rubber compounds and related studies towards the reinforcing mechanism have attracted considerable interest in both industrial and academic fields. Silica as a reinforcement agent provides a combination of good mechanical properties, high resilience, excellent rolling resistance and low heat build-up.3–7Although the above mentioned successes have been achieved, a major problem in the implementation of silica is its poor dispersion in the rubber matrix, which is caused by the great difference in surface polarity between silica and rubber.8,9 To date, the most successful efforts to enhance the filler dispersion is the introduction of silane coupling agents.10,11 In addition, surface modification of silica12–14 and the development of new highly dispersed silica15–18 have also been subjects of interest in recent years.
As a matter of fact, the macro-properties of filled rubber are not only affected by the filler structure, surface chemistry and particle size, but also the characteristics of rubber such as chemical composition, chain microstructure including molecular weight and molecular weight distribution, configuration, stereoregularity, monomer unit distribution and sequence, and functionality. Therefore, modification of rubber, which has the potential to cover the gap between the surface characteristics of rubber and filler, tends to be an effective way to improve filler dispersion and enhance interfacial strength. Recently, some efforts have been devoted to introducing functional groups, such as –COOH, –OH and –NH2, into rubber molecules19–21 and some exciting results have been obtained in dynamic mechanical properties. To our knowledge, such research work has mostly focused on the preparation of modified rubbers and some characterization of their macro-properties. However, few findings have been published in the literature related to the rubber–filler interactions and nonlinear viscoelastic behavior of functionalized rubber filled with silica.
Hereby, in the present paper a series of modified solution-polymerized styrene butadiene rubbers (M-S-SBRs) with different molar contents of polar groups were synthesized. The study is an attempt to investigate the contribution of filler–rubber interactions on the viscoelasticity of M-S-SBRs filled with silica. The surface energies of M-S-SBRs and the work of adhesion value between M-S-SBRs and silica were calculated, which are good indicators for the compatibility of the filler with rubber. Strain sweep experiments were carried out to investigate the temperature dependent, nonlinear strain-dependence of elastic moduli, referred to as the Payne effect. The filler–filler, filler–rubber network and interfacial strength were studied in terms of critical strain γc and activation energy Ea. In the dynamic mechanical measurements, the viscoelastic behavior of the filled M-S-SBRs were investigated by linking the filler/polymer interactions, which would help us to understand how to tailor the interfacial properties of filled rubber for a desired performance.
Experimental
Materials
Commercial S-SBR2506 (styrene content = 21 ± 2 wt%, vinyl content = 60 ± 2 wt%, SiCl4 coupled, ML1 + 4 100 °C = 60 ± 5) was purchased from Yanshan Petrochemical Co. Sinopec (Beijing, P.R.C.). Cyclohexane was commercially available from Beijing Chemical Reagents Company. The modification agent and initiator were 3-mercaptopropionic acid (99%, Aldrich) and azobisisobutyronitrile (AIBN) (99%, Aldrich), respectively. The precipitated silica (Ultrasil VN3) with a specific surface area of 175 m2 g−1 and pH of 6.2 was kindly provided by Degussa. The silane coupling agent, bis-(triethoxysilylpropyl)-tetrasulfide (TESPT), was obtained from Nanjing Shuguang Chemical Group Co., P.R.C. The curing accelerators were diphenylguanidine (DPG) (>97%, Aladdin, Shanghai, P.R.C.) and n-cyclohexyl-2-benzothiazolesulfenamide (CBS) (>97%, Puyang Willing Chemicals Co., Henan, P.R.C.).Preparation of modified solution-polymerized styrene butadiene rubbers (M-S-SBRs)
S-SBR2506 was firstly dissolved in cyclohexane at a concentration of 10 g per 100 mL. The mixture was stirred for 24 hours at 50 °C and became homogeneous. A pre-determined amount of 3-mercaptopropionic acid was loaded into the S-SBR solution. The reaction was initiated with AIBN at an elevated temperature. The mixture was kept at 80 °C for 30 minutes with stirring until the completion of the reaction. Most of the solvent was evaporated at 50 °C with continuous stirring. Subsequently, the resulting polymer solution was placed in a vacuum oven at 55 °C for two days to remove the residual solvent.Preparation and vulcanization of the compounds
The formulation of the compounds are listed in Table 1. Silica and TESPT were mixed in rubber on a two-roll mill at room temperature. Afterwards, the compounds were transferred to an internal mixer (Thermo Fisher Scientific, Rheomix 3010 OS, Banbury rotors). The temperature was held for 7 min at around 155 °C with a rotor speed of 35 rpm to ensure the reaction of silane with the silica surface. The curing package consists of 1.4 phr sulfur, 1.5 phr DPG and 1.4 phr CBS. The cure time was determined using an oscillating disc rheometer (ODR) at 150 °C.Measurements and characterization
The molar contents of 3-mercaptopropionic acid grafted in S-SBR and structural units of all samples, including styrene units and vinyl contents from 1,2-polybutadiene and 1,4-polybutadiene, were calculated using 1H nuclear magnetic resonance (1H NMR) spectroscopy acquired on a BRUKER AMX 600 MHz spectrometer. Chemical shifts are given relative to a tetramethylsilane (TMS) internal reference. The integrals in the proton spectra were obtained directly from concentrated solutions in 1,1,1,2-tetrachloroethane-d2. It is noted that all M-S-SBR samples were extracted with ethanol for 24 hours to remove the unreacted chemicals and then dried in vacuum at 40 °C for 12 hours.Gel permeation chromatography (GPC) analyses of the M-S-SBR molecular weight and its distribution were performed on a Alliance2690 system (Waters, U.S.A.) consisting of a 5 μm and 7.5 mm × 300 mm PLgel Mixed-C column and a refractive-index detector. The eluting solvent was tetrahydrofuran at a flow rate of 1.0 mL min−1. The retention times were calibrated against polystyrene standards.
Sessile drop contact angle measurements of uncured M-S-SBR were conducted with a DSA100 drop shape analyzer (KRÜSS, Germany). The test liquids with different surface tension were deionized water (Sigma-Aldrich), ethylene glycol (spectrophotometric grade, ≥99%, Sigma-Aldrich), ethanol (≥99.5%, Sigma-Aldrich) and formamide (spectrophotometric grade, ≥99%, Sigma-Aldrich). The uncured raw rubber films with a thickness of 1 mm were obtained by compression molding at 100 °C with a PTFE surface to minimize surface contamination. The surface energy was calculated by fitting Fowkes equations22 as described in the literature.23
The micromorphology of S-SBR/Silica was examined with transmission electron microscopy (TEM). Ultrathin sections of the specimens were prepared at −100 °C using a Leica Ultracut-R ultra-microtome. The thin slices were placed on a copper grid and then submitted to TEM observation with a JEOL JEM-2010 TEM under an accelerating voltage of 200 kV.
Filler Flocculation was performed on a rubber processing analyzer (RPA2000, Alpha, U.S.A.) at 0.7% strain and 100 °C for 20 minutes after preheating for 1 minute. According to Mihara et al.,24 the flocculation rate constant (ka) can be calculated by:
 | (1) |
 | (2) |
Strain sweep of the silica filled rubber was conducted on a rubber process analyzer RPA2000 (Alpha, U.S.A.) at 70 °C in the dynamic strain range of 0.7–100%. The tests were carried out at a frequency of 1 Hz. For studying the effect of temperature on the Payne effect, the temperatures chosen were 60 °C, 80 °C, 100 °C and 120 °C and the dynamic strain range was from 0.5% to 35%.
The viscoelastic properties of all samples were measured on a EPLEXOR-500N dynamic mechanical analyzer (Gabo, Ahlden, Germany). The samples were trimmed to the following dimensions: 35.0 mm in length, 8.0 mm in width and 1.0 mm in thickness. The properties were measured using a tension clamp in the temperature range from −80 °C to 80 °C at a heating rate of 3 °C min−1. The tests were carried out at a frequency of 10 Hz. For the measurement of the complex modulus G*, a static load of 1.0% prestrain was applied, and then the samples were oscillated to a dynamic load of 0.25% strain.
The differential scanning calorimeter (DSC) measurements were carried out on a Q100 (TA Instruments, U.S.A.) over the temperature range of −100 °C to 50 °C for all samples under nitrogen atmosphere. The scanning rate was chosen as 10 °C min−1.
Results and discussion
Preparation of M-S-SBR
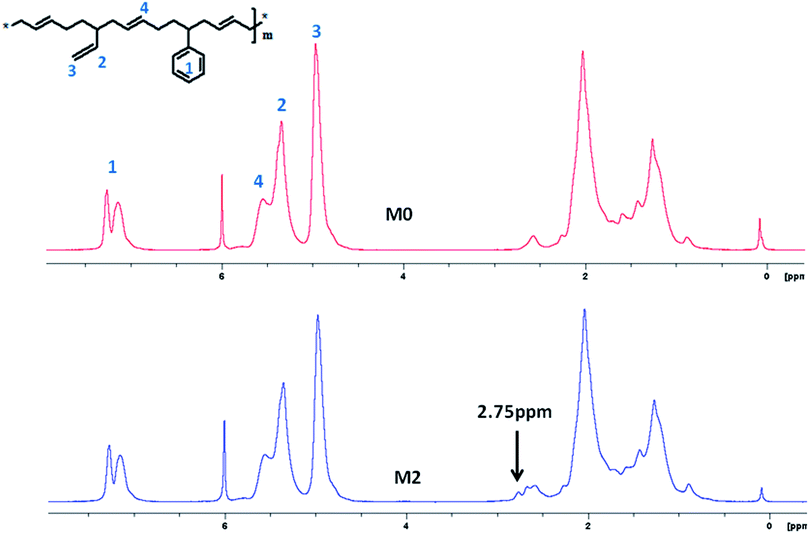
A series of M-S-SBRs were prepared using an addition reaction between the vinyl groups in S-SBR and the sulfhydryl groups of 3-mercaptopropionic acid (referred to as the modification agent).19 As can be seen in Fig. 1, the addition reaction can be identified by the appearance of the characteristics peak of 3-mercaptopropionic acid in M-S-SBRs after extraction in the 1H NMR spectrum, such as –SCH2– at a chemical shift of 2.75 ppm. Two kinds of vinyl groups exist in the polybutadiene units in the molecular structure of S-SBR, i.e. the ones on the backbone from 1,4-polybutadiene and the ones in the side-chains from 1,2-polybutadiene. The kind of vinyl groups reacting with the sulfhydryl group from 3-mercaptopropionic acid was first determined by 1H NMR spectroscopy. The molar content of the structural units are given in Table 2, in which the unmodified S-SBR denoted as M0 is given for comparison. As can be seen in Table 2, the molar content of 1,2-polybutadiene units decreases with an increase in modification agents, while the molar content of 1,4-polybutadiene units remains unchanged, suggesting the addition reaction occurs between the vinyl groups of 1,2-polybutadiene and the sulfhydryl groups. The addition reactions were carried out as follows:| Sample code | Styrene units (wt%) | 1,2-Polybutadiene units (wt%) | 1,4-Polybutadiene units (wt%) | Modification agent (wt%) | Mn × 10−4 (g mol−1) | Mw/Mn |
|---|---|---|---|---|---|---|
| M0 | 21.0 | 47.4 | 31.6 | 0 | 20.66 | 1.33 |
| M1 | 20.7 | 45.6 | 31.3 | 2.4 | 21.47 | 1.41 |
| M2 | 20.4 | 44.2 | 31.2 | 4.2 | 20.02 | 1.34 |
| M3 | 20.1 | 40.2 | 30.1 | 9.6 | 22.56 | 1.44 |
The molar content of 3-mercaptopropionic acid grafting on S-SBR and the molecular weights of all samples are listed in Table 2. It is obvious that the molecular weights keep almost constant after modification and the slight fluctuation can be regarded as within the detection error of the devices.
Surface energies of M-S-SBR
It is well accepted that the mechanical property and viscoelasticity of filled rubber remarkably depends on the state of filler dispersion, filler structure and rubber–filler interactions. From a thermodynamic standpoint, the interfacial strength between filler and rubber, and filler flocculation are influenced by the surface energy of the filler particles and polymer. In the present study, the carboxyl groups in the modification agents are designed to be the functional groups to increase the surface polarity of S-SBR. Therefore, in order to study the adhesion between M-S-SBR and silica, and to further prove the modification of rubber are favorable for improving the filler dispersion, the contact angle measurements of M0 and M-S-SBR were performed by means of a sessile drop method. The dispersive (rdp) and polar (rpp) parts of rubber are calculated by fitting Fowkes equation and are listed in Table 3. The rdp and rpp for silica Ultrasil VN3 is 19.7 mJ m−2 and 15.2 mJ m−2 according to the literature.23 It can be seen that the M-S-SBR exhibits an increasing trend for both the polar part and the total surface energy when compared with M0. More precisely, the polarity is monotonically increasing with modification content. i.e. the contents of polar groups in the molecules.| Rubber code | Dispersive part rdp/mJ m−2 | Polar part rpp/mJ m−2 | Total rp/mJ m−2 |
|---|---|---|---|
| M0 | 24.7 | 0.9 | 25.6 |
| M1 | 25.9 | 1.2 | 27.1 |
| M2 | 25.4 | 2.3 | 27.7 |
| M3 | 27.3 | 4.8 | 32.1 |
The possible interactions between the two materials were determined by their surface energy. Therefore, the adhesive energy (Wrf) between silica and rubber according to Fowkes model is given by:
 | (3) |
According to Wang's model,25 ΔW is described as the change in adhesive energy in the filler agglomeration process and is given by:
 | (4) |
From a thermodynamic point of view, ΔW is the driving force for filler flocculation. When ΔW tends to zero, the filler and rubber have similar surface properties. Consequently, the filler does not tend to flocculate. On the contrary, the larger the difference of surface characteristics between the filler and rubber, the higher is the tendency for filler self-association.
Table 4 shows the thermodynamic parameters for filler–rubber adhesion and the filler flocculation rate constant. Rubber containing a higher content of polar groups has stronger adhesive strength with silica and the filler exhibits decreasing ΔW and ka values with increasing polarity of M-S-SBR, indicating that the introduction of polar groups into rubber can improve the stability of silica particles in the rubber matrix.
| M0/Silica | M1/Silica | M2/Silica | M3/Silica | |
|---|---|---|---|---|
| Wrf/mJ m−2 | 51.2 | 53.3 | 55.8 | 62.1 |
| ΔW/mJ m−2 | 13.0 | 11.8 | 8.1 | 4.6 |
| ka × 10−3/S−1 | 3.98 | 3.56 | 3.12 | 2.82 |
Non-linear behavior of M-S-SBR/Silica
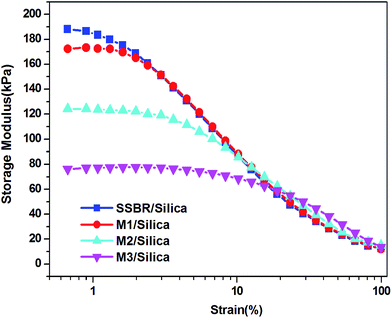
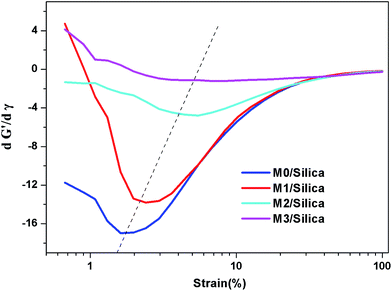
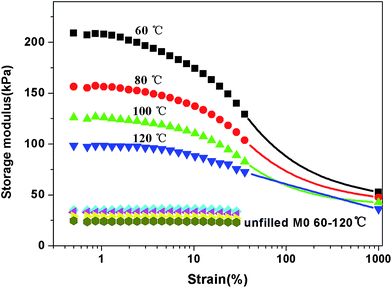
Strain sweep measurements have been carried out to study the rubber–filler and filler–filler interactions, and the results presented in Fig. 2. The filled polymers present a non-linear rheological amplitude dependency, which is known as the Payne effect. The storage modulus is the highest at small strain (referred to as G′0) and rapidly decreases to a low value (referred to as G′∞). Due to the limitation of the instrument, the plateau at high amplitude is not reached. The magnitude of the Payne effect (G′0 − G′∞) is reduced upon increasing the modification agent. The G′0 values display more differences among the samples than the G′∞ values. The first derivative, dG′/dγ, is used to denote the dependence of G′ on strain (Fig. 3). It is seen that G′ is less dependent on strain for M-S-SBR and the inflection point shifts towards high strain. The inflection point can be regarded as the strain where G′ drops rapidly.The influence of temperature on the Payne effect for all samples have been investigated in the range from 60 °C to 120 °C, and M0/Silica is given in Fig. 4 as an example. A decrease in the magnitude of the Payne effect with increasing temperature can be observed, in which the decrease of modulus at low strain is larger than that at high strain. This is consistent with the results in the literature.26,27
In order to parameterize the nonlinear behavior of the M-S-SBR/Silica system, the phenomenological quantitative Kraus28,29 model was adopted, which is based on the assumption of an agglomeration/de-agglomeration mechanism of filler agglomerates:
 | (5) |
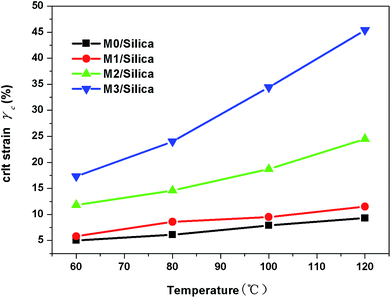
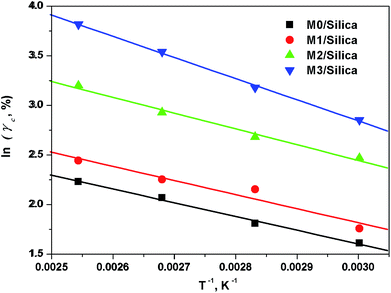
The temperature dependence of the critical strain γc is shown in Fig. 5. We observe that the γc values depend greatly on temperature and the modification agent. A larger value of γc means that the filler agglomerates are broken down at higher strain, implying weak strength between the fillers. This phenomenon is discussed in depth in K. W. Stöckelhuber's paper.26 By means of the Arrhenius plot of the temperature dependency of γc (Fig. 6), the activation energy Ea was obtained by multiplying the slopes of 1/T versus ln![[thin space (1/6-em)]](https://www.rsc.org/images/entities/char_2009.gif) γc plot with the gas constant, R = 8.314 × 10⁻³ kJ mol−1 K−1. Table 5 gives the variations of Ea values for all samples with different modification agent. The changes manifest that Ea goes up with the modification agent.
γc plot with the gas constant, R = 8.314 × 10⁻³ kJ mol−1 K−1. Table 5 gives the variations of Ea values for all samples with different modification agent. The changes manifest that Ea goes up with the modification agent.
| Sample code | Ea (kJ mol−1) |
|---|---|
| M0/Silica | 11.3 |
| M1/Silica | 12.8 |
| M2/Silica | 14.2 |
| M3/Silica | 17.7 |
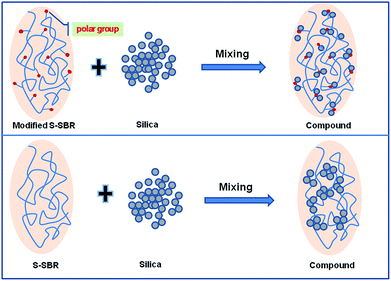
As can be seen in Fig. 7, the sketch of the dispersion of silica in M-S-SBR and unmodified S-SBR, the high magnitude of the Payne effect for unmodified S-SBR/Silica is caused by filler agglomerates, but this kind of filler network is less stable, which is easily broken down upon strain. This is why the activation energy of M0/Silica is the lowest among the samples. When carboxyl groups are grafted on the rubber chains, the difference in surface polarity of the rubber and silica decreases, and the rubber–filler interactions are enhanced through hydrogen bonds between the carboxyl groups of rubber and the silanol groups on the surface of silica. This contributes to a better and fine dispersion of silica. For a filler well-dispersed rubber compound, the amount of filler particles, which can interact with rubber chains is larger. Therefore, in the M-S-SBR/Silica compound, the filler network is not filler–filler association any more, but changes into a filler–rubber–filler linkage. This kind of interaction is much more stable than the one in unmodified S-SBR/Silica, resulting in higher activation energy and a decreased magnitude of the Payne effect. This observation supports the results from the filler flocculation experiments.
Morphology of M-S-SBR/Silica
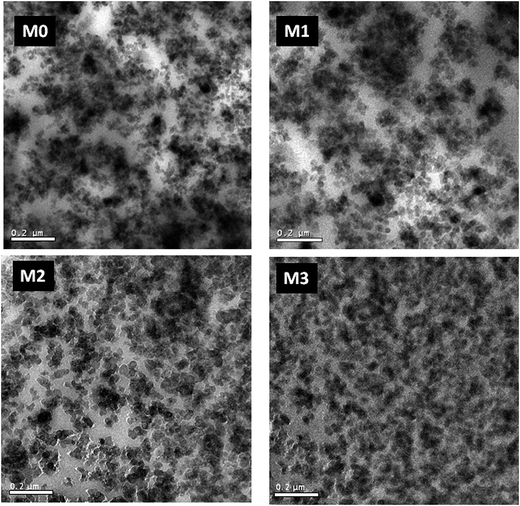
TEM micrographs support the results from the thermodynamic analysis and strain sweep measurements. TEM images of M-S-SBR/Silica are displayed in Fig. 8. It is evident that large silica agglomerates embed in S-SBR/Silica without modification, indicating relatively poor filler–rubber interactions. When 2.4 wt mol% modification agent is grafted on S-SBR, the dispersion state of silica is somewhat improved. As far as M3 with the content of modification agent up to 9.6 wt% is concerned, silica presents a relatively uniform and homogeneous dispersion and has a relatively narrow distribution.Viscoelastic behavior of M-S-SBR/Silica
It has been proved that controlling the structure of S-SBR is a promising method to balance the grip and fuel efficiency performance for silica compounds used in passenger tire treads, i.e. lower elasticity at low temperature regions (−10 °C to 10 °C) and lower energy dissipation at a relative high temperature range (50–80 °C), to a high level. Fig. 9 presents tan![[thin space (1/6-em)]](https://www.rsc.org/images/entities/char_2009.gif) δ curves obtained for M-S-SBR/Silica vulcanizates. Tg, taken as the temperature of maximum tan
δ curves obtained for M-S-SBR/Silica vulcanizates. Tg, taken as the temperature of maximum tan![[thin space (1/6-em)]](https://www.rsc.org/images/entities/char_2009.gif) δ, together with maximum tan
δ, together with maximum tan![[thin space (1/6-em)]](https://www.rsc.org/images/entities/char_2009.gif) δ (tan
δ (tan![[thin space (1/6-em)]](https://www.rsc.org/images/entities/char_2009.gif) δmax) are collected in Table 6. From the DMA measurements, we detected the changes in relaxation behaviors with the content of modification agents. An exciting result in the dynamic behavior is that the intensity of Tg relaxation increases with modification agent, i.e. M3/Silica gives the highest energy dissipation in this temperature range, whereas this sample exhibits the lowest tan
δmax) are collected in Table 6. From the DMA measurements, we detected the changes in relaxation behaviors with the content of modification agents. An exciting result in the dynamic behavior is that the intensity of Tg relaxation increases with modification agent, i.e. M3/Silica gives the highest energy dissipation in this temperature range, whereas this sample exhibits the lowest tan![[thin space (1/6-em)]](https://www.rsc.org/images/entities/char_2009.gif) δ in the temperature region of 50–80 °C (see Fig. 9). The loss modulus (G′′) data in Fig. 10 shows that the lower G′′ with modification agent content is also indicative of the decreased energy dissipation.
δ in the temperature region of 50–80 °C (see Fig. 9). The loss modulus (G′′) data in Fig. 10 shows that the lower G′′ with modification agent content is also indicative of the decreased energy dissipation.
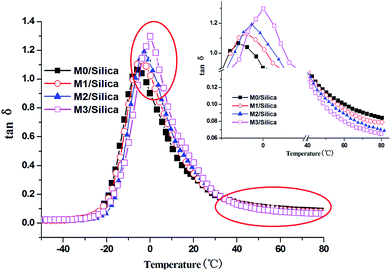 | ||
Fig. 9 Dynamic mechanical analysis of the M-S-SBR filled with silica: temperature dependence of tan![[thin space (1/6-em)]](https://www.rsc.org/images/entities/char_2009.gif) δ. δ. | ||
| Tg/°C | tan![[thin space (1/6-em)]](https://www.rsc.org/images/entities/char_2009.gif) δmax δmax |
Tg-c/°C | Tg-r/°C | |
|---|---|---|---|---|
| a Tg-c is the Tg from DSC for M0/Silica and M-S-SBR/Silica. Tg-r is the Tg from DSC for M0 and M-S-SBR. | ||||
| M0/Silica | −5.9 | 1.07 | −27.2 | −26.8 |
| M1/Silica | −3.9 | 1.11 | −26.7 | −26.4 |
| M2/Silica | −2.7 | 1.19 | −25.4 | −25.8 |
| M3/Silica | 0.1 | 1.30 | −23.9 | −24.4 |
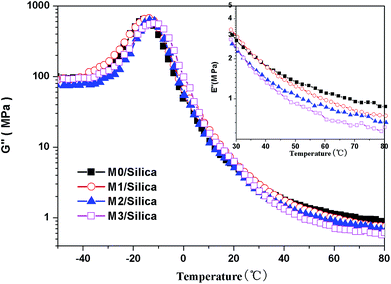 | ||
| Fig. 10 Dynamic mechanical analysis of the M-S-SBR filled with silica: temperature dependence of the loss modulus G′′. | ||
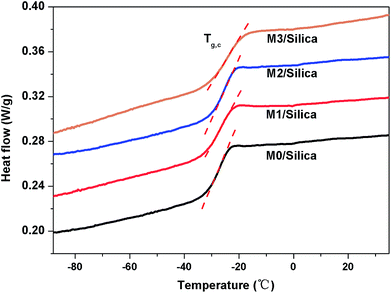
Another point that should be noted is that tan![[thin space (1/6-em)]](https://www.rsc.org/images/entities/char_2009.gif) δ peaks move to higher temperature monotonically with increasing modification agent. One may wonder that the increase of Tg is simply because of the higher Tg for M-S-SBR or due to the changes of relaxation behaviors due to strong interactions between silica and the M-S-SBRs. For clarifying this issue, DSC measurements were performed on the M-S-SBR/Silica compounds and the DSC curves are shown in Fig. 11. The Tg values for M-S-SBR/Silica from DSC are listed in Table 6 and the Tg of the raw rubbers given for comparison. It can be observed that the Tg does not exhibit distinct variation after compounding with silica in comparison with that of raw rubber. Therefore, it can be concluded that the Tg shifted from DMA with the modification agent due to the raw rubber rather than the interactions between silica and the M-S-SBR.
δ peaks move to higher temperature monotonically with increasing modification agent. One may wonder that the increase of Tg is simply because of the higher Tg for M-S-SBR or due to the changes of relaxation behaviors due to strong interactions between silica and the M-S-SBRs. For clarifying this issue, DSC measurements were performed on the M-S-SBR/Silica compounds and the DSC curves are shown in Fig. 11. The Tg values for M-S-SBR/Silica from DSC are listed in Table 6 and the Tg of the raw rubbers given for comparison. It can be observed that the Tg does not exhibit distinct variation after compounding with silica in comparison with that of raw rubber. Therefore, it can be concluded that the Tg shifted from DMA with the modification agent due to the raw rubber rather than the interactions between silica and the M-S-SBR.
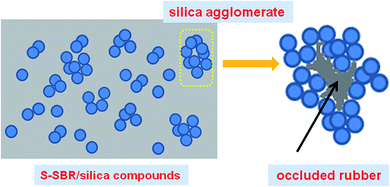
After we verified that the filler and rubber adhesions are indeed enhanced by rubber modifications, it is worthwhile to discuss further the interesting dynamic mechanical properties of our system. It is well accepted that lower elasticity at low temperatures and lower energy dissipation at relative high temperatures seem to be a pair of contradictions and synchronous improvements of these are difficult to be established. Nevertheless, a better balance of wet grip and rolling resistance can be obtained by introducing functional groups in S-SBR. As a matter of fact, the energy dissipations at different temperature ranges are governed by different mechanisms.32 At temperatures near the tan![[thin space (1/6-em)]](https://www.rsc.org/images/entities/char_2009.gif) δ peak in the transition zone, the portion of filled rubber for energy dissipation is a polymer matrix and thus, the number of molecular rubber chains, which can be involved in the transition, dominates the intensity. In the present study, the breakdown of filler network can be excluded due to the relatively low strain amplitudes in the DMA measurements. In the filled rubber system with a large amount of silica, the filler parameters, such as particle size, structure and surface characteristics, make the effective filler volume quite different from the real filler volume. Especially, for highly polar fillers such as silica, which has a large tendency to agglomerate, chain-like filler structures easily form via hydrogen bonding. In that case, some polymer chains are supposed to be trapped in the agglomerates, which behave as a part of rigid filler rather than a polymer matrix33,34 (see the schematic diagram in Fig. 12). The effective immobilization of the rubber portion increases the effective filler volume beyond the value calculated from the mass and density. As a result, the worse silica disperses in the rubber matrix, the more molecule chains are occluded in the filler agglomerates, thus the less they can engage in the transition.
δ peak in the transition zone, the portion of filled rubber for energy dissipation is a polymer matrix and thus, the number of molecular rubber chains, which can be involved in the transition, dominates the intensity. In the present study, the breakdown of filler network can be excluded due to the relatively low strain amplitudes in the DMA measurements. In the filled rubber system with a large amount of silica, the filler parameters, such as particle size, structure and surface characteristics, make the effective filler volume quite different from the real filler volume. Especially, for highly polar fillers such as silica, which has a large tendency to agglomerate, chain-like filler structures easily form via hydrogen bonding. In that case, some polymer chains are supposed to be trapped in the agglomerates, which behave as a part of rigid filler rather than a polymer matrix33,34 (see the schematic diagram in Fig. 12). The effective immobilization of the rubber portion increases the effective filler volume beyond the value calculated from the mass and density. As a result, the worse silica disperses in the rubber matrix, the more molecule chains are occluded in the filler agglomerates, thus the less they can engage in the transition.
Returning to our system, the interactions between rubber and silica are remarkably improved by the introduction of polar groups and thus, silica exhibits better dispersion stability and finer morphologies as well. This means that less polymer chains are occluded in the filler agglomerates and more can be engaged in Tg transition, which leads to a higher tan![[thin space (1/6-em)]](https://www.rsc.org/images/entities/char_2009.gif) δmax. Another point that should not be ignored here is the silane coupling agent, TESPT employed when compounding in our system. Based on the model of rubber reinforcement with silica by silane coupling agent proposed by Luginsland,35 there is a layer of bound rubber chemically bonded to the silica surface by the organosilane coupling agent and this layer is considered to be immobilized. As mentioned above, a better dispersion of silica suggests more silica particles can get involved with TESPT, and therefore a more chemically bonded rubber is formed. But why does the increase in bound rubber result in more rubber chains that can participate in the glass transition? It seems to be contradictory. Here, we detect the heat capacity (ΔCp) of glass transition for all rubber/Silica compounds by DSC (the DSC curves are shown in Fig. 11) and the values are given in Table 7. ΔCp, which is related to the fraction of the polymer participating in the glass transition and is proportional to the number of internal degrees of freedom of molecular motion,36 shows an increasing tendency with the content of polar groups. It is clear that a higher fraction of polymer chains can be involved in the glass transition in the M-S-SBR/Silica. Therefore, we assume that the amount of rubber chains engaged in the transition for the M-S-SBR/Silica system is larger when compared with that in M0/Silica probably because the increased amount of molecular chains released from the occluded rubber in M-S-SBR/Silica can compensate the loss in the number of rubber chains due to being chemically bonded to the surface of silica.
δmax. Another point that should not be ignored here is the silane coupling agent, TESPT employed when compounding in our system. Based on the model of rubber reinforcement with silica by silane coupling agent proposed by Luginsland,35 there is a layer of bound rubber chemically bonded to the silica surface by the organosilane coupling agent and this layer is considered to be immobilized. As mentioned above, a better dispersion of silica suggests more silica particles can get involved with TESPT, and therefore a more chemically bonded rubber is formed. But why does the increase in bound rubber result in more rubber chains that can participate in the glass transition? It seems to be contradictory. Here, we detect the heat capacity (ΔCp) of glass transition for all rubber/Silica compounds by DSC (the DSC curves are shown in Fig. 11) and the values are given in Table 7. ΔCp, which is related to the fraction of the polymer participating in the glass transition and is proportional to the number of internal degrees of freedom of molecular motion,36 shows an increasing tendency with the content of polar groups. It is clear that a higher fraction of polymer chains can be involved in the glass transition in the M-S-SBR/Silica. Therefore, we assume that the amount of rubber chains engaged in the transition for the M-S-SBR/Silica system is larger when compared with that in M0/Silica probably because the increased amount of molecular chains released from the occluded rubber in M-S-SBR/Silica can compensate the loss in the number of rubber chains due to being chemically bonded to the surface of silica.
| Sample code | ΔCp (J g−1 K−1) |
|---|---|
| M0/Silica | 0.23 |
| M1/Silica | 0.24 |
| M2/Silica | 0.26 |
| M3/Silica | 0.29 |
According to the G′′ and tan![[thin space (1/6-em)]](https://www.rsc.org/images/entities/char_2009.gif) δ data mentioned above, M3/Silica presents the lowest energy dissipation in the elastic temperature region. It is can be deduced that the energy dissipation is dominated by the interactions between rubber and the fillers because the energy dissipation in the elastic state is increased by the friction between rubber chains and filler particles, which are derived from a weak interface strength. Conversely, strong rubber–filler interactions are favorable for lower hysteresis in this temperature range.
δ data mentioned above, M3/Silica presents the lowest energy dissipation in the elastic temperature region. It is can be deduced that the energy dissipation is dominated by the interactions between rubber and the fillers because the energy dissipation in the elastic state is increased by the friction between rubber chains and filler particles, which are derived from a weak interface strength. Conversely, strong rubber–filler interactions are favorable for lower hysteresis in this temperature range.
Conclusion
In the present study, we have synthesized a series of modified solution-polymerized styrene butadiene rubbers (M-S-SBRs) with different molar content of polar groups through grafting 3-mercaptopropionic acid on S-SBR. According to the thermodynamic analysis and strain sweep measurements, the presence of polar groups in S-SBR increases the surface energy, especially the polar part, resulting in stronger adhesive strength between the rubber and silica and thus a more stable filler–rubber–filler network when compared with the unmodified one. TEM images support the above mentioned observations. As far as the dynamic mechanical properties are concerned, the better dispersion of silica and stronger filler–rubber interactions facilitates the combination of lowest tan![[thin space (1/6-em)]](https://www.rsc.org/images/entities/char_2009.gif) δ and G′′ in the higher temperature region of 50–80 °C and the higher intensity of Tg relaxation.
δ and G′′ in the higher temperature region of 50–80 °C and the higher intensity of Tg relaxation.
Appendix (a list of parameters)
| rdp | Dispersive part of surface energy |
| rpp | Polar part of surface energy |
| rp | Total surface energy |
| ΔW | The change in adhesive energy in the filler agglomeration process |
| Wrf | Adhesive energy |
| G′ | Elastic modulus |
| G′0 | Elastic modulus at very small strain |
| G′∞ | Elastic modulus at very large strain |
| G′uf | Elastic modulus for unfilled rubber |
| G′′ | Loss modulus |
| γ | Strain |
| γc | Critical strain |
| Ea | Activation energy |
tan![[thin space (1/6-em)]](https://www.rsc.org/images/entities/char_2009.gif) δ δ | Loss factor |
tan![[thin space (1/6-em)]](https://www.rsc.org/images/entities/char_2009.gif) δmax δmax | Maximum tan![[thin space (1/6-em)]](https://www.rsc.org/images/entities/char_2009.gif) δ value in the plot of tan δ value in the plot of tan![[thin space (1/6-em)]](https://www.rsc.org/images/entities/char_2009.gif) δ vs. temperature δ vs. temperature |
| Tg | Glass transition temperature |
| ΔCp | Heat capacity |
References
- R. Rauline, Copolymer rubber composition with silica filler, tire having base of said composition and method of preparing same, US Pat. US005227425A, 1993.
- G. Heinrich and T. A. Vilgis, KGK, Kautsch. Gummi Kunstst., 2008, 61, 368–376 CAS.
- B. Schwaiger and A. Blume, Rubber World, 2000, 222, 32 Search PubMed.
- H.-D. Luginsland and H. Kalscheuren, KGK, Kautsch. Gummi Kunstst., 2000, 53, 10–23 CAS.
- Y. C. Ou, Z. Z. Yu, A. Vidal and J. B. Donnet, Rubber Chem. Technol., 1994, 67, 834–844 CrossRef CAS.
- G. Mathew, M. Y. Huh, J. M. Rhee, M. H. Lee and C. Nah, Polym. Adv. Technol., 2004, 15, 400–408 CrossRef CAS.
- N. Suzuki, M. Ito and F. Yatsuyanagi, Polymer, 2005, 46, 93–201 Search PubMed.
- A. L. Medalia, Rubber Chem. Technol., 1974, 47, 411–433 CrossRef CAS.
- M. P. Wanger, Rubber Chem. Technol., 1976, 49, 703–774 CrossRef.
- U. Görl, A. Hunsche, A. Muller and H. G. Koban, Rubber Chem. Technol., 1997, 70, 608–623 CrossRef.
- J. Ramier, L. Chazeau and C. Gauthier, Rubber Chem. Technol., 2007, 80, 183–193 CrossRef CAS.
- S. S. Choi, I. S. Kim and C. S. Woo, J. Appl. Polym. Sci., 2007, 106, 2753–2758 CrossRef CAS.
- J. L. Valentin, P. Posadas, A. Marcos-Fernandez, L. Ibarra and A. Rodrguez, J. Appl. Polym. Sci., 2006, 99, 3222–3229 CrossRef CAS.
- H. X. Yan, K. Sun, Y. Zhang, Y. X. Zhang and Y. Z. Fan, J. Appl. Polym. Sci., 2004, 94, 1511–1518 CrossRef CAS.
- L. Meledina, K. Kandyrin, C. S. Knee and G. Zaikov, Macromol. Symp., 2007, 247, 147–155 CrossRef CAS.
- L. L. Qu, G. Z. Yu and L. L. Wang, J. Appl. Polym. Sci., 2012, 126, 116–126 CrossRef CAS.
- Y. Li, B. Y. Han, S. P. Wen, Y. L. Lu, H. B. Yang, L. Q. Zhang and L. Liu, Composites, Part A, 2014, 62, 1–10 CrossRef CAS PubMed.
- Y. Li, B. Y. Han, L. Liu, F. Z. Zhang, L. Q. Zhang, S. P. Wen, Y. L. Lu, H. B. Yang and J. Shen, Compos. Sci. Technol., 2013, 88, 69–75 CrossRef CAS PubMed.
- S. K. H. Thiele, J. Kiesekamp, S. Rulhoff and D. Bellgardt, KGK, Kautsch. Gummi Kunstst., 2011, 11/12, 26–41 Search PubMed.
- K. Hasegawa, T. Sone, T. Yuasa and T. Tadaki, Modified solution SBR technology for the lower rolling resistance tire, International Rubber Conference 2010 (held in Mumbai, India), Nov.17th–19th.
- M. Hayashi, H. Hama and K. Inagaki, Development and Foresight of solution SBR for energy-saving tires; R&D Report, “SUMITOMO KAGAKU”, vol. 2011-I.
- F. M. Fowkes, J. Phys. Chem., 1963, 67, 2538–2541 CrossRef CAS.
- K. W. Stöckelhuber, A. Das, R. Jurk and G. Heinrich, Polymer, 2010, 51, 1954–1963 CrossRef PubMed.
- S. Mihara, R. N. Datta and J. W. M. Noordermeer, Rubber Chem. Technol., 2009, 82, 524–540 CrossRef CAS.
- M. J. Wang, Rubber Chem. Technol., 1998, 71, 520–589 CrossRef CAS.
- K. W. Stöckelhuber, A. S. Svistkov, A. G. Pelevin and G. Heinrich, Macromolecules, 2011, 44, 4366–4381 CrossRef.
- C. Gauthier, E. Reynaud, R. Vassoille and L. Ladouce-Stelandre, Polymer, 2004, 45, 2761–2771 CrossRef CAS PubMed.
- G. Kraus, J. Appl. Polym. Sci.: Appl. Polym. Symp., 1984, 39, 75–92 CAS.
- G. Heinrich and M. Klüppel, Adv. Polym. Sci., 2002, 160, 1–44 CrossRef CAS.
- E. Guth and O. Gold, Phys. Rev., 1938, 53, 322–328 CAS.
- E. Guth, J. Appl. Phys., 1945, 16, 20–25 CrossRef CAS PubMed.
- M. J. Wang, Rubber Chem. Technol., 1999, 72, 430–448 CrossRef CAS.
- A. L. Medalia, J. Colloid Interface Sci., 1970, 32, 115–131 CrossRef CAS.
- G. Kraus, Rubber Chem. Technol., 1971, 41, 199–213 CrossRef.
- H.-D. Luginsland, J. Fröhlich and A. Wehmeier, Rubber Chem. Technol., 2002, 75, 563–579 CrossRef CAS.
- S. Rooj, A. Das, K. W. Stöckelhuber, D. Y. Wang, V. Galiatsatos and G. Heinrich, Soft Matter, 2013, 9, 3798–3808 RSC.
| This journal is © The Royal Society of Chemistry 2014 |


