DOI:
10.1039/C4RA09415H
(Paper)
RSC Adv., 2014,
4, 58816-58825
Reinforcing efficiency and compatibilizing effect of sol–gel derived in situ silica for natural rubber/chloroprene rubber blends†
Received
28th August 2014
, Accepted 23rd October 2014
First published on 24th October 2014
Abstract
Nano silica is grown, in situ, in natural rubber (NR)/chloroprene rubber (CR) blends, by the soaking sol–gel method. Much better silica dispersion in the rubber blends is achieved following this technique in comparison to the rubber blends with externally filled silica at the same filler loading and same blend composition. This leads to a significant improvement in modulus, tensile strength and dynamic mechanical properties of all the in situ silica filled composites relative to externally filled composites. Additionally, analysis of glass transition temperature (Tg) values reveals that compatibility of NR and CR in the blend is enhanced when silica is incorporated in situ which in turn contributes to improving the physical properties of the composites. This enhancement in the compatibility of rubber blends is attributed to the preferential accumulation of in situ silica at the interphase of the two constituent rubbers. The best mechanical properties are shown by the in situ filled composite with NR/CR at a 40/60 blend ratio. This result is in agreement with the rheological properties, thermal properties and viscoelastic behaviors of this particular composite. The ultimate properties of the composites are found to be governed by the blend composition, blend compatibility and state of filler dispersion, in addition to the filler content.
1 Introduction
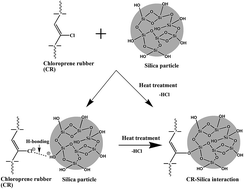
Rubber blends composed of different rubbers find many important applications owing to their superior properties which may not be otherwise achieved by individual components.1,2 Likewise, blends of NR and CR have been extensively studied by different groups from different viewpoints.3–12 NR possesses good mechanical and dynamic properties. However, it has several limitations like poor oil and ozone resistance and a degradation tendency under thermal ageing.13 Blending of CR with NR in suitable proportions has been proven to be very useful in overcoming such shortcomings of NR.3–12 In most of the reported work, silica is incorporated in the rubber blends by external mixing for reinforcement purposes.4,5 The role of silica in the reinforcement and curing characteristics of the individual components, viz. NR and CR, is different owing to the polarity differences of NR and CR. The highly polar nature of silica, due to the presence of a large number of hydrophilic silanol groups on its surface, gives rise to strong filler–filler interactions resulting in filler agglomeration in the NR matrix.4,5 In contrast, the presence of polar CR in the blend helps in better filler dispersion and brings improvements in the mechanical properties resulting from strong CR–silica interactions through hydrogen bonds as well as chemical interactions between allylic chlorine atoms and silanol groups (Fig. 1).14,15 However, for such heterogeneous blends, consisting of polar and nonpolar rubber, blend compatibility is a major concern from the viewpoint of the mechanical properties of the composite. To counter this problem, certain polymeric species or multifunctional organic compounds have been used as compatibilizing agents.16 For example, polyvinyl chloride (PVC) and styrene butadiene rubber (SBR) have been used in NR/CR blend systems to improve the compatibility.8 Reports on the compatibilizing effect of fillers like clay are well documented in literature.17,18 Generally filler is premixed with less polar rubber, like NR or EPDM, to obtain a master batch and then this is mixed with polar rubber like HNBR, CR etc.17,18 During mixing, migration of filler from the less polar to the more polar rubber takes place with its accumulation at the interphase which enhances compatibility of the blends.17,18 However, external mixing of silica with NR or EPDM is difficult and requires multistage mixing. In this context, the soaking sol–gel method appears to be very effective for in situ silica generation in less polar rubber matrices, as they have a greater swelling tendency than polar rubber in organic TEOS (tetraethoxysilane), the silica precursor.
 |
| Fig. 1 Interaction between CR and a silanol group on the silica surface. | |
In the present work, silica generated in situ in NR/CR blends is proven to enhance the compatibility between NR and CR in the blend, in addition to having a superior reinforcement effect in comparison to externally added silica. It may be mentioned that although the reinforcement effect of in situ silica is well established,19–21 its capability in enhancing the compatibility of two immiscible rubber phases in a blend has not been reported to date. Here, we have used the soaking sol–gel method for silica generation in rubber blends using non polar TEOS. In this method, sheets of rubber blend are immersed in TEOS for sufficient time, at an initial stage, for swelling of TEOS inside the rubber matrix. It is expected that NR, being non polar in nature, will have a greater solvent uptake capability than CR leading to more silica generation in the former phase, while it is an established fact that externally added silica gives a stronger interaction with CR and hence increases crosslinking density in the CR phase of NR/CR blends.4,5,14,15 Thus, it appeared that studies of the compatibilizing capability of in situ silica, generated by this technique in NR/CR blends, in addition to its reinforcing efficiency, would be an interesting piece of study. With this objective, NR and CR were blended in varying proportions to prepare three groups of composite, viz. unfilled, in situ silica filled and externally silica filled, with similar compositions. Detailed comparative studies of these composites have been done with reference to their morphology, curing behavior, thermal properties, mechanical properties and viscoelastic behavior. Moreover, a carbon black filled NR/CR blend composite at a 40/60 ratio was prepared and its properties were compared with those of the respective silica filled composites.
2 Experimental
2.1 Materials
Natural rubber (RSS4), chloroprene rubber (LANXESS Baypren 116, XD grade), precipitated silica (Ultrasil VN3) and carbon black (N330, high abrasion furnace black) were obtained from Heritage Rubber (Nagpur, India). TEOS (tetraethoxysilane 98%) and n-butylamine were purchased from Acros Organics (New Jersey, USA). Toluene was purchased from Fischer Scientific (India). Other curatives viz. sulphur, ZnO (zinc oxide), MgO (magnesium oxide), stearic acid and CBS (N-cyclohexyl-benzothiazole-2-sulfenamide) were collected from Sara Polymer Pvt. Ltd (Nagpur, India). ETU (ethylene thiourea) was purchased from National Chemicals (India).
2.2 Preparation of in situ silica filled composites
Silica particles were generated and grown into unvulcanized NR/CR blends at different ratios by the soaking sol–gel process. First, NR and CR were blended together for 10 minutes at various blend ratios (Table 1) on a two roll mill to obtain sheets of ca. 2 mm thickness. Then these sheets were allowed to swell in TEOS for 24 hours at ambient temperature. Next, the swollen sheets were removed from TEOS and were immersed in a 10% aqueous solution of n-butylamine (catalyst) for 48 hours at the same temperature. Then the sheets were removed and dried at 50 °C for 48 hours and further dried at 80 °C in a vacuum oven to constant weight. In situ silica filled NR/CR blends were then masticated on a two roll mill for 5 minutes before compounding with other crosslinking ingredients for a further 10 minutes (the curing formulation is given in Table 1). Next, these unvulcanized sheets were press cured by compression molding at 160 °C for their corresponding cure times (t90) (Table 2) to obtain vulcanized rubber sheets of 2 mm thickness. This process was used for the preparation of in situ silica filled composites 5–8.
Table 1 Formulation of rubber composites in phr (parts by weight per hundred parts of rubber by weight)a
Samples |
1 |
2 |
3 |
4 |
5 |
6 |
7 |
8 |
9 |
10 |
11 |
12 |
13 |
Crosslinking ingredients for all the above compounds (in phr): zinc oxide – 5; magnesium oxide – 4; stearic acid – 1; CBS – 1; sulfur – 2 and ethylene thiourea – 0.5. |
Natural rubber |
80 |
60 |
40 |
20 |
80 |
60 |
40 |
20 |
80 |
60 |
40 |
20 |
40 |
Chloroprene rubber |
20 |
40 |
60 |
80 |
20 |
40 |
60 |
80 |
20 |
40 |
60 |
80 |
60 |
In situ silica |
— |
— |
— |
— |
30 |
28 |
20 |
15 |
— |
— |
— |
— |
— |
Precipitated silica (VN3) |
— |
— |
— |
— |
— |
— |
— |
— |
30 |
28 |
20 |
15 |
— |
Carbon black (HAF) |
— |
— |
— |
— |
— |
— |
— |
— |
— |
— |
— |
— |
20 |
Table 2 Curing characteristics of NR/CR blend compounds
Curing characteristics |
1 |
2 |
3 |
4 |
5 |
6 |
7 |
8 |
9 |
10 |
11 |
12 |
13 |
Cure rate index (CRI) = 100/(cure time − scorch time). |
Minimum torque (dNm) |
9.29 |
9.73 |
10.29 |
11.3 |
30.63 |
23.09 |
17.02 |
13.31 |
37.14 |
29.77 |
24.38 |
22.01 |
14.81 |
Maximum torque (dNm) |
61.8 |
61.8 |
44.44 |
41.93 |
90.6 |
79.6 |
123.8 |
72.1 |
80.9 |
70.6 |
89.1 |
93.0 |
79.9 |
ΔTorque (dNm) |
52.51 |
52.07 |
34.15 |
30.63 |
59.97 |
56.51 |
106.78 |
58.79 |
43.76 |
40.83 |
64.72 |
70.99 |
65.09 |
Cure time t90 (min) |
5.27 |
8.22 |
11.07 |
13.15 |
19.45 |
18.02 |
12.6 |
11.07 |
26.52 |
21.65 |
15.65 |
10.92 |
14 |
Scorch time (min) |
1.75 |
2.4 |
2.7 |
2.88 |
1.21 |
1.56 |
1.95 |
1.97 |
1.58 |
1.46 |
1.35 |
1.22 |
1.50 |
Cure rate indexa (min−1) |
28.40 |
17.18 |
11.94 |
9.73 |
5.48 |
6.07 |
9.38 |
10.98 |
4.009 |
4.95 |
6.99 |
10.30 |
8.00 |
Crosslinking density (ν × 103) |
2.19 |
2.28 |
4.1 |
4.32 |
7.75 |
5.61 |
6.29 |
10.9 |
3.41 |
5.85 |
7.48 |
11.6 |
8.86 |
2.3 Preparation of unfilled and externally filled rubber blend composites
For the other composites, blending of natural rubber and chloroprene rubber at various blend ratios was carried out on a two roll mill. Composites 9–12 were prepared by externally mixing the NR/CR blend with precipitated silica for 15 minutes on a two roll mill followed by mixing with crosslinking ingredients for a further 10 minutes. The curing formulation and filler content of composites 9–12 are given in Table 1. Composite 13 was prepared in the same manner but using carbon black as a filler instead of silica. Similarly, composites 1–4 were prepared on a two roll mill in the same manner as 9–12 but without adding any filler. All the above unvulcanized sheets were press cured by compression molding at 160 °C for their corresponding cure times (t90) (Table 2) to obtain vulcanized rubber sheets of 2 mm thickness.
2.4 Characterization techniques
Cure studies of the unvulcanized rubber compounds were performed by using an oscillatory disc rheometer (Micro Vision Enterprises India) with an amplitude of ±3° and a frequency of 1.66 Hz for all the samples at 160 °C for 60 minutes. Vulcanization of the rubber compounds was carried out according to the respective cure time of the compounds. Scanning electron microscopy (SEM) images of silica filled composites were obtained using a field emission scanning electron microscope (SEM; Zeiss Ultra Plus; Carl Zeiss Microscopy GmbH, Jena, Germany) equipped with an energy-dispersive X-ray spectrometer (EDX; Quad XFlash 5060, Bruker Corporation, Billerica, MA, USA) at an acceleration voltage of 3 kV. The samples were cut with an ultramicrotome and sputter coated with 3 nm platinum. Thermal properties and in situ silica content of the rubber vulcanizates were determined by thermogravimetric analysis (TGA) and derivative thermogravimetry (DTG) by using a thermal analyzer TG-DTA 7200 (Hitachi, Japan). Samples were placed in a platinum pan and were heated in the temperature range 30–700 °C under a nitrogen atmosphere at the heating rate of 10 °C min−1. The silica content of the in situ filled rubber composites (5–8) has been determined from the residual weight percentage of a particular composite, relative to its unfilled analogue, as obtained from thermogravimetric results. Tensile tests of dumbbell shaped samples were carried out on a material testing machine (Zwick1456, Z010, Ulm, Germany) with crosshead speed 200 mm min−1 (ISO 527). The hardness of the composites was determined on the Shore A scale by a Shore A durometer (BSE testing machines, India). Dynamic mechanical analysis was performed with an Eplexor 2000 N dynamic measurement system (Gabo Qualimeter, Ahlden, Germany) by using a constant frequency of 10 Hz in a temperature range −100 °C to +140 °C. All the measurements were done in tension mode. For the measurement of the complex modulus, E*, a static load of 1% pre-strain was applied and then the samples were oscillated to a dynamic load of 0.5% strain. All the measurements were done with a heating rate of 2 °C min−1 under liquid nitrogen flow. Swelling measurements were carried out by soaking the cured sheet in toluene for 7 days at room temperature. After each 24 hour, solvent was changed to fresh toluene. Sheets were removed after seven days, blotted with blotting paper and their weight was determined on an analytical balance. Crosslinking density (ν), defined by the number of elastically active chains per unit volume, was calculated by the Flory–Rehner eqn (1).22 |
ν = −[ln(1 − Vr) + Vr + χVr2]/Vs(Vr1/3 − Vr/2)
| (1) |
where Vs is the molar volume of the toluene (106.2), Vr is the volume fraction of rubber in the swollen gel and χ is the Flory–Huggins polymer–solvent interaction parameter.22-24
3 Results and discussion
3.1 Curing behavior
Curing characteristics of all the compounds are illustrated in Table 2. Among the unfilled compounds (1–4), a consistent delay in cure time and scorch time is observed with increasing CR proportion in the blend. This can be attributed to the scorch prevention characteristics of CR.25 On the other hand, for the in situ silica filled compounds (5–8), both the blend proportion and the silica content influence the cure properties. Compounds with higher silica and higher NR contents (5 and 6) show some cure retardation effects which might be due to the adsorption of the cure accelerators by the surface silanols of the silica. This is much as expected for a compound composed of non-polar rubber and silica.4,5,26,27 In contrast, for the compounds with higher CR content (7 and 8), this effect is relatively mild owing to the strong interaction between CR and silica (Fig. 1).26,27 Maximum torque, which is closely related to the crosslinking density, is found to be improved for all the in situ silica filled compounds (5–8). This indicates a higher crosslinking density in this series arising from the strong CR–silica interaction (eqn (1), Table 2). It is reported in the literature that silica itself, as a filler, can crosslink the CR matrix without any curatives (Fig. 1).15 Nevertheless, the highest value of torque is observed for composite 7 which gives an indication of a better compatibility for this particular blend ratio (NR/CR: 40/60), as supported by significant reinforcement and a better rubber–filler interaction for this composite in subsequent studies. For externally silica filled composites (9–12), higher compound viscosity (minimum torque) is observed, relative to in situ silica filled composites (5–8). This might be due to the silica agglomeration in the rubber matrix, in the former case, resulting from relatively stronger filler–filler interactions as revealed in the morphological study (discussed later). Also, lower values of maximum torque and longer cure times are obtained for externally filled composites, as compared to those of in situ silica filled composites, indicating a much pronounced cure retardation effect in the former case. This might be due to a greater adsorption of the cure accelerators via surface silanols of silica for this group of composites. Notably, this effect is less in composites 11 and 12 which have high CR contents in the blends. This is due to the preference of silica to move towards the CR phase during external mixing owing to strong CR–silica interactions.26,27
3.2 Thermogravimetric study
The silica content of the in situ filled rubber composites (5–8) has been determined from the residual weight percentage obtained from thermogravimetric results (Table 1). It is observed that silica content in the rubber blend composites decreases consistently as the CR content in the blends increases. This trend in silica generation can be explained by the different affinities of NR and CR for absorbing TEOS inside the matrix. In the soaking sol–gel method, rubber sheets are immersed in TEOS at the initial stage for sufficient time. CR, being polar, has a lower degree of swelling in TEOS than that of NR. Since silica generation is governed by the amount of imbibed TEOS inside the rubber matrix, a lower degree of swelling leads to less silica generation in the blends with higher CR proportions.28,29 Thus, the amount of silica generation in the rubber matrix is governed by the blend ratio and phase selective swelling.
The onset temperature and Tmax (temperature at maximum weight loss) for individual NR and CR phases for all the composites are given in Table 3. Thermogravimetric analysis shows a fall in onset temperature (300–340 °C) for the unfilled blends (1–4) as the NR percentage in the blends decreases. Two peaks are observed in the DTG curves which correspond to the Tmax for the individual component i.e. NR phase (310–355 °C) and CR phase (430–441 °C). It is interesting to note here that Tmax values for both the components change with the variation in the blend ratio. This clearly shows the influence of the blend ratio on the thermal properties of the rubber blend composites (Fig. 2). The improvement in thermal stability brought about by silica incorporation in the filled composites, relative to the analogous unfilled composites, is evident from the analysis of thermal data. Incorporation of silica in the rubber matrix certainly results in the confinement of rubber chains due to development of polymer–filler interactions. This retards the thermal degradation of the composites and eventually leads to the delayed onset temperature and Tmax.30 Nevertheless, the highest level of improvement in thermal properties relative to the respective unfilled composite is exhibited by composite 7 whose mechanical properties and rubber–filler interaction are found to be best in subsequent studies.
Table 3 Thermogravimetric data of NR/CR blend compositesa
NR/CR ratio |
Unfilled blends |
In situ silica filled composites |
Externally silica filled composites |
Composite |
Onset (°C) |
Tmax (°C) |
Composite |
Onset (°C) |
Tmax (°C) |
Composite |
Onset (°C) |
Tmax (°C) |
NR |
CR |
NR |
CR |
NR |
CR |
Tmax – temperature at maximum weight loss. |
80/20 |
1 |
337.8 |
352.9 |
430.0 |
5 |
343.0 |
354.6 |
438.1 |
9 |
343.0 |
354.0 |
433.3 |
60/40 |
2 |
322.6 |
340.1 |
437.0 |
6 |
335.5 |
345.5 |
440.6 |
10 |
334.5 |
344.3 |
436.2 |
40/60 |
3 |
310.0 |
316.0 |
438.0 |
7 |
329.4 |
335.9 |
441.0 |
11 |
324.2 |
334.4 |
438.0 |
20/80 |
4 |
300.0 |
310.0 |
434.0 |
8 |
317.0 |
324.9 |
435.0 |
12 |
317.0 |
324.9 |
434.3 |
 |
| Fig. 2 Thermogravimetric curves of in situ silica filled composites (5–8). | |
3.3 Morphology
The phase morphology of an elastomer blend is very much dependent on various factors like blend ratio, surface characteristics, viscosity of the components, blending method etc.28 Studies using scanning electron microscopy (SEM) reveal the presence of nearly spherical in situ silica particles (aggregates) with an average size of 60 nm for all the in situ filled composites 5–8 (Fig. 3). Growth of silica inside a rubber matrix in the soaking sol–gel method proceeds via inverse micelle formation.31,32 The micelle formed in this system may be viewed as water in oil (water in rubber) type. The primary alkyl amine, used as a catalyst, behaves as a surfactant which surrounds the centered water molecules. The polar amine ends are faced towards the center while the long alkyl chains are directed outwards to form the inverse micelle as depicted in Fig. 4. The alkyl chain, being a non polar moiety, allows the easy diffusion of non polar TEOS molecules in between the alkyl chains and facilitates their movement towards the interface of the micelle. The hydroxyl groups of water hydrolyse the TEOS molecules with the exchange of ethoxy groups and increase the polarity of partially hydrolysed TEOS molecules. Eventually more TEOS molecules migrate towards the center of the micelle and the condensation of hydrolyzed TEOS molecules takes place to form solid silica particles.31,32
 |
| Fig. 3 Scanning electron microscopy (SEM) images of NR/CR in situ silica filled composites: 80/20 – In Si-30 (5); 60/40 – In Si-28 (6); 40/60 – In Si-20 (7) and 20/80 – In Si-15 (8). | |
 |
| Fig. 4 Schematic representation of inverse micelle formation for silica growth into a rubber matrix. | |
It is expected that silica would be generated mostly in the NR phase of the blends due to the greater solvent (TEOS) uptake capability of NR over CR during the soaking stage. However, uniform homogeneous dispersion of silica throughout the rubber blend matrix for composites 5–7 is observed where distinct phases of two different rubbers can hardly be observed (Fig. 3). It is a well-established fact that at the mixing stage, the solubility parameter of the compounds influences the distribution of filler into rubber blends.33,34 Hildebrand solubility parameters are reported as 8–8.5 for NR, 9–9.5 for CR and 14–18 for silica.33,34 Thus it is evident that silica is more compatible with CR than NR leading to migration of silica from the less polar NR phase to the more polar CR phase which can be a favorable factor in enhancing the compatibility of these two phases in a blend. Such migration of silica from the less polar NR phase to the more polar CR phase takes place during compounding and vulcanization and this is well documented in the literature.17,18,35,36 Migration of nanoclay and its accumulation at the interphase in elastomer blends (CR/EPDM) has been shown to be a favourable factor in enhancing the compatibility of two different rubber phases in a blend.17 However, for composite 8, which contains the lowest NR content, a heterogeneous distribution of silica is evident from the SEM image (Fig. 3). A continuous CR phase is observed here in which in situ silica reinforced NR is present as a dispersed phase. A better view is presented in the ESI, Fig. S1.†
The SEM image of externally silica filled composite at a 40/60 blend ratio (11) is shown in Fig. 5(a) as a representative example. It shows a heterogeneous silica distribution into the rubber blend matrix with a large number of silica aggregates. This clearly exposes the worse filler dispersion of silica in the rubber matrix, when added externally under similar conditions, in comparison to the dispersion of silica generated in situ by the sol–gel process for a similar blend. From the Si mapped SEM EDS (energy dispersive spectroscopy) image (Fig. 5(b)), large sized silica agglomerates in the rubber matrix are also noted. Moreover, two distinct rubber phases are evident in the SEM image of composite 11 indicating heterogenous morphology and the incompatibility of the blends in the externally silica filled composite. The heterogeneous distribution of silica is further confirmed from the SEM EDS studies of this composite. The elemental distribution in two different regions as analysed by EDS is shown in Fig. 6. Intensities of silicon (Si) and oxygen (O) peaks are found to vary widely at the different regions indicating the heterogeneous distribution of filler into the rubber blend matrix.
 |
| Fig. 5 (a) Scanning electron microscopy (SEM) image and (b) silicon mapped SEM EDS image of externally silica filled composite at a 40/60 blend ratio (11). | |
 |
| Fig. 6 SEM image with EDS pattern for externally silica filled composite at a 40/60 blend ratio (11). | |
3.4 Stress–strain studies
Mechanical properties of all the NR/CR composites were evaluated by stress–strain studies (Table 4 and Fig. 7). It is observed that modulus, tensile strength and elongation at break of all the unfilled blends (1–4) increase with increase in the CR content in the blend. This is attributed to the increased crosslinking density (determined by swelling studies), in moving from 1 to 4 as shown in Table 2.37 Significant improvements in modulus and tensile strength for all the in situ silica filled composites (5–8) is observed in comparison to unfilled (1–4) and externally silica filled (9–12) composites of similar composition. Among the in situ silica filled composites, the best mechanical properties are achieved for composite 7 with NR/CR at a 40/60 blend ratio. It may be recalled here that the biggest improvement in thermal properties as well as the highest torque value were shown by this particular composite in earlier studies. It is noteworthy that the filler content of this composite is less than that of composites 5 and 6 which have NR/CR blend ratios of 80/20 and 60/40 respectively. However, the level of improvement, in comparison to the respective unfilled composites of the same blend ratio, is highest for composite 5 which contains the highest in situ silica. Therefore, it is quite reasonable to conclude that not only the filler content but also the blend ratio can play an important role in governing the ultimate properties of the composites. The improvement in mechanical properties for the in situ silica filled composites is attributed to the homogeneous dispersion of silica, strong rubber–filler interaction and enhanced compatibility of the blends brought about by in situ silica loading.
Table 4 Mechanical properties of NR/CR blend composites
Composite |
1 |
2 |
3 |
4 |
5 |
6 |
7 |
8 |
9 |
10 |
11 |
12 |
13 |
σ100% (MPa) |
0.55 |
0.57 |
0.69 |
0.75 |
1.51 |
1.14 |
1.53 |
1.38 |
1.20 |
1.29 |
1.34 |
1.76 |
1.33 |
σ300% (MPa) |
1.09 |
1.13 |
1.30 |
1.27 |
4.33 |
3.39 |
4.39 |
3.39 |
2.98 |
3.39 |
3.49 |
4.34 |
5.56 |
Tensile strength (MPa) |
6.80 |
7.74 |
18.55 |
22.65 |
16.35 |
14.65 |
22.19 |
20.09 |
7.52 |
7.63 |
10.99 |
11.33 |
11.6 |
Elongation at break (%) |
684 |
655 |
826 |
953 |
667 |
667 |
798 |
690 |
552 |
513 |
559 |
506 |
421 |
Hardness (Shore A) |
39.4 |
43 |
45.6 |
48.6 |
60.2 |
60 |
61.2 |
58.6 |
51.6 |
54.8 |
56.2 |
62.2 |
54.4 |
 |
| Fig. 7 (a) Stress–strain curves of unfilled composites (1–4) and in situ silica filled composites (5–8); (b) stress–strain curves of unfilled composite (3), in situ silica filled composite (7), externally silica filled composite (11) and carbon black filled composite (13). | |
In the case of externally silica filled composites (9–12), although improvement in modulus compared to respective unfilled composites is observed, it is inferior to the improvement achieved for in situ silica filled composites (5–8). However, falls in tensile strength (except composite 9) as well as in elongation at break for this group of composites compared to unfilled ones show that the reinforcement effect caused by externally added silica is of less significance. This is due to severe agglomeration of silica particles in the rubber matrix, as revealed in the SEM study, in addition to lower crosslinking density values for these externally filled composites.5 Unlike in situ filled composites, this group of composites, irrespective of silica loading, shows the same trend in modulus and tensile strength values as shown by unfilled blend composites. This shows that the contribution of silica to mechanical properties is not so significant when it is added externally.
For comparison purposes, one composite (13) was prepared with externally filled carbon black (HAF) at the same blend ratio and same filler content as those of composite 7 (Fig. 7(b)). Composite 13 shows a better modulus value at 100% and 300% strain but its tensile strength and elongation at break are much less than those of composite 7.
Hardness values of the unfilled composites (1–4) are found to increase consistently along the series with increasing CR content as CR contributes higher viscosity and greater crosslinking density in the blends. Hardness values of the composites become significantly higher by incorporation of silica, by 8–12 points in the Shore A scale. The highest value is shown by composite 7 where the tensile properties are found to be best.
3.5 Dynamic mechanical properties
Dynamic mechanical analysis (DMA) of all the composites has been done to assess the effect of filler incorporation on the dynamic response of the composites since this can deliver important information about the blend compatibility, viscoelastic properties and rubber–filler interaction.17,37–40 The dependency of storage modulus on temperature is shown in Fig. 8. The storage modulus values of the composites can be regarded as a direct measure of the reinforcement effect of the filler which is very much dependent on the state of filler dispersion, rubber–filler interaction and compatibility of the blend. In the present case, the storage modulus in the rubbery region increases for unfilled composites (1–4) with increasing CR content in the blends (Fig. 8(a)) which is in accordance with the increased crosslinking density as discussed in earlier sections. For the in situ silica filled composites (5–8), incorporation of silica results in significant reinforcement as shown by the higher storage modulus values in the rubbery region (above Tg) for all the blend ratios, as expected (Fig. 8(a)). A comparison of storage modulus values among the in situ silica filled composites (5–8) reveals the highest value for composite 7, the composite that shows the best mechanical properties. The value is also high for blend composite 5 which shows the maximum level of improvement in comparison to respective unfilled blends in the stress–strain study. Another notable observation here is the low storage modulus value of 8 relative to other in situ filled composites which is due to distribution of silica mostly in the NR phase of the blend as found in SEM micrographs (Fig. 3 and ESI Fig. S1†). It is also worthwhile to note here that the improvement in storage modulus values is very significant for in situ silica filled composites in comparison to externally filled composites of similar composition, which is in accordance with the observation made in the stress–strain studies (Fig. 8(b)). This is primarily attributed to the homogeneous dispersion of in situ silica in the rubber matrix and strong rubber–filler interaction between CR and silica. In addition, improved compatibility between NR and CR caused by the incorporation of in situ silica can further enhance the reinforcement effect. The improvement in blend compatibility is achieved by accumulation of silica at the NR/CR interphase, during its diffusion from the NR to the CR phase in the curative mixing stage. Carbon black filled composite (13) at the same filler loading and at the same blend ratio as those in composite 7 shows a lower storage modulus value than 7 (Fig. 8(b)). However, its viscoelastic behaviour is found to be more or less the same as that of the corresponding externally silica filled composite 11.
 |
| Fig. 8 (a) Storage modulus versus temperature curves of unfilled composites (1–4) and in situ silica filled composites (5–8); (b) storage modulus versus temperature curves of unfilled composite (3), in situ silica filled composite (7), externally silica filled composite (11) and carbon black filled composite (13). | |
Improvement in blend compatibility is confirmed by analysing the glass transition temperatures (Tg) obtained from temperature versus tan
δ curves of the constituent rubber phases in the blends, for all the composites (Fig. 9, Table 5). Two distinct tan
δ peaks corresponding to the characteristic Tgs of the individual rubber phases (Tg(NR) and Tg(CR)) are observed in Fig. 9. In general, the Tg value is influenced by polymer–filler interactions and the extent of compatibility in a blend. A strong polymer–filler interaction causes a positive shift in Tg. On the other hand, enhancement in compatibility in an elastomer blend results in the shifting of the Tg values of the two individual phases towards each other.17,18 Among the unfilled composites (1–4), analysis of ΔTg (the separation of Tg between the two individual phases) shows that compatibility of the blends depends on the blend ratio and is highest for composite 3 (NR/CR: 40/60) which has the minimum ΔTg value. Careful analysis of Tg values for individual rubber phases and ΔTg values has been done for unfilled, in situ filled and externally filled composites for each NR/CR blend ratio and the results are tabulated in Table 5. Results in Table 5 show that individual Tg and ΔTg values for all the composites have been influenced by the incorporation of silica. In the case of externally filled composites (9–12), both Tg(NR) and Tg(CR) values show a positive shift in comparison to those in respective unfilled composites (1–4). This is attributed to the polymer–filler interaction in both the NR and CR phases brought about by filler incorporation. Interestingly, for all the in situ filled composites (5–8), Tg(NR) is shifted in a positive direction but Tg(CR) is moved in the opposite direction for each composite with reference to respective unfilled composites. The positive shift of Tg(NR) is much as expected due to the increased polymer–filler interaction while the reverse trend of Tg(CR) is due to enhancement of blend compatibility as revealed by the morphology study in the earlier section. This clearly shows that the influence of blend compatibility enhancement, brought about by in situ silica, dominates over the effect of the CR–silica interaction and, as a result, a negative shift of Tg(CR) takes place. Furthermore, comparison of ΔTg values among the three groups of composites shows that ΔTg values are comparable for unfilled composites (1–4) and externally filled composites (9–12) whereas they significantly decrease for in situ filled composites (5–8) (ESI Fig. S2†). These results confirm the enhancement in compatibilty of this immiscible blend brought about by silica when incorporated in situ into the rubber matrix in contrast to the insignificant effect when silica is added externally. The best compatibility effect exhibited by in situ filled composite 7 (NR/CR at a 40/60 blend ratio), with minimum ΔTg, offers a rationale for the best mechanical, thermal and curing properties observed for this particular composite.
 |
| Fig. 9 Temperature versus tan δ curves of the unfilled composite (3), in situ silica filled composite (7), externally silica filled composite (11) and carbon black filled composite (13) at a 40/60 blend ratio. | |
Table 5 Glass transition temperature, Tg, (°C) of the compositesa
NR/CR ratio |
Unfilled blends |
In situ silica filled composites |
Externally silica filled composites |
Composite |
Tg(NR) |
Tg(CR) |
ΔTg |
Composite |
Tg(NR) |
Tg(CR) |
ΔTg |
Composite |
Tg(NR) |
Tg(CR) |
ΔTg |
Tg(NR): glass transition temperature of NR phase; Tg(CR): glass transition temperature of CR phase; ΔTg: separation of Tg values. |
80/20 |
1 |
−60.4 |
−35.5 |
24.9 |
5 |
−59.3 |
−36.5 |
22.8 |
9 |
−58.8 |
−33.5 |
25.3 |
60/40 |
2 |
−61.8 |
−36.8 |
25 |
6 |
−59.5 |
−37.5 |
22 |
10 |
−59.9 |
−34.9 |
25 |
40/60 |
3 |
−58.9 |
−37.5 |
21.4 |
7 |
−56.9 |
−39.4 |
17.5 |
11 |
−55.5 |
−34.4 |
21.1 |
20/80 |
4 |
−63.3 |
−35.9 |
27.5 |
8 |
−60.2 |
−36.0 |
24.2 |
12 |
−58.9 |
−31.8 |
27.1 |
A comparative study has been done for unfilled, in situ silica filled, externally silica filled and carbon black filled composites for NR/CR at a 40/60 blend ratio and is presented in Fig. 9. The lowering of the tan
δ peak is evident in both the phases for the in situ filled composite (7). This clearly indicates that a better rubber–filler interaction is achieved for in situ filled composite compared to that achieved in the other composite groups.
4 Conclusions
The reinforcing efficiency and compatibilizing effect of in situ silica, generated by the soaking sol–gel method, have been evaluated for NR/CR blends. The amount of silica generation in the rubber matrix is mostly governed by the blend composition owing to the different solvent uptake capability of the constituent rubber phases. SEM images show a more uniform dispersion of nano silica throughout the rubber matrix in in situ silica filled composites than in externally filled composite. Significant improvements in modulus and tensile strength are observed for all the in situ silica filled composites in comparison to unfilled and externally silica filled composites of the same blend ratio and at the same filler loading. This is attributed to the uniform filler dispersion and enhanced compatibility of the blends achieved by the generation of silica in situ in rubber blends. The significant reinforcement and compatibilization effects of in situ silica for the NR/CR blends are also strongly supported by the DMA studies. It is proposed that a concentration gradient of filler in the blend matrix may arise due to differences in solubility parameters of NR, CR and silica. This leads to migration of silica from the less polar NR to the more polar CR during physical mixing of the curatives which is associated with the accumulation of silica at the interphase of the blends. This results in enhancement in compatibility for such immiscible blends and an overall improvement in mechanical properties. Among the in situ silica filled composites, the best mechanical properties are achieved for NR/CR at a 40/60 blend ratio. However, the level of improvement is maximum for the composite with NR/CR at a 80/20 blend ratio, containing the highest in situ silica, with respect to the unfilled composite of the same blend ratio. This clearly shows that not only the filler content and its nature but also the blend composition and blend compatibility can play a significant role in governing the ultimate properties of a composite. The present study thus reveals the potential of in situ silica as a reinforcing filler as well as a compatibilizer for immiscible rubber blends composed of polar and non polar constituents. This study is expected to open up further explorations on the role of in situ silica that can be of great importance for other systems too, if proper formulation and filler loading techniques are adopted.
Acknowledgements
Mr B. P. Kapgate thanks VNIT, Nagpur for fellowship assistance. The authors are thankful to Prof. Gert Heinrich, Dr Amit Das and Mr Debdipta Basu, Leibniz Institute of Polymer Research, Dresden, Germany for extending help and cooperation.
References
- Blends of Natural Rubber: Novel Techniques for Blending With Specialty Polymers, ed. A. J. Tinker and K. P. Jones, Springer, 1998 Search PubMed.
- D. R. Paul, Polymer blends, Elsevier, 1978 Search PubMed.
- H. Ismail and H. C. Leong, Polym. Test., 2001, 20, 509–516 CrossRef CAS.
- P. Sae-oui, C. Sirisinha, T. Wantana and K. Hatthapanit, J. Appl. Polym. Sci., 2007, 104, 3478–3483 CrossRef CAS.
- P. Soe-Oui, C. Sirisinaha and H. Hatthapanit, eXPRESS Polym. Lett., 2007, 1, 8–12 CrossRef.
- A. R. Freitas, A. F. Rubira and E. C. Muniz, Polym. Degrad. Stab., 2008, 93, 601–607 CrossRef CAS PubMed.
- H. Ismail, C. L. Ho and C. C. Lim, Polym.-Plast. Technol. Eng., 2001, 40, 505–517 CrossRef CAS PubMed.
- A. L. Saad and S. El-Sabbagh, J. Appl. Polym. Sci., 2001, 79, 60–71 CrossRef CAS.
- F. M. Helaly and S. H. El-Sabbagh, J. Elastomers Plast., 2002, 34, 335–348 CrossRef CAS.
- A. Das, A. K. Ghosh and D. K. Basu, KGK, Kautsch. Gummi Kunstst., 2005, 58, 230–238 CAS.
- S. S. Choi, J. H. Jang and S. H. Im, Macromol. Res., 2010, 18, 358–362 CrossRef CAS.
- S. Z. Salleh, H. Ismail and Z. Ahmad, J. Polym. Eng., 2013, 33, 803–811 CAS.
- M. N. Alam, S. K. Mandal, K. Roy and S. C. Debnath, Int. J. Ind. Chem., 2014, 5, 1–11 CrossRef.
- P. Sae-oui, C. Sirisinha, U. Thepsuwan and K. Hatthapanit, Eur. Polym. J., 2007, 43, 185–193 CrossRef CAS PubMed.
- G. Wang, M. Li and X. Chen, J. Appl. Polym. Sci., 1999, 72, 577–584 CrossRef CAS.
- P. Kumari, C. K. Radhakrishnan, S. George and G. Unnikrishnan, J. Polym. Res., 2008, 15, 97–106 CrossRef CAS.
- A. Das, R. N. Mahaling, K. W. Stöckelhuber and G. Heinrich, Compos. Sci. Technol., 2011, 71, 276–281 CrossRef CAS PubMed.
- Z. Ali, H. H. Le, S. Ilisch, T. Thurn-Albrecht and H. J. Radusch, Polymer, 2010, 51, 4580–4588 CrossRef CAS PubMed.
- M. Messori, In Situ Synthesis of Rubber Nanocomposites, in Recent Advances in Elastomeric Nanocomposites, Springer, Berlin Heidelberg, 2011, pp. 57–85 Search PubMed.
- L. Wahba, M. D'Arienzo, R. Donetti, T. Hanel, R. Scotti, L. Tadiello and F. Morazzoni, RSC Adv., 2013, 3, 5832–5844 RSC.
- B. P. Kapgate, C. Das, D. Basu, A. Das, G. Heinrich and U. Reuter, J. Appl. Polym. Sci., 2014, 131(15) DOI:10.1002/app.40531.
- L. H. Sperling, Introduction to physical polymer science, Wiley, 2005 Search PubMed.
- S. B. Harogoppad and T. M. Aminabhavi, Macromolecules, 1991, 24, 2598–2605 CrossRef CAS.
- J. E. Mark, Physical properties of polymers handbook, Springer, New York, 2007, p. 1076 Search PubMed.
- R. T. Vanderbilt, The Vanderbilt Rubber Handbook, Vanderbilt Company, 1990 Search PubMed.
- S. S. Choi, J. Appl. Polym. Sci., 2002, 83, 2609–2616 CrossRef CAS.
- A. Das, S. C. Debnath, D. De and D. K. Basu, J. Appl. Polym. Sci., 2004, 93, 196–200 CrossRef CAS.
- B. P. Kapgate, C. Das, A. Das, D. Basu, U. Reuter and G. Heinrich, J. Sol-Gel Sci. Technol., 2012, 63, 501–509 CrossRef CAS.
- H. Tanahashi, S. Osanai, M. Shigekuni, K. Murakami, Y. Ikeda and S. Kohjiya, Rubber Chem. Technol., 1998, 71, 38–52 CrossRef CAS.
- Z. Peng, L. X. Kong, S. D. Li, Y. Chen and M. F. Huang, Compos. Sci. Technol., 2007, 67, 3130–3139 CrossRef CAS PubMed.
- Y. Ikeda, S. Poompradub, Y. Morita and S. Kohjiya, J. Sol-Gel Sci. Technol., 2008, 45, 299–306 CrossRef CAS PubMed.
- E. Miloskovska, M. R. Hansen, C. Friedrich, D. Hristova-Bogaerds, M. van Duin and G. de With, Macromolecules, 2014, 47, 5174–5185 CrossRef CAS.
- R. Grossman, The mixing of rubber, ed. R. F. Grossman, Chapman & Hall, London, 1997 Search PubMed.
- D. Mangaraj, Rubber Chem. Technol., 2002, 75, 365–427 CrossRef CAS.
- J. B. Gardiner, Rubber Chem. Technol., 1969, 42, 1058–1078 CrossRef CAS.
- C. M. Roland, Rubber Chem. Technol., 1989, 62, 456–497 CrossRef CAS.
- W. Hofmann, Rubber technology handbook, Hanser Publishers, Distributed in the USA by Oxford University Press, 1989 Search PubMed.
- R. Rajasekar, K. Pal, G. Heinrich, A. Das and C. K. Das, Mater. Des., 2009, 30, 3839–3845 CrossRef CAS PubMed.
- P. Kueseng, P. Sae-oui, C. Sirisinha, K. I. Jacob and N. Rattanasom, Polym. Test., 2013, 32, 1229–1236 CrossRef CAS PubMed.
- A. Das, K. W. Stöckelhuber and G. Heinrich, Macromol. Chem. Phys., 2009, 210, 189–199 CAS.
Footnote |
† Electronic supplementary information (ESI) available. See DOI: 10.1039/c4ra09415h |
|
This journal is © The Royal Society of Chemistry 2014 |
Click here to see how this site uses Cookies. View our privacy policy here.