A FITC-doped silica coated gold nanocomposite for both in vivo X-ray CT and fluorescence dual modal imaging

Jie Feng a, Di Changb, Zhifei Wang*a, Bin Shena, Jinjin Yanga, Yanyun Jianga, Shenghong Ju*b and Nongyue He*c
aSchool of Chemistry and Chemical Engineering, Southeast University, Nanjing 211189, China. E-mail: zfwang@seu.edu.cn; Fax: +86-25-83790885; Tel: +86-25-83790885
bJiangsu Key Laboratory of Molecular and Functional Imaging, Department of Radiology, Zhongda Hospital, Medical School of Southeast University, Nanjing 210009, China. E-mail: jsh0836@hotmail.com
cSchool of Biological Science and Medical Engineering, Southeast University, Nanjing, 210096, China. E-mail: nyhe1958@163.com

Received 28th August 2014 , Accepted 8th October 2014

First published on 9th October 2014


Abstract

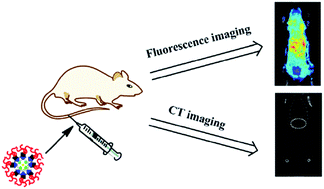
Dual-modal imaging contrast agents with unique X-ray computed tomography (CT) and optical imaging capabilities have attracted much attention in recent years. Herein, the new silica hybrid nanocomposites containing Au nanoparticles and FITC dyes (FITC–Au@SiO2) were investigated as this kind of contrast agent. TEM characterization showed that the as-synthesized FITC–Au@SiO2 nanoprobes were uniform in morphology with the average size of 90 nm. After the PEGylation, the obtained FITC–Au@SiO2@PEG exhibited good dispersion stability under different conditions. The MTT assay suggested that FITC–Au@SiO2@PEG didn't show appreciable toxicity toward KB cells even at high concentration of up to 1000 μg mL−1. In addition, it was found that FITC–Au@SiO2@PEG could cross the cell membrane and enter into the cytoplasm during the incubation with cells. In vivo dual modal optical/CT imaging of C57BL/6J mice uncovered that within 2 h post-injection FITC–Au@SiO2@PEG nanoprobes preferred to accumulate in the liver and were gradually cleared through the enterohepatic circulation system, which could bring novel opportunities to the next generation of dual-modality contrast agents.

1. Introduction

The medical imaging techniques, such as computed tomography (CT), magnetic resonance imaging (MRI), positron emission tomography (PET), and fluorescence imaging, have become increasingly important tools for understanding basic biological phenomena and diagnosing various diseases in modern medicine. However, none of these methods are fully capable of providing complete structural and functional information independently due to their inherent weaknesses.1–3 For example, CT can provide anatomical information, including the location, shape and size. However, inherent low sensitivity of CT imaging often results in poor soft tissue contrast. In addition, repeated CT scans undoubtedly deliver a relatively high dose of radiation to the patient.4,5 Although optical imaging techniques are highly sensitive and fast, they can only be reliably applied to small organisms such as mouse, due to its limited penetration depth of light.6,7 Hence, recently there has been emerging interest in developing various multimodal imaging techniques to compensate for the deficiencies of each single imaging modality.8,9 Among these techniques, the simultaneous combination of both CT imaging, for its excellent spatial resolution to display the minimum volume of lesions or structures, and fluorescence imaging, for its high sensitivity to provide real-time clear imaging of soft tissues and the exact location of target lesions, has been attracting much attention.

Meanwhile, rapid development of nanotechnology over the past decades has provided us more opportunity in designing NPs-based multimodal contrast agents for in vivo imaging techniques.10,11 For example, compared with the conventional iodine-based agents for X-ray CT imaging, gold-based NPs have been reported to possess higher atomic number, electron density, and higher X-ray absorption coefficient than iodine (gold 5.16 cm2 g−1, iodine 1.94 cm2 g−1 at 100 keV), which endows them with a greater ability to enhance CT contrast.12,13 For fluorescent probes that have been used in optical imaging, the fluorescence silica NPs have also gained much attention due to their own unique features, such as high chemical and thermal stability, excellent biocompatibility and photo stability under physiological conditions, and versatile surface chemistry for further functionalization.6,14–16 Therefore, it can be expected that incorporation of gold NPs and fluorescent molecule into the silica shell can create a kind of dual-modal contrast agent, providing the combined advantages of both CT and fluorescence imaging.

In an attempt to develop such hybrid structure, herein fluorescein isothiocyanate (FITC) is chosen as the doped-dye due to the fact that it possesses favorable spectral properties in the visible region: it strongly absorbs light at 492 nm (molar extinction coefficient around 80[thin space (1/6-em)]000 M−1 cm−1) and emits at 512 nm in water with an absolute quantum yield of 0.92. More importantly, the presence of gold inclusions within such hybrid structure has been reported to own the capability of suppressing concentration quenching of fluorophores and thus improve the quantum field of FITC.17 The use of polyethylene glycol (PEG) as the coating agent for NPs has been well studied.18,19 In addition to provide both high solubility and excellent dispersion stability in physiological conditions, PEG is often used to provide a steric barrier to protein adsorption, which results in reduced uptake by macrophages of the reticuloendothelial system (RES) and ultimately increases serum half-life. For this purpose, the obtained FITC–Au@SiO2 was further modified with α-mPEG-ω-amine. And a series of comprehensive evaluations were performed to characterize its size, morphology, and cytotoxicity. Finally, we explored its potentials as a dual-modal contrast agent for both in vitro and in vivo CT/fluorescence imaging.

2. Experimental section

2.1 Materials

Cyclohexane, n-hexanol, tetraethoxysilane (TEOS), ammonia water (NH4OH, ∼28%), ethanol (C2H5OH), sodium borohydride (NaBH4) were purchased from Sinopharm Chemical Reagent Limited Corporation and used as received. Gold(III) chloride (HAuCl4·3H2O, 48%), sodium 2-mercaptoethanesulfonate (C2H5NaO3S2), poly(acrylic acid) (PAA, MW = 1800), (3-aminopropyl)triethoxysilane (APTES), 1-ethyl-3-(3-dimethylaminopropyl)carbodiimide (EDC) and N-hydroxysuccinimide (NHS) were purchased from Aladdin and used as received. α-mPEG-ω-amine (MW = 10[thin space (1/6-em)]000) was purchased from Shanghai Yanyi Biotechnology Corporation. Triton X-100 was purchased from Beijing Solarbio Science and Technology Co., Ltd. Fluorescein-isothiocyanate isomer I 90% (FITC) and 3-(4,5-dimethylthiazol-2-yl)-2,5-diphenyl-tetrazolium bromide (MTT) were purchased from Alfa Aesar. Hoechst 33342 was purchased from Beyotime Institute of Biotechnology. All glasswares and Teflon-coated magnetic stirring bars were thoroughly cleaned with aqua regia, followed by copious rinsing with purified water. Milli-Q water (18.2 MΩ cm−1) was used in all experiments.

2.2 Synthesis of FITC–Au@SiO2

The FITC–Au@SiO2 was synthesized by a conventional water-in-oil micro-emulsion method according to a previous report with only slight modification.17

2.3 Surface modification of FITC–Au@SiO2 with mPEG–NH2

Basically, 3.4 mg of FITC–Au@SiO2 was firstly dispersed in 10 mL of ethanol, and then 500 μL of APTES was rapidly added to the above solution under stirring. After 24 h of reaction under room temperature, the APTES-functionalized FITC–Au@SiO2 was obtained by centrifugation at 15[thin space (1/6-em)]000 rpm for 10 min to remove supernatant, washed with ethanol for four times, and dried under vacuum. The resulting APTES-functionalized FITC–Au@SiO2 was denoted as FITC–Au@SiO2@NH2. After that, PAA was further covalently attached to the surface of FITC–Au@SiO2@NH2 using EDC coupling chemistry with the aim to obtain the carboxylate-functionalized FITC–Au@SiO2 (denoted as FITC–Au@SiO2@COOH later). Briefly, 0.25 g of PAA dissolved in 20 mL of MES buffer (pH = 6.0) was firstly activated with the help of 2 mg of EDC, and then 3.4 mg of the obtained FITC–Au@SiO2@NH2 was rapidly added into the above solution. The reaction lasted for another 2 h. For further PEGylation, 100 μL of EDC (10 mg mL−1) and 100 μL of NHS (10 mg mL−1) were separately added to 2 mL of aqueous solution containing 3.4 mg of the obtained FITC–Au@SiO2@COOH. After activation for 30 min, 1 mL of mPEG–NH2 solution (200 mg mL−1) was rapidly added to the above mixture and kept stirring overnight at the room temperature. Finally, the PEGylated FITC–Au@SiO2 (denoted as FITC–Au@SiO2@PEG later) was collected and washed with distilled water by centrifugation at 15[thin space (1/6-em)]000 rpm. And the resulting particles were dispersed in distilled water.

2.4 Cytotoxicity of FITC–Au@SiO2@PEG

In vitro cytotoxicity of FITC–Au@SiO2@PEG to KB cells (from Chinese Academy of Sciences Cells Bank) were measured by a MTT colorimetric assay. Briefly, KB cells were firstly seeded in 96-well cell culture plate at 5 × 10⁴ cells per well in 100 μL volume and further incubated for 24 h at 37 °C under 5% CO2. Then the cell media were replaced by 100 μL of fresh medium containing varying concentrations (31.3, 65, 125, 250, 500, 1000 μg mL−1) of FITC–Au@SiO2@PEG. Positive controls were replaced by fresh 10% FBS-containing media. Six wells were set up as positive controls for each sample concentration. After 24 h incubation, the medium was aspirated, and the cells were then washed twice with PBS to eliminate the remaining particles. Next, 100 μL of fresh culture medium was added to each well, followed by the addition of 20 μL of MTT solution (5 mg mL−1 in PBS). The cells were then incubated for another 4 h at 37 °C, and the medium was carefully aspirated. Finally the cells were solubilized in 100 μL of dimethyl sulfoxide (DMSO) and the absorbance was monitored using a microplate reader at a wavelength of 570 nm. The cytotoxicity was expressed as the percentage of cell viability compared to the untreated control cells.

2.5 Fluorescence imaging of KB cells by confocal microscope

The cellular uptake behavior of FITC–Au@SiO2@PEG was examined by confocal laser scanning microscopy (CLSM). Basically, KB cells were firstly seeded in 6-well tissue culture plates and allowed to adhere over-night. Then the cell media were changed and supplemented with serum-free media containing 50 μg mL−1 of FITC–Au@SiO2@PEG. After 24 h incubation, the cell media were removed and washed twice with serum-free medium. Then the cells were stained with Hoechst 33342. Samples are excited at 488 and 405 nm and are detected at 520 and 460 nm, for FITC–Au@SiO2@PEG and Hoechst 33342 stain respectively, using 60× objective.

2.6 X-ray attenuation measurement and in vivo CT imaging of C57BL/6J mice

FITC–Au@SiO2@PEG in the range of 0.047–1.5 mg mL−1 was first suspended in 500 μL of 0.01 M PBS and swirled for 2 min before CT imaging. The same volume of distilled water was set as negative control. The prepared solutions were placed in 0.5 mL tubes. The tubes were then scanned using a micro-CT imaging system (Skyscan 1176) with the following parameters: tube voltage 50 kV; current intensity, 455 mA; exposure time, 60ms. Evaluation of the X-ray attenuation intensity was carried out by loading the digital CT images in a standard display program and then selecting a uniform round region of interest on the resulting CT image of each sample. Contrast enhancement was finally determined in Hounsfield Units (HU) for each concentration of FITC–Au@SiO2@PEG.

All animal experiments were approved and performed in accordance with the Animal Management Rules of the Ministry of Health of the People' s Republic of China and the guidelines for the care and use of the Southeast University Laboratory Animal Center. C57BL/6J mice weighting for 18–20 g were kindly provided by medical school of Southeast university. Briefly, the C57BL/6J mice were firstly anesthetized with 60–80 μL of 10% chloral hydrate. The attenuation value (HU) of pre-injection scanning was considered as a reference. After pre-scans, the C57BL/6J mice were intravenously injected with 200 μL of FITC–Au@SiO2@PEG dispersion (150 mg kg−1) and scanned at several time points post injection (5 min, 30 min, 1 h, and 2 h). The parameters of CT scanning and measurements were similar to those used for X-ray attenuation coefficient measurement of FITC–Au@SiO2@PEG. Finally all CT images were reconstructed on a micro-CT imaging workstation (Skyscan 1176) using the following parameters: source voltage, 50 kV, source current, 455 μA, CT values were acquired on the same work station using the software supplied by the manufacturer.

2.7 In vivo and ex vivo fluorescence imaging

The in vivo fluorescence imaging of C57BL/6J mice was conducted to verify the effectiveness of using FITC–Au@SiO2@PEG as a kind of in vivo fluorescence imaging contrast agent. Briefly, the C57BL/6J mice were firstly anesthetized with 60–80 μL of 10% chloral hydrate. Then, 200 μL of 3 mg mL−1 FITC–Au@SiO2@PEG dissolved in 0.01 M PBS solution was injected into C57BL/6J mice via the tail vein. For the sake of comparison, the C57BL/6J mice without injection of FITC–Au@SiO2@PEG were selected as control. The in vivo imaging was then performed immediately after injection. Whole body images of FITC–Au@SiO2@PEG intravenously injected C57BL/6J mice were acquired and analyzed at many time points post-injection (5 min, 30 min, 1 h, 2 h, and 24 h). For ex vivo imaging, the major organs (heart, lung, liver, spleen, kidney, bowel and bladder) were dissected after 24 h post-injection, and the tissues were subjected to fluorescence imaging using Maestro in vivo imaging system immediately. The ROI (regions of interest) analysis was measured under the assistance of Maestro Image software.

2.8 Characterization

The morphology and size of FITC–Au@SiO2 were acquired by Transmission Electron Microscopy (TEM). Before the measurement, the sample was prepared by drying a drop of dispersion of FITC–Au@SiO2 suspension on a carbon-coated copper grid at room temperature and was analyzed using a JEOL JEM 2100 F electron microscope equipped with operating voltage of 200 kV. UV-vis absorbance spectrum of FITC–Au@SiO2 was recorded on a Shimadzu spectrophotometer between 400 and 700 nm wavelength. And the sample was measured in a 1 cm quartz cuvette using the corresponding pure solvent as a reference. FT-IR Spectrum was acquired using a Nicolet 5700 Fourier transform infrared spectrometer using KBr pellets. The fluorescence intensity of FITC–Au@SiO2 was measured (Ex/Em = 490/510 nm) with a Hitachi FL-4600 spectrophotometer. ξ potential of FITC–Au@SiO2 before and after surface modification by mPEG–NH2 was directly determined using a Zetasizer NanoS from Malvern Instruments.

3. Results and discussion

3.1 Preparation of FITC–Au@SiO2

FITC–Au@SiO2 was synthesized by a water–oil (W–O) micro-emulsion method according to a previous report with only slight modification.17 Fig. 1 showed the representative TEM image of the obtained FITC–Au@SiO2 and the corresponding size distribution, and it could be observed that FITC–Au@SiO2 presented the typical core–shell structure made of a spherical gold core with the average diameter of 5 nm and a uniform silica shell with the average thickness of 85 nm. Fig. 2a showed the corresponding UV-vis absorbance spectrum of FITC–Au@SiO2, and there was an obvious peak around 490 nm, which was correlated with the classic absorbance of FITC, indicating that FITC molecule was successfully encapsulated into the silica shell. Meanwhile, it's interesting to note that the typical peak arising from Surface Plasmon Resonance (SPR) of gold core was not observed in the whole range of spectrum, which might be attributed to the strong scattering of the SiO2 shell.20 Previous study showed that the typical SPR of Au NPs in the silica shell could be overshadowed by the scattering of silica shell when the thickness of silica shell is larger than 60 nm. In our case, the thickness of silica shell is 85 nm, therefore it can be expected that the typical SPR of gold core has been overshadowed by the increasing absorbance of silica shell at a shorter wavelengths. The successful encapsulation of FITC molecules into the silica shell could also be confirmed by the corresponding fluorescence emission spectrum of FITC–Au@SiO2. As shown in Fig. 2b, FITC–Au@SiO2 emitted strong fluorescence signal around 520 nm under the excitation of 490 nm, which was a typical fluorescent property for the FITC molecule.21 Taking all these above results together, it can be concluded that the SiO2 hybrid nanocomposites containing both FITC used for fluorescence imaging and gold NPs utilized for CT imaging have been obtained.
image file: c4ra09392e-f1.tif
Fig. 1 TEM image of the prepared FITC–Au@SiO2 (a) and the corresponding size distribution (b).

image file: c4ra09392e-f2.tif
Fig. 2 UV-vis absorbance spectrum of FITC–Au@SiO2 (a) and fluorescence emission spectrum of FITC–Au@SiO2 (excitation wavelength λex = 490 nm) (b).

Considering the fact that free FITC molecule is one of the pH sensitive dyes, we further investigated the fluorescence property of as-synthesized FITC–Au@SiO2 under different conditions of pH value and temperature. As shown in Fig. 3a, the fluorescence intensity of FITC–Au@SiO2 is greatly affected by pH value, which is similar to that of free FITC molecule. The maximum intensity occurs at about pH 9. In the aqueous solution, free FITC molecule can exist in cationic, neutral, anionic, and dianionic forms, making its fluorescence properties strongly pH dependent. So it can be concluded that the silica shell doesn't affect the fluorescence property of the doped FITC. Considering the fact that the physiological pH is nearly constant and just ranges from 7.3 to 7.4, the fluorescence intensity of FITC–Au@SiO2 should be stable in the body. In addition, it can also be found that the influence of temperature ranging from 4 to 55 °C on the fluorescence intensity of FITC–Au@SiO2 is very little (as shown in Fig. 3b).


image file: c4ra09392e-f3.tif
Fig. 3 Fluorescence spectra of FITC–Au@SiO2 under different conditions of pH value (a) and temperature (b).

3.2 Surface modification of FITC–Au@SiO2 with mPEG–NH2

To improve the dispersion stability of FITC–Au@SiO2 under physiological condition, we further modified its surface with mPEG–NH2 before evaluating its potential as bimodal contrast agent. The procedure of the surface modification is shown schematically in Scheme 1. In order to achieve high mPEG–NH2 graft density, plenty of anchor sites for coupling mPEG–NH2 are required. In our study, short-chain PAA, which possesses abundant free carboxylic groups to be used for the covalent linkage of mPEG–NH2, was firstly modified as the linkage between the surface of FITC–Au@SiO2@NH2 and mPEG–NH2. After the activation of the carboxylic groups from FITC–Au@SiO2@COOH with the help of EDC and NHS, mPEG–NH2 was covalently linked to FITC–Au@SiO2@COOH via amidation reaction.
image file: c4ra09392e-s1.tif
Scheme 1 Schematic illustration of the surface modification of FITC–Au@SiO2 nanoparticles.

The above surface modification process can be directly confirmed by the corresponding FT-IR spectra. The curve a in Fig. 4A showed the corresponding FT-IR adsorption spectrum of FITC–Au@SiO2, and the broad band around 3440 cm−1 could be attributed to O–H stretching vibration originating from both silanol and absorbed water, whereas the band center at 1080 and 800 cm−1 corresponded to Si–O–Si asymmetric bond stretching vibration and Si–O–Si symmetric bond stretching vibration, respectively. After reacting with APTES, two new bands at 1555 and 2930 cm−1 attributed to N–H asymmetric bending vibration and C–H asymmetric vibration appeared, indicating the successful functionalization of FITC–Au@SiO2 with APTES. Upon further grafting with PAA, new adsorption peaks appeared at 1730, 1650, 1560 cm−1, which could be assigned to C[double bond, length as m-dash]O stretching vibration in the carboxyl group, C[double bond, length as m-dash]O stretching vibration in the amide group and the asymmetric vibration from the residual deprotonated carboxylic acid (COO), respectively, indicating the successful covalent grafting of PAA. As evidence for the grafting with mPEG–NH2, two new peaks at 2930 and 1375 cm−1 appeared, which were assigned to both the C–H asymmetric vibration from CH2– and symmetric vibration from CH3 in mPEG–NH2 block. These results collectively indicated that the surface of FITC–Au@SiO2 was successfully coated with a layer of mPEG–NH2.


image file: c4ra09392e-f4.tif
Fig. 4 (A) FT-IR spectra of FITC–Au@SiO2 (a), FITC–Au@SiO2@NH2 (b), FITC–Au@SiO2@COOH (c), and FITC–Au@SiO2@PEG (d); (B) zeta potential of FITC–Au@SiO2 with the different surface modifications.

The successful covalent linkage of mPEG–NH2 to FITC–Au@SiO2 could also be characterized by zeta potential changes. Fig. 4B showed the zeta potential of FITC–Au@SiO2 before and after surface modification with mPEG–NH2. It was observed that the zeta potential of bare FITC–Au@SiO2 was −19.1 mV, indicating the existence of a lot of silanol groups. Meanwhile, FITC–Au@SiO2@NH2 showed a positive zeta potential of +22.8 mV. After grafting with PAA, the zeta potential of FITC–Au@SiO2@COOH decreased to −28.8 mV, indicating the existence of a great amount of carboxyl groups on the surface of FITC–Au@SiO2@COOH. As a piece of evidence for the successful covalent conjugation of mPEG–NH2, the zeta potential of FITC–Au@SiO2@PEG increased from −28.8 to −7.3 mV, suggesting that most of the carboxyl groups from the surface of FITC–Au@SiO2@COOH were reacted with mPEG–NH2.

In order to prove our assumption that the post PEGylation of FITC–Au@SiO2 could significantly improve its dispersion stability, we further examined the colloidal stability of FITC–Au@SiO2@PEG under the extreme conditions (pH ranges from 4.0 to 9.0, and temperature change from 4 to 50 °C). As we know, the aggregation of Au NPs could be associated with the changes of their absorption features in the UV-vis spectra.22 Therefore, the stability of the FITC–Au@SiO2@PEG under different conditions could be directly monitored by UV-vis spectrometry. Fig. 5a showed the UV-vis spectra of FITC–Au@SiO2@PEG dispersed in aqueous solution (pH = 6.0) under different temperatures, and it could be seen that UV-vis spectra of these FITC–Au@SiO2@PEG solution under different temperatures were identical to each other, indicating that FITC–Au@SiO2@PEG didn't aggregate in a temperature range of 4–50 °C. Fig. 5b further showed the UV-vis spectra of FITC–Au@SiO2@PEG solutions with different pH values, and it was observed that in the pH range of 4.0–9.0, the absorption features of FITC–Au@SiO2@PEG did not display any appreciable changes, suggesting that FITC–Au@SiO2@PEG was stable in the studied pH range. Furthermore, the colloidal stability of the FITC–Au@SiO2@PEG remained similar when they were dispersed into PBS or cell culture medium for at least 3 months (Fig. 6). Thus, the above results collectively indicated that PEGylation of FITC–Au@SiO2 could significantly improve its dispersion stability under different conditions, which have laid a solid foundation for the following applications in in vivo dual modal imaging.


image file: c4ra09392e-f5.tif
Fig. 5 UV-vis spectra of FITC–Au@SiO2@PEG under different conditions of temperature (a) and pH value (b).

image file: c4ra09392e-f6.tif
Fig. 6 Photos of FITC–Au@SiO2@PEG dispersed in water (a), PBS buffer (b), and cell culture medium (c) with Au concentration of 0.5 mg mL−1. (d) Photo of cell culture medium as a contrast.

3.3 Cytotoxicity and biocompatibility of FITC–Au@SiO2@PEG

Studies on the interaction between FITC–Au@SiO2@PEG nanoprobes and cells are helpful to better evaluate their potential applications in dual modal imaging. Therefore, we firstly used MTT method to investigate the cytotoxicity of FITC–Au@SiO2@PEG to KB cells. Fig. 7 showed the cell viability of KB cells after 24 h incubation with different concentrations of FITC–Au@SiO2@PEG. Results showed that no significant influence on cell viability was detected when FITC–Au@SiO2@PEG concentration was below 250 μg mL−1 (cell viability ≥ 90%). When the concentration of FITC–Au@SiO2@PEG was above 500 μg mL−1, the cell viability reduced but was still above 70%, demonstrating negligible cytotoxicity of FITC–Au@SiO2@PEG. As expected, FITC–Au@SiO2@PEG didn't show appreciable toxicity to KB cells even at high concentration of up to 1000 μg mL−1, suggesting that FITC–Au@SiO2@PEG could be used safely in the in vivo use.
image file: c4ra09392e-f7.tif
Fig. 7 MTT assay of KB cell viability after incubation with FITC–Au@SiO2@PEG at the Au concentration of 0–1000 μg mL−1 for 24 h.

The cellular uptake behavior of FITC–Au@SiO2@PEG was further examined by CLSM following the incubation of KB cells with FITC–Au@SiO2@PEG in cell culture media for 24 h. CLSM images of KB cells were obtained after staining (blue) nuclei with Hoechst 33342. As shown in Fig. 8, the KB cells remained attached on the plate well and maintained their normal morphology after being incubated with FITC–Au@SiO2@PEG for 24 h, which further suggested that the obtained FITC–Au@SiO2@PEG nanoprobes had no obvious cytotoxic effect on KB cells. In addition, the green fluorescence of FITC–Au@SiO2@PEG could be observed in the cytoplasm of KB cells. The significant internalization of FITC–Au@SiO2@PEG was demonstrated by the presence of spot-like green fluorescence inside the cytoplasm via endocytosis rather than being absorbed on the exterior of cells. These above results demonstrated that FITC–Au@SiO2@PEG was a promising candidate for cellular imaging.


image file: c4ra09392e-f8.tif
Fig. 8 Laser scanning confocal microscopy images (LSCM) of KB cells incubated with FITC–Au@SiO2@PEG. Images from a–d showed the bright field images of KB cells incubated with FITC–Au@SiO2@PEG (a), nuclei stained by Hoechst 33342 (blue) (b), FITC–Au@SiO2@PEG fluorescence (green) (c) and the overlay of two images (d). The scale bars are 25 μm in all images.

3.4 X-ray attenuation measurement and in vivo CT imaging of C57BL/6J mice

CT is one of the most reliable and widely used diagnostic tools in hospital due to different X-ray absorption of tissue and lesion. To confirm that FITC–Au@SiO2@PEG can functionalize as CT contrast agent, we first tested the in vitro CT images of FITC–Au@SiO2@PEG in the range of 0.047–1.5 mg mL−1. As shown in Fig. 9a, as the concentration of FITC–Au@SiO2@PEG increased, the CT signal intensity continuously increased, resulting in brighter images. In order to further investigate its CT contrast effects, the attenuation values (HU) of different concentrations of FITC–Au@SiO2@PEG were measured by the Micro-CT equipment. As shown in Fig. 9b, HU as a function of the concentration of FITC–Au@SiO2@PEG exhibited a well-correlated linear relationship (R2 = 0.9888), and could be described by the following typical equation: y = 17.44x + 6.96. These results collectively suggested that FITC–Au@SiO2@PEG had a potential application as CT imaging contrast agent.
image file: c4ra09392e-f9.tif
Fig. 9 (a) In vitro CT images of FITC–Au@SiO2@PEG suspended in PBS. The concentration (mg mL−1) of each sample was provided on the top of the respective images. (b) CT attenuation (HU) plot of FITC–Au@SiO2@PEG at various concentrations in the range from 0.047 to 1.5 mg mL−1.

In order to further assess the feasibility of FITC–Au@SiO2@PEG nanoprobe as the contrast agent for in vivo CT imaging, a relative higher concentration of FITC–Au@SiO2@PEG was injected into C57BL/6J mice via tail vein. Fig. 10a showed the representative coronal micro-CT images of C57BL/6J mice before and after injection with 200 μL of FITC–Au@SiO2@PEG dispersion (150 mg kg−1). The most dramatic enhancement was observed in the liver. The liver site showed an obvious enhancement with higher CT value after the administration of FITC–Au@SiO2@PEG compared with that before injection. In order to further prove that FITC–Au@SiO2@PEG is selectively taken up by the liver, transverse images of liver was reconstructed and the CT value was calculated. As shown in Fig. 10b, the liver became much brighter with the HU value increasing from 82 to 95 after 5 min post injection. It is interesting that the HU value further increased to 103 within 0.5 h, indicating that FITC–Au@SiO2@PEG delivered sustainably to the liver after injection due to their longer circulation time in blood, which was well consistent with the results that the NPs could be gradually enriched in the RES-rich organs such as liver.23 When the post-injection time reached to 2 h, the average HU value at the liver still remained at 102, making them much suitable for long-time in vivo imaging. Our preliminary in vivo experiments demonstrated that the FITC–Au@SiO2@PEG could significantly increase the contrast enhancement in the region of liver in CT imaging.


image file: c4ra09392e-f10.tif
Fig. 10 (a) Representative coronal CT images of the C57BL/6J mice before and after intravenous injection with FITC–Au@SiO2@PEG at different time points (5 min, 30 min, 1 h, 2 h). White circle indicates the liver site. (b) Constructed transverse CT images of the liver corresponding to the coronal images in the same column.

3.5 In vivo fluorescence imaging of C57BL/6J mice

To investigate the feasibility of FITC–Au@SiO2@PEG as the contrast agent for in vivo fluorescence imaging, fluorescent signal of FITC–Au@SiO2@PEG dispersed in PBS was first tested in vitro under the excitation at 465–490 nm and recorded at 500–550 nm with Maestro Image System. As shown in Fig. 11a, a strong fluorescence was observed. Then, 200 μL of FITC–Au@SiO2@PEG (3 mg mL−1) was injected to the C57BL/6J mice through the tail vein for the real-time whole body in vivo imaging. Fig. 11b–f showed the corresponding fluorescence signal and intensity distribution as a function of time. And it could be observed that there was almost no background fluorescence in the control mice from 5 min to 24 h. In contrast, following the immediate intravenous injection of FITC–Au@SiO2@PEG, clear and bright fluorescence emitted from FITC–Au@SiO2@PEG could be easily visualized in the whole animal. And the strongest fluorescent signal was located in the region of liver from 5 min post-injection, indicating that FITC–Au@SiO2@PEG preferred to accumulate in the liver. Within 2 h post-injection, as blood circulated, the fluorescent area of the liver enlarged over time and the corresponding fluorescence became stronger and brighter, which was well consistent with the results obtained in CT imaging. At 24 h post-injection, the fluorescence in mice body decreased to nearly background levels except for the liver and bowel. Meanwhile, the fluorescence signal of FITC–Au@SiO2@PEG in the liver and bowel was significantly reduced, indicating that FITC–Au@SiO2@PEG could be gradually cleared from the body through the enterohepatic circulation system. Ex vivo optical imaging analysis of different organs was performed by harvesting organs at 24 h post-injection (Fig. 12). And it could be observed that clear and bright fluorescence from the liver and bowel could be observed, which was consistent with the results observed by in vivo fluorescence imaging.
image file: c4ra09392e-f11.tif
Fig. 11 In vitro fluorescence imaging of FITC–Au@SiO2@PEG dispersed in 0.01 M PBS (a), in vivo fluorescence imaging of a C57BL/6J mouse injected with FITC–Au@SiO2@PEG through the tail vein (right): (b) 5 min post-injection, (c) 30 min post-injection, (d) 1 h post-injection, (e) 2 h post-injection, (f) 24 h post-injection. And a mouse without the injection of FITC–Au@SiO2@PEG was used as control (left).

image file: c4ra09392e-f12.tif
Fig. 12 Ex vivo fluorescence imaging of dissected organs from the C57BL/6J mice without injection of FITC–Au@SiO2@PEG (control, the first row), and at 24 h post-injection (probe, the second row).

4. Conclusions

In summary, as an attempt to pursuit dual-modal imaging contrast agents used for both CT and optical imaging, herein we studied the surface modification of FITC–Au@SiO2 nanoprobes, their interaction between FITC–Au@SiO2 nanoprobes and KB cells, and their applications in in vivo CT/fluorescence imaging. TEM characterization showed that the synthesized FITC–Au@SiO2 nanoprobes were uniform in morphology with the average size of 90 nm. After the PEGylation (MW = 10[thin space (1/6-em)]000), the obtained FITC–Au@SiO2@PEG exhibited a good dispersion stability under different conditions (4–50 °C, pH 4.0–9.0, and various solvents such as PBS and cell culture medium). The MTT assay suggested that FITC–Au@SiO2@PEG didn't show appreciable toxicity to KB cells even at high concentration of up to 1000 μg mL−1. In addition, it was found that FITC–Au@SiO2@PEG could cross the cell membrane and enter into the cytoplasm during the incubation with cells. In vivo dual modal optical/CT imaging of C57BL/6J mice uncovered that within 2 h post-injection FITC–Au@SiO2@PEG nanoprobes preferred to accumulate in the liver and were gradually cleared through the enterohepatic circulation system. For CT imaging, the average HU value at the liver increased from 82 to 102. For fluorescence imaging, the fluorescence from liver became stronger and brighter than that from other organs. These results collectively showed that the as-synthesized FITC–Au@SiO2@PEG was effective for simultaneous dual-modality imaging of fluorescence and CT, which could bring novel opportunity to the next generation of dual-modality contrast agents.

Acknowledgements

Jie Feng and Di Chang contributed equally to this work. This research was financially supported by the State key Basic Research Program of the PRC (2014CB744501), the NSF of China (61271056), and Jiangsu province natural science foundation (BK20141332).

References

  1. R. Weissleder and U. Mahmood, Radiology, 2001, 219, 316 CrossRef CAS PubMed.
  2. N. Sandu, G. Pöpperl, M. E. Toubert, T. Spiriev, B. Arasho, M. Orabi and B. Schaller, Mol. Med., 2011, 17, 308 CAS.
  3. R. Weissleder and M. J. Pittet, Nature, 2008, 452, 580 CrossRef CAS PubMed.
  4. H. Wang, L. Zheng, R. Guo, C. Peng, M. Shen, X. Shi and G. Zhang, Nanoscale Res. Lett., 2012, 7, 1 CrossRef PubMed.
  5. P. C. Freeny, W. M. Marks, J. A. Ryan and L. W. Traverso, Radiology, 1988, 166, 125 CrossRef CAS PubMed.
  6. K. Wang, X. He, X. Yang and H. Shi, Acc. Chem. Res., 2013, 46, 1367 CrossRef CAS PubMed.
  7. E. M. Hillman, J. Biomed. Opt., 2007, 12, 051402 CrossRef PubMed.
  8. J. Kim, Y. Piao and T. Hyeon, Chem. Soc. Rev., 2009, 38, 372 RSC.
  9. W. Y. Huang and J. J. Davis, Dalton Trans., 2011, 40, 6087 RSC.
  10. K. Y. van Berkel, A. M. Piekarski, P. H. Kierstead, E. D. Pressly, P. C. Ray and C. J. Hawker, Macromolecules, 2009, 42, 1425 CrossRef CAS.
  11. M. M. van Schooneveld, D. P. Cormode, R. Koole, J. T. van Wijngaarden, C. Calcagno, T. Skajaa, J. Hilhorst, D. C. Hart, Z. A. Fayad and W. J. Mulder, Contrast Media Mol. Imaging, 2010, 5, 231 CrossRef CAS PubMed.
  12. P. A. Jackson, W. N. W. A. Rahman, C. J. Wong, T. Ackerly and M. Geso, Eur. J. Radiol., 2010, 75, 104 CrossRef PubMed.
  13. P. Sharma, S. C. Brown, N. Bengtsson, Q. Zhang, G. A. Walter, S. R. Grobmyer, S. Santra, H. Jiang, E. W. Scott and B. M. Moudgil, Chem. Mater., 2008, 20, 6087 CrossRef CAS PubMed.
  14. D. Knopp, D. Tang and R. Niessner, Anal. Chim. Acta, 2009, 647, 14 CrossRef CAS PubMed.
  15. J. Yan, M. C. Estévez, J. E. Smith, K. Wang, X. He, L. Wang and W. Tan, Nano Today, 2007, 2, 44 CrossRef.
  16. L. M. Rossi, L. Shi, F. H. Quina and Z. Rosenzweig, Langmuir, 2005, 21, 4277 CrossRef CAS.
  17. M. Martini, P. Perriat, M. Montagna, R. Pansu, C. Julien, O. Tillement and S. Roux, J. Phys. Chem. C, 2009, 113, 17669 CAS.
  18. H. Otsuka, Y. Nagasaki and K. Kataoka, Adv. Drug Delivery Rev., 2003, 55, 403 CrossRef CAS.
  19. J. V. Jokerst, T. Lobovkina, R. N. Zare and S. S. Gambhir, Nanomedicine, 2011, 6, 715 CrossRef CAS PubMed.
  20. Y. F. Huang, K. H. Ma, K. B. Kang, M. Zhao, Z. L. Zhang, Y. X. Liu, T. Wen, Q. Wang, W. Y. Qiu and D. Qiu, Colloids Surf., A, 2013, 421, 101 CrossRef CAS PubMed.
  21. S. Santra, B. Liesenfeld, C. Bertolino, D. Dutta, Z. Cao, W. Tan, B. M. Moudgil and R. A. Mericle, J. Lumin., 2006, 117, 75 CrossRef CAS PubMed.
  22. R. Guo, H. Wang, C. Peng, M. Shen, M. Pan, X. Cao, G. Zhang and X. Shi, J. Phys. Chem. B, 2009, 114, 50 Search PubMed.
  23. H. K. Kim, H. Y. Jung, J. A. Park, M. I. Huh, J. C. Jung, Y. Chang and T. J. Kim, J. Mater. Chem., 2010, 20, 5411 RSC.

Footnote

Contributed equally to this paper.

This journal is © The Royal Society of Chemistry 2014
Click here to see how this site uses Cookies. View our privacy policy here.