Novel Pd-decorated amorphous Ni–B/C catalysts with enhanced oxygen reduction reaction activities in alkaline media
Haining Wangab,
Di Caoab,
Yan Xiangab,
Dawei Liangab and
Shanfu Lu*ab
aBeijing Key Laboratory of Bio-inspired Energy Materials and Devices, School of Chemistry and Environment, Beihang University, Beijing, 100191, China
bKey Laboratory of Bio-Inspired Smart Interfacial Science and Technology of Ministry of Education, School of Chemistry and Environment, Beihang University, Beijing, 100191, China. E-mail: lusf@buaa.edu.cn
First published on 7th October 2014
Abstract
Pd-decorated amorphous Ni–B/C (Pd@Ni–B/C) catalysts were successfully synthesized by modifying the surface of amorphous Ni–B/C particles with a trace amount of Pd (0.2 wt% to 1.5 wt%) through a simple chemical replacement method, which exhibited significantly improved oxygen reduction reaction (ORR) activities in alkaline media. X-ray diffraction (XRD), transmission electron microscopy (TEM) and X-ray photoelectron spectroscopy (XPS) characterization were carried out to prove the successful synthesis of amorphous Pd@Ni–B/C. The electrochemical performances of the prepared catalysts for ORR in alkaline media were evaluated by a linear sweep voltammetry (LSV) method using a potentiostat and a rotating disk electrode (RDE). Both the half-wave potential and the limiting current density of Pd-decorated Ni–B/C catalysts were improved compared with those of undecorated amorphous Ni–B/C catalysts. The electrocatalytic performance of 1.5 wt% Pd@Ni–B/C was comparable with that of 40 wt% Pd/C or Pt/C catalysts. Furthermore, the prepared catalyst showed high stability and methanol endurance ability. The low precious metal loading and comparable catalytic performance make Pd@Ni–B/C a very promising cathode catalyst in alkaline polymer electrolyte fuel cells (APEFCs).
1. Introduction
The oxygen reduction reaction (ORR) is the cathode reaction in nearly all kinds of metal–air batteries and fuel cells.1,2 The kinetics of the ORR are usually very sluggish, which critically affects the overall performance of these devices.3 Pt-based materials are generally used as ORR catalysts.4–6 However, the high price and low abundance of Pt limits the practical application of these energy storage and conversion devices, which makes developing ORR catalysts with low cost and high performance an urgent need.The less corrosive alkaline electrolyte in alkaline polymer electrolyte fuel cells (APEFCs) permits non-Pt materials, especially some transition metals,7–11 to be used as ORR catalysts.12 Transition metal oxides, transition metal hydroxides and transition metal sulfides have been studied intensively for oxygen reduction reactions.3,11,13,14 For instance, Zhaoqing Liu et al. synthesized urchin-like NiCo2O4 spheres as efficient ORR electrocatalysts.13 ORR catalysts of Ni(OH)2 and Co(OH)2 were studied by Zhixuan Liu et al. which showed high ORR activity with a four-electron process on the surface.14 The hybrid of NiCo2S4 nano-particles (NPs) grown on graphene was reported as an effective non-precious catalyst for ORR by Qia Liu et al.3 Recently, an alloy of Ni(OH)2-MnOx/C was prepared by reducing Ni salts with NaBH4 solution with the existence of MnOx/C and the amorphous Ni(OH)2 significantly improved the activity of the MnOx/C catalyst.11
Amorphous Ni–B is a transition metal alloy with high catalytic performance and has already been proved to be effective in many chemical and electrochemical catalytic reactions.15–17 Ni–B was first proposed as a cathode catalyst in fuel cells in 1960,18 but its performance was not very satisfied. It has been found that surface modification can improve the performance of catalysts. For example, Wang et al. decorated the surface of the carbon supported Co–Pd core–shell nano-particles with Pt atoms, where an enhanced stability and electrocatalytic activity for the ORR was achieved.19 Tong et al. modified the catalyst surface of NiO with Pd nano-crystals and an enhanced ORR performance was observed.20 Furthermore, Pd decorated amorphous catalysts, for example Co–B, B/SiO2, have shown improved catalytic performance.21–23 Recently, amorphous Ni–B alloy catalyst supported on carbon black (Ni–B/C) were successfully prepared by our group, which exhibited significantly improved catalytic current density towards hydrazine electro oxidation.24
In this work, novel Pd-decorated Ni–B/C catalysts (Pd@Ni–B/C) were synthesized by decorating the surface of amorphous Ni–B/C catalysts with trace Pd-loadings from 0.2 wt% to 1.5 wt%. The synthesized Pd@Ni–B/C catalyst showed significantly improved ORR catalytic activities than undecorated Ni–B/C catalysts in alkaline media, as well as good stability and methanol endurance ability. The 1.5 wt% Pd@Ni–B/C catalysts exhibited comparable electrocatalytic performance in comparison with Pd/C or Pt/C (40 wt%) catalysts. The low precious metal loading and comparable catalytic performance make it a very promising cathode catalyst in alkaline media for fuel cells.
2. Experimental
2.1 Catalyst preparation
Carbon black supported amorphous Ni–B catalysts were prepared through a chemical reduction method.24 In brief, 0.30 g carbon black Vulcan XC-72 from Cabot (Billerica, MA) and 0.81 g NiCl2·6H2O (Beijing Chemical Factory, China) were fully mixed in 50 mL ethanol glucose to achieve approximate Ni loading of 40 wt%. After ultrasonicated for 20 min, 50 mL NaBH4 solution (0.01 g mL−1) was added to the Ni salt-carbon black mixture via a constant flow pump. The adding rate was set at 5.0 mL min−1. Through the whole process, the solution was put in ice–water bath and was put under constant stirring using a magnetic stirrer (IKA, C-MAG HP4). After the adding of NaBH4 solution, the mixture was stirred for another 20 min until no bubble generated. The sediments were washed by deionized water for 3–5 times and stored in deionized water.Pd decoration was achieved by adding PdCl2 solution (10.0 g L−1) into 0.5 g fresh synthesized Ni–B/C catalysts (Ni 40 wt%). PdCl2 solutions of different volumes (67, 167, 334, 500 μL) were added into the fresh synthesized catalysts and the mixtures were put on the magnetic stirrer for constant stirring for another 15 min. The sediments were then washed by deionized water for 3–5 times. The acquired catalysts were stored in water until further use. And a set of catalysts with different Pd loadings of 0.2, 0.5, 1.0 and 1.5 wt% (Pd/Ni) were synthesized.
2.2 Physical characterization
The XRD characterization was conducted with an X-ray diffractometer (SHIMADZU, XRD-6000). The Cu Kα excitation source was operated at a potential of 40 kV and a current of 30 mA. 2θ diffraction angles in this research ranged from 30° to 70°.The microstructure of as prepared catalyst was further studied by transmission electron microscopy (TEM), selected area electron diffraction (SAED) with a transmission electron microscope (JEOL, JEM-2100F). The accelerating voltage was 200 kV.
To understand the elements and their existing states on the surface of Ni–B/C and Pd@Ni–B/C catalysts, the XPS spectra were taken with an X-ray photoelectron spectroscope (Thermo Scientific, ESCALAB 250Xi). The excitation source was the Kα radiation of an aluminum anode. The pass energy was set to 30 eV, the step size was 50 meV.
2.3 Electrochemical tests
Electrochemical performances of the synthesized catalysts were tested using a rotating disk electrode (RDE, Pine Instrument, AFMSRCE). A three-electrode system was used during the test. A self-made reversible hydrogen electrode (RHE) was used as reference electrode, a self-made Pt-plane-electrode was used as counter-electrode and the working electrode was a glass carbon electrode (GCE, diameter = 5 mm) modified with the catalysts inks. The catalyst ink was prepared as following: 10.0 mg catalysts was mixed with 1.0 mL nafion-isopropyl alcohol solution (1.0 wt%) by ultrasonication for 15 min until the catalyst was fully dispersed. 5 μL of catalyst ink was added to the GCE with a micropipette. Then the electrode was left to dry under an inferred lamp.All ORR tests were conducted in 1 M KOH solution at room temperature. Cyclic voltammetry (CV) and liner sweep voltammetry (LSV) methods were conducted at a scan rate of 10 mV.s−1 at various rotation speeds (900–3600 rpm) using RDE.
3. Results and discussion
3.1 Structure characterization of catalysts
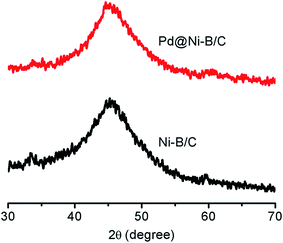
The Pd@Ni–B/C catalysts were obtained by adding PdCl2 solution into fresh synthesized Ni–B/C catalysts. The surface atoms of Ni could be replaced spontaneously by Pd atoms since the equilibrium electrode potential of the PdCl2/Pd couple (0.915 V vs. a reversible hydrogen electrode (RHE)) is more positive than that of the Ni2+/Ni couple (−0.257 V vs. RHE).25 The structures of Ni–B/C and 1.5 wt% Pd@Ni–B/C were studied by the XRD results as shown in Fig. 1. For the Ni–B/C catalyst, a broad peak at 2θ = 45° was observed, which indicated that it was in amorphous state.26,27 The XRD pattern of Pd@Ni–B/C showed a very similar pattern with that of undecorated Ni–B/C catalyst, demonstrating that the amorphous structure of Ni–B/C catalyst was not affected by Pd-decoration. Also, since no typical Pd lattice diffraction was observed in the XRD pattern, it was also suggested that Pd atoms were well dispersed on the surface of amorphous Ni–B nano-particles instead of forming into Pd crystals.The microstructure and amorphous state of Ni–B/C and Pd@Ni–B/C were further characterized by TEM method. Fig. 2a shows the TEM image of the prepared Pd@Ni–B/C catalyst. It can be observed that the Pd@Ni–B NPs were well dispersed on the surface of carbon black. The particle size distribution of Pd@Ni–B/C catalyst was presented in the inset of Fig. 2a, which shows the particle size of Pd@Ni–B/C was about 7 nm. The high resolution TEM (HR-TEM) image of Pd@Ni–B/C catalyst was shown in Fig. 2b. No lattice fringe was observed from the HR-TEM image, indicating that the Pd@Ni–B/C was in amorphous state. The inset of Fig. 2b was the SAED image of Pd@Ni–B/C, where only concentric circles observed. Even the concentric circles could be caused by the amorphous carbon, the large ratio of Ni (40 wt%) indicated that the Pd@Ni–B/C catalyst was in amorphous structure,28 which could also be confirmed by the XRD spectra (Fig. 1).
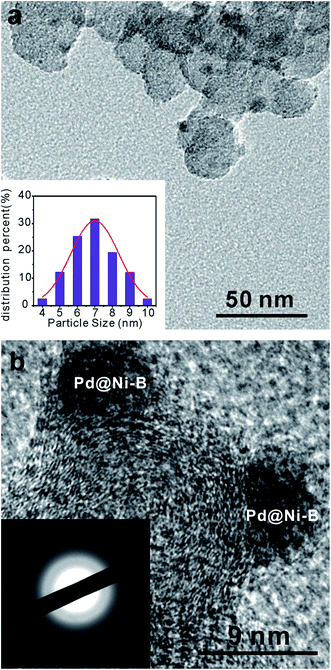 | ||
| Fig. 2 (a) The TEM image of 1.5 wt% Pd@Ni–B/C. Inset: the particle size distribution of Pd@Ni–B/C. (b) High resolution-TEM image of Pd@Ni–B/C. Inset: SAED pattern of Pd@Ni–B/C. | ||
The ICP-OES study was carried out to confirm the preparation of Pd@Ni–B/C catalysts. The results indicated that 100.0 mg of Pd@Ni–B/C contained approximately 32.6 mg of Ni, 4.2 mg of B and 0.4 mg of Pd, while 100.0 mg of Ni–B/C contained approximately 34.5 mg of Ni and 4.6 mg of B. The results indicated the successful decoration of Pd on Ni–B/C.
XPS study was used to characterize the electronic states and composition of Ni–B/C and 1.5 wt% Pd@Ni–B/C catalysts. The full XPS spectra of Ni–B/C and Pd@Ni–B/C were shown in Fig. 3a. The peaks at 186–194 eV in the XPS spectra of Ni–B/C and Pd@Ni–B/C were assigned to the B 1s orbital, which proved that B has been successfully alloyed into Ni. The XPS spectra of Pd@Ni–B/C also demonstrated signals in the range of 333–345 eV, which were assigned to the Pd 3d orbital (Fig. 3b). This suggested that Pd was decorated on the surface of Ni–B/C. The Pd loading of Pd@Ni–B/C catalysts were analyzed from the XPS results, as summarized in Table 1. The results indicated that the Pd loading on the surface was higher than the original design. It is because the Pd atoms were dispersed on the surface of Pd@Ni–B/C catalysts, and the surface atom ratio of Pd/Ni was higher than that in the bulk composition. Fig. 3c presented the Ni 2p3/2 binding energy region in Ni–B/C and Pd@Ni–B/C catalysts. The peaks at 852.3, 855.6, and 861.0 eV were assigned to metallic Ni, oxidized Ni, and shake-up peaks of oxidized Ni respectively. From Fig. 3c it can be observed that the peak area ratio of Ni(0)/Ni(II) in Pd@Ni–B/C was larger than that of Ni–B/C, which indicates a larger atom ratio of Ni(0)/Ni(II). It means that Pd@Ni–B/C suffered from less oxidation than Ni–B/C catalyst and suggests that Pd-decoration could improve the stability of Ni–B/C. Fig. 3d displays the XPS spectra of B 1s binding energy for Pd@Ni–B/C and Ni–B/C. The peaks of B 1s moved slightly to the low binding energy in Pd@Ni–B/C than those in Ni–B/C, which also proved that Pd was successfully decorated onto the surface of Ni–B/C. The ratio of elemental B to oxidized B in Pd@Ni–B/C was much higher than that in Ni–B/C, which also indicated that Pd decoration can stabilize Ni–B catalyst, which was in consistent with results discussed above.
| Sample number | Designed Pd-loading Pd/Ni (wt%) | Measured Pd-loading Pd/Ni (wt%) |
|---|---|---|
| 1 | 0 | 0 |
| 2 | 0.2 | 1.1 |
| 3 | 0.5 | 3.2 |
| 4 | 1.0 | 6.0 |
| 5 | 1.5 | 7.3 |
3.2 Electrochemical tests
The CV curves of Ni–B/C and Pd@Ni–B/C in N2 saturated 1 M KOH solution were compared as presented in Fig. 4. The oxidation and reduction peaks in Fig. 4 were generated from the redox reaction of Ni(II)/Ni(0). As evident in Fig. 4, the oxidation peak of Pd@Ni–B/C moved slightly to the high potential, which means that Pd@Ni–B/C was more difficult to be electro oxidized and indicates an enhanced stability caused by Pd-decoration.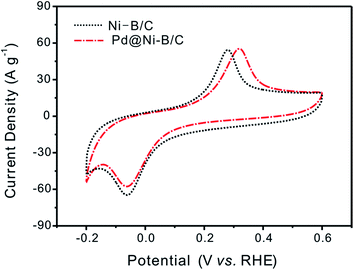 | ||
| Fig. 4 CV curves of Ni–B/C and 1.5 wt% Pd@Ni–B/C in N2 saturated 1 M KOH solution. Scan rate: 10 mV s−1. RDE: 900 rpm. | ||
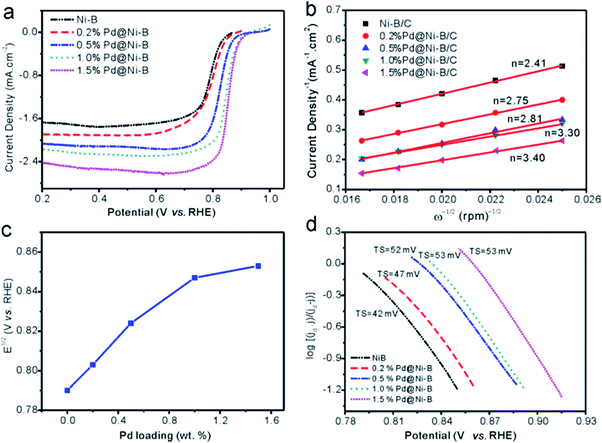
LSV curves at 900 rpm of undecorated Ni–B/C and Pd@Ni–B/C with different Pd loading were compared in Fig. 5a. It can be observed that both the half-wave potential and the limiting current density increased with higher Pd loading. The half-wave potentials for these catalysts were plotted against Pd loading as presented in Fig. 5c. The half-wave potential for Ni–B/C was 0.79 V (vs. RHE), and increased to 0.803 and 0.823 V when 0.2 and 0.5 wt% Pd was decorated. It indicated higher electrocatalytic activity of the catalysts by Pd decoration, which agrees well with the XPS characterization as discussed for Fig. 3. The half-wave potential of 1.5 wt% Pd@Ni–B/C (0.853 V) only moved a little to the positive side compared with 1.0 wt% Pd@Ni–B/C (0.847 V). Considering the high price of Pd and the moderate improvement of ORR performance after Pd loading reached 1.0 wt%, the highest Pd loading used in this research was decided to be 1.5 wt%.
The Koutecky–Levich equation29 was used to calculate the number of electrons transfer at 0.6 V (vs. RHE) as:
 | (1) |
![[thin space (1/6-em)]](https://www.rsc.org/images/entities/char_2009.gif) 485 C mol−1), CO2 is the concentration of oxygen in the electrolyte (8.4 × 10⁻⁷ mol cm−3) and DO2 is the diffusion coefficient of oxygen in 1 M KOH solution (1.65 × 10⁻⁵ cm−2 s−1).30 According to the slope of Koutecky–Levich plots (Fig. 5b), the number of electrons transported for Ni–B/C and 0.2, 0.5, 1.0, and 1.5 wt% Pd@Ni–B/C were calculated to be 2.41, 2.75, 2.81, 3.30 and 3.40, respectively (Fig. 5b). Since O2 could be reduced to H2O by a four-electron transfer process and H2O2 by a two-electron transfer process,25 the increasing number of electron transfer with higher Pd loading in our study suggests an improvement of ORR activity benefited from Pd-decoration.
485 C mol−1), CO2 is the concentration of oxygen in the electrolyte (8.4 × 10⁻⁷ mol cm−3) and DO2 is the diffusion coefficient of oxygen in 1 M KOH solution (1.65 × 10⁻⁵ cm−2 s−1).30 According to the slope of Koutecky–Levich plots (Fig. 5b), the number of electrons transported for Ni–B/C and 0.2, 0.5, 1.0, and 1.5 wt% Pd@Ni–B/C were calculated to be 2.41, 2.75, 2.81, 3.30 and 3.40, respectively (Fig. 5b). Since O2 could be reduced to H2O by a four-electron transfer process and H2O2 by a two-electron transfer process,25 the increasing number of electron transfer with higher Pd loading in our study suggests an improvement of ORR activity benefited from Pd-decoration.
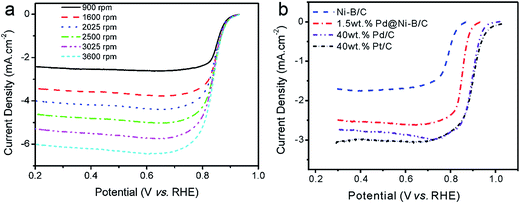
The Tafel slops were also calculated to study the effects of Pd loading on ORR performance of Pd@Ni–B/C. As presented in Fig. 5d, the Tafel slops for Ni–B/C and 0.2, 0.5, 1.0, and 1.5 wt% Pd@Ni–B/C were calculated to be 42, 47, 52, 53 and 53 mV per Dec, respectively. The Tafel slope increased when the loading of Pd becomes higher. Also, the Tafel slop of 1.0 wt% Pd@Ni–B/C and 1.5 wt% Pd@Ni–B/C was comparable, which helped to determine the highest Pd loading to be 1.5 wt% in this study. The influence of the rotation speed was investigated and shown in Fig. 6a, which indicated the current density improved as the rotation speed increased from 900 to 3600 rpm.
The LSV curve of 1.5 wt% Pd@Ni–B/C was also compared with those of undecorated Ni–B/C catalyst, self-prepared Pd/C (40 wt%) and Pt/C (40 wt%) catalysts as shown in Fig. 6b. It can be seen that the ORR performance of Ni–B/C was not very satisfied since the half-wave potential was around 0.80 V (vs. RHE) and the limiting current density was not very high. However, the ORR performance of Pd@Ni–B/C was much better than that of Ni–B/C. The half-wave potential of Pd@Ni–B/C moved about 50 mV to the positive side compared with Ni–B/C, and the diffusion limiting current density increased from 1.7 to 2.4 mA cm−2, showing an increase of nearly 41% than that of amorphous Ni–B/C catalyst. The performance of Pd@Ni–B/C was still not as good as that of Pd/C and Pt/C catalysts, but the low precious metal loading and the obvious lower cost still provide much advantage of the synthesized Pd@Ni–B/C catalyst.
The improvement of ORR performance of Pd@Ni–B/C catalysts in this work was ascribed by the decrease of oxygen adsorption onto the surface of Ni–B/C caused by Pd-decoration, while the poor ORR performance of Ni was ascribed to the excessive O2 binding ability of Ni atoms. Pd-decoration could decrease the O2 adsorption energy of Ni–B/C. As a result, fewer O2 could be absorbed onto the surface of catalysts, which provided more exposed active sites in Pd@Ni–B/C catalysts. This was supported by electrochemical results and XPS results as discussed above.
3.3 Methanol endurance ability and stability test
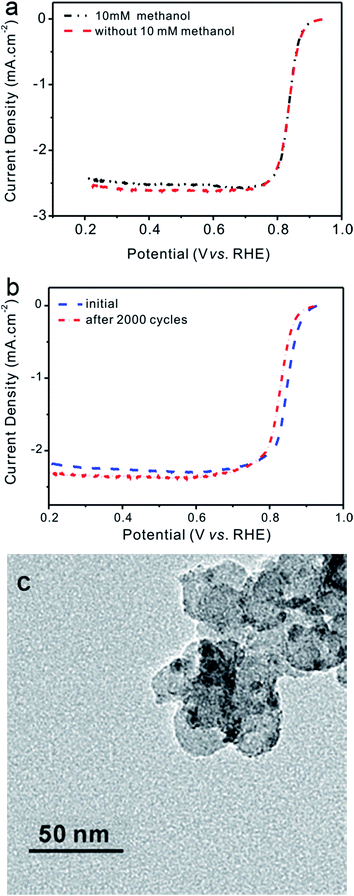
Methanol endurance tests were conducted by comparing LSV curves of catalysts with and without the presence of 10 mM methanol as shown in Fig. 7a. It can be seen that the half-wave potential remained nearly unchanged and the limiting current density decreased less than 5% when exposed to 10 mM methanol. The results demonstrated that Pd@Ni–B/C exhibited good methanol endurance ability.The stability of 1.5 wt% Pd@Ni–B/C was tested by repeat CV scanning for 2000 cycles then comparing the ORR performance before and after scanning. The results showed in Fig. 7b demonstrated that the limiting current density only decreased a little, which suggests a good short-time stability of synthesized Pd@Ni–B/C catalyst. Surprisingly, the half-wave potential moved about 30 mV to the positive side, which means that the activity of the catalyst was improved a little during the repeat of CV scanning. This phenomenon can be explained as following. The Ni atoms were oxidized and deoxidized repeatedly during the CV tests, and they tended to become agglomerated on the surface of the catalysts. It could be revealed from the TEM images of the catalysts after repeating CV scanning for 2000 cycles, as shown in Fig. 7c. It resulted in an increase of the active sites on the surface of Pd@Ni–B/C, which lead to an improvement of ORR activity of Pd@Ni–B/C.
4. Conclusion
Pd-decoration on amorphous Ni–B/C catalysts (Pd@Ni–B/C) were successfully prepared and showed significantly improved ORR activities compared with that of amorphous Ni–B/C catalysts. Both the half-wave potential and the limiting current were obviously increased by Pd-decoration. The Pd@Ni–B/C catalysts also demonstrated high stability and impressive methanol endurance ability. The advantages such as high performance and good methanol endurance ability as well as the ultra-low Pd-loading in Pd@Ni–B/C catalysts make them promising cathode catalysts for fuel cells, especially direct methanol fuel cells.Acknowledgements
This work was financially supported by grants from the National Natural Science Foundation of China (no. U1137602, 51422301), National High Technology Research and Development Program of China (2013AA031902), National Program on Key Basic Research Project (no. 2011CB935700), National Science Foundation of Beijing (no. 2132051), Program for New Century Excellent Talents in University, Beijing Higher Education Young Elite Teacher Project (no. 29201493) and the Fundamental Research Funds for the Central Universities.References
- F. Cheng and J. Chen, Chem. Soc. Rev., 2012, 41, 2172–2192 RSC.
- N. A. Karim and S. K. Kamarudin, Appl. Energy, 2013, 103, 212–220 CrossRef CAS PubMed.
- Q. Liu, J. Jin and J. Zhang, ACS Appl. Mater. Interfaces, 2013, 5, 5002–5008 CAS.
- N. M. Markovic, T. J. Schmidt, V. Stamenkovic and P. N. Ross, Fuel Cells, 2001, 1, 105–116 CrossRef CAS.
- U. A. Paulus, T. J. Schmidt, H. A. Gasteiger and R. J. Behm, J. Electroanal. Chem., 2001, 495, 134–145 CrossRef CAS.
- B. Xia, Y. Yan, X. Wang and X. W. Lou, Mater. Horiz., 2014, 1, 379–399 RSC.
- A. Mani and V. I. Birss, Electrochim. Acta, 2013, 105, 170–179 CrossRef CAS PubMed.
- G. Zhong, H. Wang, H. Yu and F. Peng, Fuel Cells, 2013, 13, 387–391 CrossRef CAS.
- Q. He, Q. Li, S. Khene, X. Ren, F. E. Lopez-Suarez, D. Lozano-Castello, A. Bueno-Lopez and G. Wu, J. Phys. Chem. C, 2013, 117, 8697–8707 CAS.
- X. Dai, J. Qiao, X. Zhou, J. Shi, P. Xu, L. Zhang and J. Zhang, Int. J. Electrochem. Sci., 2013, 8, 3160–3175 CAS.
- Q. Wu, L. Jiang, Q. Tang, J. Liu, S. Wang and G. Sun, Electrochim. Acta, 2013, 91, 314–322 CrossRef CAS PubMed.
- J. Qiao, L. Xu, Y. Liu, P. Xu, J. Shi, S. Liu and B. Tian, Electrochim. Acta, 2013, 96, 298–305 CrossRef CAS PubMed.
- Z.-Q. Liu, Q.-Z. Xu, J.-Y. Wang, N. Li, S.-H. Guo, Y.-Z. Su, H.-J. Wang, J.-H. Zhang and S. Chen, Int. J. Hydrogen Energy, 2013, 38, 6657–6662 CrossRef CAS PubMed.
- Z. X. Liu, Z. P. Li, H. Y. Qin and B. H. Liu, J. Power Sources, 2011, 196, 4972–4979 CrossRef CAS PubMed.
- H. X. Li, H. Li, W. L. Dai and M. H. Qiao, Appl. Catal., A, 2003, 238, 119–130 CrossRef CAS.
- D. Xue, H. Chen, G. H. Wu and J. F. Deng, Appl. Catal., A, 2001, 214, 87–94 CrossRef CAS.
- G. Bai, L. Niu, M. Qiu, F. He, X. Fan, H. Dou and X. Zhang, Catal. Commun., 2010, 12, 212–216 CrossRef CAS PubMed.
- US Pat. 3 183 123 A, 1965.
- D. Wang, H. L. Xin, Y. Yu, H. Wang, E. Rus, D. A. Muller and H. D. Abruña, J. Am. Chem. Soc., 2010, 132, 17664–17666 CrossRef CAS PubMed.
- P. V. Tong, N. D. Hoa, N. V. Duy, V. V. Quang, N. T. Lam and N. V. Hieu, Int. J. Hydrogen Energy, 2013, 38, 12090–12100 CrossRef CAS PubMed.
- X. Liu, S. Wang, Q. Dai and X. Wang, Catal. Commun., 2014, 48, 33–37 CrossRef CAS PubMed.
- X. Yu, M. Wang and H. Li, Appl. Catal., A, 2000, 202, 17–22 CrossRef CAS.
- J. Ma, L. Xu, L. Xu, H. Wang, S. Xu, H. Li, S. Xie and H. Li, ACS Catal., 2013, 3, 985–992 CrossRef CAS.
- S. Lu, D. Cao, X. Xu, H. Wang and Y. Xiang, RSC Adv., 2014, 4, 26940–26945 RSC.
- A. J. Bard and L. R. Faulkner, Electrochemical Methods. Fundamentals and Applications, John Wiley and Sons Inc, 2nd edn, 2001 Search PubMed.
- H. Yamashita, M. Yoshikawa, T. Funabiki and S. Yoshida, J. Chem. Soc., Faraday Trans. 1, 1986, 82, 1771–1780 RSC.
- H. Li, Q. Zhao, Y. Wan, W. Dai and M. Qiao, J. Catal., 2006, 244, 251–254 CrossRef CAS PubMed.
- H. Li, W. Wang, H. Li and J.-F. Deng, J. Catal., 2000, 194, 211–221 CrossRef CAS.
- J. Ge, J. St-Pierre and Y. Zhai, Electrochim. Acta, 2014, 133, 65–72 CrossRef CAS PubMed.
- C. Paliteiro, A. Hamnett and J. B. Goodenough, J. Electroanal. Chem. Interfacial Electrochem., 1987, 233, 147–159 CrossRef CAS.
| This journal is © The Royal Society of Chemistry 2014 |

