A phosphorus-, nitrogen- and carbon-containing polyelectrolyte complex: preparation, characterization and its flame retardant performance on polypropylene

Tao Zhang*ab, Hongqiang Yand, Lie Shenc, Zhengping Fangcd, Xianming Zhanga, Jiajun Wangab and Baoyue Zhangb
aMOE Key Laboratory of Advanced Textile Materials and Manufacturing Technology, College of Materials and Textiles, Zhejiang Sci-Tech University, Hangzhou 310018, People's Republic of China. E-mail: taoyuan0510@126.com; Fax: +86 571 86843255; Tel: +86 571 86843255
bDepartment of Packaging Engineering, College of Materials and Textiles, Zhejiang Sci-Tech University, Hangzhou 310018, People's Republic of China
cMOE Key Laboratory of Macromolecular Synthesis and Functionalization, Department of Polymer Science and Engineering, Zhejiang University, Hangzhou 310027, People's Republic of China
dLab of Polymer Materials and Engineering, Ningbo Institute of Technology, Zhejiang University, Ningbo 315100, People's Republic of China

Received 25th August 2014 , Accepted 18th September 2014

First published on 18th September 2014


Abstract

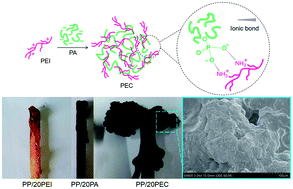
A new polyelectrolyte complex (PEC), containing phosphorus, nitrogen and carbon elements, has been prepared from positively charged polyethylenimine (PEI) and negatively charged phytic acid (PA). The PEC shows good performance in improving the thermo-oxidative stability and flame retardancy of pristine polypropylene (PP). When the content of PEC is 20 wt%, the char residues at 600 °C for the PP/PEC composites (PP/20PEC) are 10 wt% higher than those of pristine PP under an air atmosphere. Meanwhile, the peak heat release rate and total heat release of PP/20PEC are 314 W g−1 and 7.7 kJ g−1 lower than those of pristine PP, respectively. In comparison, PEI or PA is less effective than PEC in improving the thermo-oxidative stability and flame retardancy of pristine PP. Furthermore, the char residues of PP/20PEC are more full and compact, the surfaces of which are covered with a perfect intumescent layer. This work proposes a new guideline for designing and fabricating an intumescent flame retardant system.

Introduction

As we all know, polypropylene (PP) plays an important role in our daily life, because of its low density, excellent mechanical properties and easy processing.1,2 However, the highly flammable nature always threatens the safety of people's life and property.3 Thus, effective improvement of the flammability properties of PP is very important and necessary. For this purpose, various flame retardants have been introduced to PP. Among them, phosphorus containing intumescent system has been proved to be a promising candidate for nonhalogenated flame retardant, because of its high effectiveness and environmental friendliness.4 However, it is worth noting that, effective flame retardancy of this system significantly depends on the cooperation between the phosphorous-based compound (as an acid source), carbonizing agent and foaming agent.5

Hence, methods for combining the three required ingredients, namely the acid source, carbonizing agent and foaming agent are actively sought. For example, extensive research has been carried out to build the intumescent flame retardant system by blending of commercially available materials such as ammonium polyphosphate, pentaerythritol and melamine, which contains one or two of the required ingredients.6,7 In fact, the limited categories of available materials gradually hinder the further development of intumescent flame retardant system. So, many efforts have been devoted to the synthesis of new compounds containing one or more of the required ingredients, most of which involve complicated multistep chemical reactions.1,3

In this situation, polyelectrolytes may provide a new developing room. In general, polyelectrolytes are flexible and can be easily processed in aqueous solution. When oppositely charged polyelectrolytes are mixed together, the electrostatic interaction quickly occurs, resulting in the formation of a new family of multi-component polymeric materials.8 Such multi-component polymeric materials are called polyelectrolyte complexes (PECs), which have been widely used in biomaterials and membrane materials.9,10 Although extensive research has been contributed to the PECs, the phosphorus-, nitrogen- and carbon-containing PECs are still limited, especially the flame retardant applications of PECs in thermoplastic materials are still remained unexplored.

Herein, we report the design and preparation of a novel PEC containing phosphorus, nitrogen and carbon elements, originated from positively charged polyethylenimine (PEI) and negatively charged phytic acid (PA). PEI is one of the most widely used polycations, which has shown excellent performance as carbonizing agent and foaming agent in the multilayer films on fabric.11,12 PA, a natural and innoxious compound containing 6 phosphate carboxyl groups,13,14 has been recently used as an effective acid source in the multilayer films on fabric.15 For the first time, we also evaluate the flame retardant performance of PEC on PP, which could be helpful in the future design and preparation of effective intumescent flame retardant system.

Experimental

Materials

Polypropylene (PP, 1320 HX, MFR = 2.0 g per 10 min) was purchased from BASF Chemicals Company. Polyethylenimine (PEI, branched, Mw = 25[thin space (1/6-em)]000, Mn = 10[thin space (1/6-em)]000) was purchased from Sigma-Aldrich. Phytic acid (PA, 50 wt% solution in H2O) was acquired from Aladdin Chemistry Co., Ltd. Sodium hydroxide (NaOH, ≥96.0%) and concentrated hydrogen chloride (HCl, 36.5–38.0%) were purchased from Hangzhou Chemical Reagent Co., Ltd. Deionized water with a resistance of 18 MΩ was used for all the experiments. All reagents were used as received and without further purification.

Preparation of PEC

Following a slightly modified procedure,10,16 the PEI and PA solutions were prepared as 2.0 and 4.0 wt% concentrations using deionized water, respectively. The pH values of both solutions were adjusted to 1.5 with 5.0 mol L−1 NaOH or HCl solution. As shown in Scheme 1 and Fig. 1, the preparation process of PEC was as follows: the excessive PA solution was added into PEI solution dropwise, yielding a white precipitate, which was collected by filtration, washed with deionized water until neutral, dried under vacuum, and ground to a fine powder (yield: 96%).
image file: c4ra09243k-s1.tif
Scheme 1 Schematic illustration of the preparation of PEC from PEI and PA.

image file: c4ra09243k-f1.tif
Fig. 1 Images of PA solution ((a), 4.0 wt% concentration, pH 1.5), PEI solution ((b), 2.0 wt% concentration, pH 1.5), addition of PA solution into the PEI solution and formation of white aggregates (c), collected PEC before drying (d) and obtained PEC after drying (e).

Preparation of PP/PEI, PP/PA and PP/PEC composites

The PP/PEC composites containing 0, 5, 10 and 20 wt% of PEC (designated as PP, PP/5PEC, PP/10PEC and PP/20PEC, respectively), PP/PEI composites containing 20 wt% of PEI (designated as PP/20PEI) and PP/PA composites containing 20 wt% of PA (designated as PP/20PA) were prepared via melt blending at 180 °C in a Thermo Haake Rheomixer for 8 min with a speed of 60 rpm. Then, the composites were transferred to a mold, preheated at 180 °C for 5 min, pressed at 10.0 MPa for 8 min, and cooled to room temperature at 10.0 MPa for 10 min.

Measurements and characterization

Fourier transform infrared (FT-IR) spectra were obtained from KBr pellets using a Nicolet 5700 spectrometer (Thermo-Nicolet) using 32 scans in the frequency region of 4000–400 cm−1 at a 4 cm−1 resolution. Thermogravimetric analysis (TGA) was conducted on a NETZSCH TG 209 F1 thermogravimetric analyzer under nitrogen or air atmosphere. The samples were first kept at 100 °C for 5 min and then heated up to 600 °C at a heating rate of 20 °C min−1. Differential scanning calorimetric (DSC) was carried out by using a NETZSCH DSC 200 PC unit with a scanning rate of 10 °C min−1 from room temperature to 250 °C and a nitrogen flow rate of 60 ml min−1. Microscale combustibility experiments were carried out on a Govmark MCC-2 microscale combustion calorimeter (MCC; combustor temperature, 900 °C; oxygen/nitrogen flow rate, 20/80 ml/ml). The specimens (in triplicate) were heated from room temperature to 600 °C at a heating rate of 1 °C s−1. The limiting oxygen index (LOI) values were determined according to ASTM D 2863 using an oxygen index instrument (JF-3, Nanjing Jiangning Analytical Instrument Factory, China). The morphologies of the collected char residues after keeping in a muffle furnace at 500 °C for 5 min, were observed using field-emission scanning electron microscopy (FE-SEM, Hitachi S-4800, operated at 3 kV) with an energy-dispersive X-ray (EDX) analyzer. Raman spectra were recorded on a Labor Raman HR-800 system (Jobin Yvon) by exciting a 514.5 nm Ar ion laser.

Results and discussion

Preparation and characterization of PEC

As illustrated in Scheme 1, a novel polyelectrolyte complex was designed and prepared, which combines carbon and nitrogen elements of PEI and carbon and phosphorus elements of PA. To prepare PEC, the PA and PEI solutions were firstly prepared as shown in Fig. 1(a and b). According to literature reports,17 PEI possesses the highest cationic charge density of all known polyelectrolytes and has a strong tendency to form complexes with anionic compound. When the negatively charged PA contacts with the positively charged PEI in aqueous solution at low pH value, white insoluble aggregates formed and precipitated immediately (see Fig. 1(c and d)), which shows similar phenomena to those of chitosan (CS)/sodium carboxymethyl cellulose (CMCNa) (ref. 10) and poly(diallyldimethylammonium chloride) (PDDA)/(CMCNa) (ref. 16) PECs. Adding excessive PA solution into the PEI solution dropwise until the clear visible phase separation occurs. Then, the collected precipitate was washed with deionized water until neutral, during which the free polyelectrolytes and ions can be removed.10 After drying under vacuum, a light yellow solid was obtained (see Fig. 1(e)), and the weight ratio of PA/PEI is about 1.78[thin space (1/6-em)]:[thin space (1/6-em)]1 (EDX spectrum, see Fig. S1, ESI). The obtained PEC is virtually insoluble in organic solvents such as N,N-dimethylformamide and chloroform, but can dissolve slowly in dilute NaOH solution (see Fig. S2, ESI).

Fig. 2 presents the FT-IR spectra of PEI, PA and PEC. It can be clearly seen that the bands at approximately 2852–2958 (stretching vibration of C–H for CH2 group) and 1458 cm−1 (stretching vibration of C–N) are clearly observed for PEC, which are originated from PEI.18,19 Further analysis shows that the bands at approximately 3280–3350 (stretching vibration of N–H for NH2 group20) and 1598 (bending vibration of N–H for NH2 group18) cm−1 almost vanish in the PEC spectrum, and a new band at approximately 1515 cm−1 belongs to the NH3+ vibrational modes appears, confirming the partial protonation of the NH2 group by the added HCl.21 Also in the FT-IR spectrum of PEC, the bands at approximately 1633 (stretching vibration of O–P–O) and 1167 (stretching vibration of P[double bond, length as m-dash]O) cm−1 are clearly observed, which are originated from PA.14 Furthermore, PEC also shows absorption band near 1057 cm−1 ascribed to the stretching mode of (PO3)2− associated with NH3+, indicating the ionic complexation between positively charged PEI and negatively charged PA.22


image file: c4ra09243k-f2.tif
Fig. 2 FT-IR spectra of PEI, PA and PEC.

Fig. 3 shows the DSC thermograms of PEI, PA and PEC. As can be seen, PEI exhibits a broad endothermic peak from 50 to 110 °C and then a sharp endothermic peak from 110 to 180 °C, which is mostly due to the volatilization of absorbed water. For the same reason, the DSC thermogram of PA shows a broad endothermic peak from 50 to 180 °C. However, in the case of PEC, there is no obvious endothermic peak recorded over the range of 50–180 °C. Until the temperature reaches about 190 °C, only a very small endothermic peak is observed. As we all know, PEI and PA are water-soluble and have much stronger tendencies to absorb moisture naturally, which are due to the hydrophilic NH2 and O[double bond, length as m-dash]P–OH group.23 When the ionic complexation between PEI and PA happens, NH2 groups in PEI form complexes with O[double bond, length as m-dash]P–OH group in PA, resulting in insoluble aggregates immediately. After drying, the PEC is water-insoluble and its ability to absorb moisture once again in natural conditions decreases apparently. Hence, the present observations provide further support for the ionic complexation between PEI and PA.


image file: c4ra09243k-f3.tif
Fig. 3 DSC thermograms of PEI, PA and PEC.

Fig. 4 presents the TGA and DTG curves of PEI, PA and PEC under air atmosphere, and the detailed data are listed in Table 1. As can be seen, PA displays a weak and broad mass loss peak from 250 to 400 °C and leaves a char residue of 78 wt% at 600 °C. In the case of PEI, a single and sharp peak with maximum weight loss temperature (Tmax) at 345 °C is observed, demonstrating an intense mass loss rate in this stage. After complexation, the resulting PEC shows the lowest 5 wt% weight loss temperature (T5%) among the three samples and leaves a char residue of 61 wt% at 600 °C, suggesting an excellent char forming ability during thermal oxidation process.24 Furthermore, as shown in Fig. S3, ESI, PEC forms more expanded char residue after burning in air. Therefore, collaboration of PEI and PA at the molecular level endows PEC with rich phosphorus, nitrogen and carbon elements, which are three required components for intumescent flame retardant system.


image file: c4ra09243k-f4.tif
Fig. 4 TGA (a) and DTG (b) curves of PEI, PA and PEC under air atmosphere.
Table 1 Thermal properties of PEI, PA, PEC, PP, PP/PEC systems, PP/20PEI and PP/20PA under air conditiona
Sample T5% (°C) Tmax (°C) Char (wt%)
a Note: T5%: 5 wt% weight loss temperature; Tmax: maximum weight loss temperature; Char: char residues at 600 °C.
PEI 247 345 4
PA 253 308 78
PEC 241 321 61
PP 271 354 1
PP/5PEC 263 357 3
PP/10PEC 256 368 6
PP/20PEC 263 379 11
PP/20PEI 287 392 1
PP/20PA 260 321 10


Thermal properties

The thermal degradation behaviors of PP, PP/PEC systems, PP/20PEI and PP/20PA were analyzed by TGA under air atmosphere as shown in Fig. 5 and Table 1, which is more close to the practical application.25 Compared to the pristine PP, a reduction in T5% is observed with the introduction of PEC, which is mostly due to the earlier degradation of PEC over the range of 200–300 °C.1 However, it is worth noting that the Tmax especially the char residues from 300 to 600 °C for the PP/PEC systems are significantly higher than those of the pristine PP, indicative of the enhancement of thermo-oxidative stability and char formation at high temperature provided by PEC.24,25 Furthermore, the peak value of DTG curve also decreases gradually as the content of PEC increases, signifying the lower mass loss rate during thermo-oxidative decomposition.26,27 As the content of PEC increases to 20 wt%, the Tmax and char residues at 600 °C are increased by 25 °C and 10 wt%, respectively.
image file: c4ra09243k-f5.tif
Fig. 5 TGA (a) and DTG ((b), the insert shows the magnified curves over the range of 200–300 °C) curves of PP, PP/PEC systems, PP/20PEI and PP/20PA under air atmosphere.

In comparison, addition of 20 wt% PEI in PP leads to the increases of T5% and Tmax by 16 and 38 °C, respectively, demonstrating a delayed thermo-oxidative decomposition process. However, a high and sharp mass loss peak appears from 350 to 400 °C, leaving a char residue of only 1 wt% at 600 °C. With the same loading of PA in PP, the T5% and Tmax are decreased by 11 and 33 °C, respectively, which is ascribed to the advanced thermo-oxidative decomposition process catalyzed by PA.15 However, the peak value of DTG curve for PP/20PA is still higher than those of PP and PP/20PEC, failing to decrease the mass loss rate. Furthermore, the char residues of PP/20PA from 250 to 600 °C, especially from 300 to 400 °C, are substantially lower than those of PP/20PEC. These results reveal that the phosphorus-, nitrogen- and carbon-containing PEC is more effective than PEI or PA alone in improving the thermo-oxidative stability of PP, which is based on the earlier stage of decomposition, rapid formation of protective char layer and effective restraint release of gaseous organic fragments.

Flammability properties

In order to assess the flammability properties, we first monitored the heat release rate by MCC, which can simulate the anaerobic pyrolysis and a subsequent reaction of the volatile pyrolysis products with nitrogen/oxygen (80/20) gas mixture at high temperatures.28,29 The heat release rates are plotted as a function of temperature in Fig. 6, and the detailed data are listed in Table 2. As for the pristine PP, the heat release rate curve shows a sharp peak at 481 °C, and the peak heat release rate (PHRR) and total heat release (THR) values are 1129 W g−1 and 41.1 kJ g−1, respectively. Compared to the pristine PP, the PHRR and THR values of PP/PEC systems are shown to decrease with increasing the content of PEC, implying better and better barrier effect on the transference of volatile pyrolysis products into the combustor.30–32 Furthermore, as for the PP/10PEC or PP/20PEC, the peak of the heat release rate curve is followed by a split one, indicating two overlapped combustion process.30 This result is mostly due to the formation of a protective intumescent layer on the surface at relatively high content of PEC, which delays the combustion process and shifts the PHRR to a higher temperature.33 Consequently, the PHRR and THR values of PP/20PEC are 314 W g−1 and 7.7 kJ g−1 lower than those of pristine PP, respectively.
image file: c4ra09243k-f6.tif
Fig. 6 Heat release rate curves of PP, PP/PEC systems, PP/20PEI and PP/20PA. The insert shows the magnified curves over the range of 450–500 °C.
Table 2 Microscale combustion calorimetry and LOI results for PP, PP/PEC systems, PP/20PEI and PP/20PAa
Sample PHRR (W g−1) TPHRR (°C) THR (kJ g−1) LOI (%)
a Note: PHRR: peak heat release rate; TPHRR: temperature for which the total heat release is at its maximum; THR: total heat release; LOI: limit oxygen index.
PP 1129 ± 10 481 ± 3 41.1 ± 0.5 18.0
PP/5PEC 1090 ± 12 487 ± 1 40.8 ± 0.6 19.7
PP/10PEC 886 ± 8 486 ± 3 37.1 ± 0.7 22.0
PP/20PEC 815 ± 14 484 ± 2 33.4 ± 0.2 25.1
PP/20PEI 965 ± 11 477 ± 1 40.6 ± 0.4 18.9
PP/20PA 938 ± 13 481 ± 2 35.0 ± 0.5 19.8


In contrast, with the introduction of 20 wt% PEI to PP, the PHRR value is significantly decreased by 164 W g−1, and the THR value is slightly decreased. This is most likely due to the contribution of the released gases such as ammonia from PEI at high temperature, which can dilute the oxygen/combustible gases and slow down the reaction rate of the volatile pyrolysis products.4,11 When the same content of PA is added in PP, the PHRR and THR values are decreased by 191 W g−1 and 6.1 kJ g−1, respectively. In this sample, the function of PA is mostly performed by triggering the char formation and reducing the amount of combustible gases.5 Apparently, combining the advantages of PEI and PA, the PEC is more effective in improving the flame retardancy of PP under the condition of the same loading.

Further assessment of the flammability properties was provided by the LOI test. The LOI values are shown in Fig. 7(a) and Table 2, and the collected char residues are photographed and shown in Fig. 7(b). As for the pristine PP, the LOI value is only 18.0. It can be clearly seen that the LOI values of PP/5PEC, PP/10PEC and PP/20PEC are 19.7, 22.0 and 25.1, respectively, which are increased substantially with the content of PEC. In comparison, the LOI value of PP/20PEC is higher than that of PP/20PEI or PP/20PA, indicating the higher effectiveness of the use of PEC as flame retardant. During the burning process, PP/20PEC rapidly carbonizes and releases large amounts of nonflammable gases such as ammonia,11 leading to highly expanded and stable foamed char residues. Compared to the earlier results in the literature, the decrease ratio of PHRR value during MCC test in our work is higher than that of ammonium polyphosphate and microencapsulated ammonium polyphosphate with shell of epoxy resin.34 Moreover, the improvement of LOI value in our work is better than that of ammonium polyphosphate3 and comparable to that of poly(4,4-diaminodiphenylmethane-O-bicyclic pentaerythritol phosphate phosphate).1 On the basis of comparisons of the flammability properties, we can conclude that PEC is able to work as an effective intumescent flame retardant and control the flame spreading process.


image file: c4ra09243k-f7.tif
Fig. 7 LOI values (a) and char residues after LOI tests (b) of PP, PP/PEC systems, PP/20PEI and PP/20PA.

Analysis of the collected char residues

To clarify the flame retardant mechanism, the representative char residues for the pristine PP, PP/20PEI, PP/20PA and PP/20PEC after keeping in a muffle furnace at 500 °C for 5 min were collected and analyzed. As shown in Fig. 8 for the FE-SEM, the char residues for the pristine PP are full of big holes, cracks and wrinkles (see Fig. 8(a)), which are believed to be due to the breakage of polypropylene backbone and the following release of volatile pyrolysis products.35,36 In contrast, the char residues of PP/20PEI are relatively plain, surface of which are covered with lots of small-sized holes and cracks (see Fig. 8(b)). Clearly, grape-like bubbles can be seen for the char residues of PP/20PA, exhibiting obvious intumescent effect (see Fig. 8(c)). Compared to others, the surface of char residues for PP/20PEC are almost completely covered with expanded and compact intumescent layer (see Fig. 8(d)). Similar char morphologies were observed in polyelectrolyte PEI/ammonium polyphosphate multilayer coatings on ramie fabrics, which can act as a strong flame shield for the underlying substrate during combustion.11
image file: c4ra09243k-f8.tif
Fig. 8 Top view SEM images of char residues for PP (a), PP/20PEI (b), PP/20PA (c) and PP/20PEC (d).

FT-IR spectroscopy was also employed to gain further insight into the combustion mechanism as shown in Fig. 9. As can be seen, the band intensities around 2841–2953, 1455 and 1372 cm−1 (characteristic absorptions of CH3 group37) of the char residues for PP almost disappear, while the band around 1632 cm−1 (stretching vibration of C[double bond, length as m-dash]C for benzene ring38) appears obviously, indicating the decomposition of PP and the subsequent carbonization process. As for PP/20PEI, the characteristic absorptions at around 3280–3350 (stretching vibration of N–H for NH2 group20) and 1458 cm−1 (stretching vibration of C–N (ref. 19)) almost disappear, also the characteristic absorption at around 1632 cm−1 appears. Furthermore, the char residues for PP/20PA and PP/20PEC shows strong absorption bands at approximately 1160 and 1001 cm−1 ascribed to the stretching vibration of P–O and P–O–P, confirming the formation of phosphoric or polyphosphoric acid in the char layer.1,3,39,40


image file: c4ra09243k-f9.tif
Fig. 9 FT-IR spectra of PP (a) and char residues for PP (b), PA (c), PP/20PEI (d), PP/20PA (e) and PP/20PEC (f).

As shown in Table 3, the EDX analysis exhibits that only carbon and oxygen elements are found in the char residues for the pristine PP and PP/20PEI. However, the relative amount of carbon element for PP/20PEI is higher than that of the char residues for pristine PP, mostly because of the easily carbonized ability of PEI.11 Besides carbon and oxygen elements, phosphorus element is detected in the char residues for the PP/20PA and PP/20PEC. Note that char residues of the PP/20PA exhibit higher relative amount of carbon element than that of pristine PP, revealing the performance of PA on triggering the char formation.41 Moreover, comparing the char residues of PP/20PA and PP/20PEC, it is clear that the introduction of PEC to PP significantly enhances the carbonization degree during combustion, which demonstrates the effective collaboration of PEI and PA.

Table 3 Elemental compositions of char residues for PP, PP/20PEI, PP/20PA and PP/20PEC
Char residue Carbon (C, wt%) Oxygen (O, wt%) Phosphorus (P, wt%)
PP 19.44 80.56
PP/20PEI 24.04 75.96
PP/20PA 20.41 46.34 33.25
PP/20PEC 28.91 46.50 24.59


Insightful information on the char residues was obtained by using Raman spectroscopy as shown in Fig. 10. As can be seen, all the samples present two overlapped peaks at around 1370 and 1590 cm−1, which can be assigned to the D (disordered graphitic lattice, E2g symmetry) and G (ideal graphitic lattice, A1g symmetry) bands, respectively.42 It is well-known that the integrated intensity ratio of D band to G band (ID/IG) can reflect the graphitization degree of carbon materials (that is, a lower ID/IG ratio indicates a higher graphitization level).43,44 With a view to compare the structural state of the char residues, all the spectra are fitted by Guassian curves and analyzed according to the literature method.42,45 For the pristine PP, PP/20PEI, PP/20PA and PP/20PEC, the ID/IG ratios of the char residues are 3.28, 2.99, 2.93 and 2.80, respectively, indicating the highest graphitization degree for the PP/20PEC. Thus, these results rationalize the improved flame retardancy of the PP/PEC systems since the PEC alone is capable of playing multiple roles as an acid source, a carbon source and a foaming agent, which are originated from both components PEI and PA. At high temperature, PEI is easily to be carbonized and release nonflammable gases such as ammonia.11 With the phosphoric or polyphosphoric acid produced by PA, a typical protective intumescent char layer could be formed between the substrate and heat source.


image file: c4ra09243k-f10.tif
Fig. 10 Raman spectra of char residues for PP, PP/20PEI, PP/20PA and PP/20PEC.

Conclusions

In conclusion, a new PEC has been designed and fabricated based on the ionic complexation between positively charged PEI and negatively charged PA. This seemingly simple PEC effectively combines carbon and nitrogen elements of PEI and carbon and phosphorus elements of PA, and shows significant intumescent flame retardant performance on the pristine PP. As the content of PEC increases, the peak values of DTG curves for the PP/PEC systems decrease gradually, and the char residues at 600 °C increase dramatically, revealing a lower mass loss rate and more efficient char formation during thermal decomposition. Significantly, introducing PEC also effectively reduces the PHRR and THR values of PP/PEC systems during the MCC test, implying strong barrier effect on the transference of volatile pyrolysis products into the combustor. Comparing PEI, PA and PEC, the PEC is found to be more effective for char formation and expansion during combustion, suggesting the multiple roles as an acid source, a carbon source and a foaming agent. These features provide a new opportunity for improving the design and fabrication of intumescent flame retardant system. Of course, our approach may also find potential application of PEC in flame retardancy field.

Acknowledgements

This work was financially supported by the National Basic Research Program of China (no. 2010CB631105), National Natural Science Foundation of China (no. 51103129, 51103135), Zhejiang Provincial Natural Science Foundation of China (LQ14E030008) and the Science Foundation of Zhejiang Sci-Tech University (no. 13012144-Y).

References

  1. P. Song, Z. Fang, L. Tong and Z. Xu, Polym. Eng. Sci., 2009, 49, 1326–1331 CAS.
  2. S. S. Ahankari, A. K. Mohanty and M. Misra, Compos. Sci. Technol., 2011, 71, 653–657 CrossRef CAS PubMed.
  3. H.-Q. Peng, Q. Zhou, D.-Y. Wang, L. Chen and Y.-Z. Wang, J. Ind. Eng. Chem., 2008, 14, 589–595 CrossRef CAS PubMed.
  4. A. Dasari, Z.-Z. Yu, G.-P. Cai and Y.-W. Mai, Prog. Polym. Sci., 2013, 38, 1357–1387 CrossRef CAS PubMed.
  5. F. Laoutid, L. Bonnaud, M. Alexandre, J. M. Lopez-Cuesta and P. Dubois, Mater. Sci. Eng., R, 2009, 63, 100–125 CrossRef PubMed.
  6. S.-H. Chiu and W.-K. Wang, Polymer, 1998, 39, 1951–1955 CrossRef CAS.
  7. A. I. Balabanovich, Thermochim. Acta, 2005, 435, 188–196 CrossRef CAS PubMed.
  8. Q. Zhao, Q. F. An, Y. Ji, J. Qian and C. Gao, J. Membr. Sci., 2011, 379, 19–45 CrossRef CAS PubMed.
  9. M.-R. Park, B.-B. Seo and S.-C. Song, Biomaterials, 2013, 34, 1327–1336 CrossRef CAS PubMed.
  10. Q. Zhao, J. Qian, Q. An, C. Gao, Z. Gui and H. Jin, J. Membr. Sci., 2009, 333, 68–78 CrossRef CAS PubMed.
  11. T. Zhang, H. Yan, L. Wang and Z. Fang, Ind. Eng. Chem. Res., 2013, 52, 6138–6146 CrossRef CAS.
  12. Y.-C. Li, J. Schulz, S. Mannen, C. Delhom, B. Condon, S. Chang, M. Zammarano and J. C. Grunlan, ACS Nano, 2010, 4, 3325–3337 CrossRef CAS PubMed.
  13. L. Gao, C. Zhang, M. Zhang, X. Huang and X. Jiang, J. Alloys Compd., 2009, 485, 789–793 CrossRef CAS PubMed.
  14. G. Jiang, J. Qiao and F. Hong, Int. J. Hydrogen Energy, 2012, 37, 9182–9192 CrossRef CAS PubMed.
  15. G. Laufer, C. Kirkland, A. B. Morgan and J. C. Grunlan, Biomacromolecules, 2012, 13, 2843–2848 CrossRef CAS PubMed.
  16. Q. Zhao, J. Qian, Q. An and B. Du, J. Mater. Chem., 2009, 19, 8448–8455 RSC.
  17. A. F. Thünemann and J. Beyermann, Macromolecules, 2000, 33, 6878–6885 CrossRef.
  18. W. Wang, J. Xiao, X. Wei, J. Ding, X. Wang and C. Song, Appl. Energy, 2014, 113, 334–341 CrossRef CAS PubMed.
  19. H. Dong, L. Ding, F. Yan, H. Ji and H. Ju, Biomaterials, 2011, 32, 3875–3882 CrossRef CAS PubMed.
  20. Y.-F. Yang, L.-S. Wan and Z.-K. Xu, J. Membr. Sci., 2009, 337, 70–80 CrossRef CAS PubMed.
  21. G. Lawrie, I. Keen, B. Drew, A. Chandler-Temple, L. Rintoul, P. Fredericks and L. Grøndahl, Biomacromolecules, 2007, 8, 2533–2541 CrossRef CAS PubMed.
  22. S. P. Valappil, D. Ready, E. A. A. Neel, D. M. Pickup, W. Chrzanowski, L. A. O'Dell, R. J. Newport, M. E. Smith, M. Wilson and J. C. Knowles, Adv. Funct. Mater., 2008, 18, 732–741 CrossRef CAS.
  23. Y. Arima and H. Iwata, Biomaterials, 2007, 28, 3074–3082 CrossRef CAS PubMed.
  24. H. Ma, L. Tong, Z. Xu, Z. Fang, Y. Jin and F. Lu, Polym. Degrad. Stab., 2007, 92, 720–726 CrossRef CAS PubMed.
  25. P. a. Song, H. Liu, Y. Shen, B. Du, Z. Fang and Y. Wu, J. Mater. Chem., 2009, 19, 1305–1313 RSC.
  26. T. Zhang, H. Yan, M. Peng, L. Wang, H. Ding and Z. Fang, Nanoscale, 2013, 5, 3013–3021 RSC.
  27. X. Wang, W. Xing, X. Feng, B. Yu, L. Song and Y. Hu, Polym. Chem., 2014, 5, 1145–1154 RSC.
  28. R. E. Lyon, R. N. Walters and S. I. Stoliarov, Polym. Eng. Sci., 2007, 47, 1501–1510 CAS.
  29. D.-Y. Wang, A. Das, F. R. Costa, A. Leuteritz, Y.-Z. Wang, U. Wagenknecht and G. Heinrich, Langmuir, 2010, 26, 14162–14169 CrossRef CAS PubMed.
  30. T. Zhang, H.-q. Yan, Z.-p. Fang and M. Peng, Chin. J. Polym. Sci., 2013, 31, 1359–1371 CrossRef CAS PubMed.
  31. S. Hu, L. Song, H. Pan and Y. Hu, Ind. Eng. Chem. Res., 2012, 51, 3663–3669 CrossRef CAS.
  32. S. Ran, Z. Guo, C. Chen, L. Zhao and Z. Fang, J. Mater. Chem. A, 2014, 2, 2999–3007 CAS.
  33. K. Wu, Z. Wang and Y. Hu, Polym. Adv. Technol., 2008, 19, 1118–1125 CrossRef CAS.
  34. K. Wu, Y. Zhang, W. Hu, J. Lian and Y. Hu, Compos. Sci. Technol., 2013, 81, 17–23 CrossRef CAS PubMed.
  35. S. M. Thornberg, R. Bernstein, A. N. Irwin, D. K. Derzon, S. B. Klamo and R. L. Clough, Polym. Degrad. Stab., 2007, 92, 94–102 CrossRef CAS PubMed.
  36. M. Sarno, G. Gorrasi, D. Sannino, A. Sorrentino, P. Ciambelli and V. Vittoria, Macromol. Rapid Commun., 2004, 25, 1963–1967 CrossRef CAS.
  37. M. Ataeefard and S. Moradian, Appl. Surf. Sci., 2011, 257, 2320–2326 CrossRef CAS PubMed.
  38. M. Sevilla and A. B. Fuertes, Carbon, 2009, 47, 2281–2289 CrossRef CAS PubMed.
  39. C. Ivascu, A. Timar Gabor, O. Cozar, L. Daraban and I. Ardelean, J. Mol. Struct., 2011, 993, 249–253 CrossRef CAS PubMed.
  40. J. Han, G. Liang, A. Gu, J. Ye, Z. Zhang and L. Yuan, J. Mater. Chem. A, 2013, 1, 2169–2182 CAS.
  41. H.-Y. Ma, L.-F. Tong, Z.-B. Xu and Z.-P. Fang, Adv. Funct. Mater., 2008, 18, 414–421 CrossRef CAS.
  42. A. Sadezky, H. Muckenhuber, H. Grothe, R. Niessner and U. Pöschl, Carbon, 2005, 43, 1731–1742 CrossRef CAS PubMed.
  43. F. C. Tai, C. Wei, S. H. Chang and W. S. Chen, J. Raman Spectrosc., 2010, 41, 933–937 CrossRef CAS.
  44. T. Zhang, H. Yan, Z. Fang, Y. E, T. Wu and F. Chen, Appl. Surf. Sci., 2014, 309, 218–224 CrossRef CAS PubMed.
  45. Q. Tai, Y. Hu, R. K. K. Yuen, L. Song and H. Lu, J. Mater. Chem., 2011, 21, 6621–6627 RSC.

Footnote

Electronic supplementary information (ESI) available. See DOI: 10.1039/c4ra09243k

This journal is © The Royal Society of Chemistry 2014