Foad Farivar*a and
Habib Ale Ebrahimb
aChemical Engineering Department, Petrochemical Center of Excellence, Amirkabir University of Technology, Tehran-15875-4413, Iran. E-mail: farivar@aut.ac.ir
bChemical Engineering Department, Amirkabir University of Technology, Tehran-15875-4413, Iran. E-mail: alebrm@aut.ac.ir
First published on 24th September 2014
In this work a two dimensional mathematical model is developed for simulation of axial–radial ammonia synthesis reactors. Mass and energy balance equations are solved by a finite volume method using MATLAB (2012b) software. Momentum and general continuity equations, considering the effect of solid particles, are handled by COMSOL Multiphysics (4.3a). COMSOL is a Finite Element Method (FEM) software package for solving partial differential equations. By linking COMSOL and MATLAB software, momentum, mass, and energy balance equations are solved simultaneously. The MATLAB–COMSOL-LiveLink combines the powerful FEM abilities of COMSOL with the versatile programming environment of MATLAB. The effectiveness factor is calculated by the boundary value differential equation to consider the diffusion effect in catalyst particles. Furthermore the effect of pressure on ammonia concentration in the reactor is studied. Finally, simulation results are validated by the practical data of the Shiraz petrochemical plant.
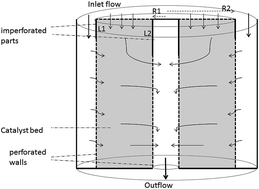
Recently, more advanced axial–radial reactors have been proposed that tries to utilize the advantages of both radial and axial reactors. The main advantages of the axial–radial reactors compared to the classical axial and radial reactors are lower pressure drop and higher catalyst utilization.12 An axial–radial reactor contains one or more axial–radial beds. Each bed has two concentric cylindrical walls with a closed bottom. The catalyst is placed between the walls and the top part of each wall is closed to gas flow while the rest is perforated. Most part of the gas enters the catalyst bed radially and the remaining gas flows down in axial direction. Fig. 1 shows the overall layout of an axial–radial bed and the gas flow directions.
Previous studies on the modeling and simulation of the axial radial reactors were focused on numerical methods and algorithms for solving momentum and continuity equations, and there is no clear simulation results (the results are just presented at the beds outlet and there is no concentration or velocity profiles in the beds),12,13 furthermore in these studies orthogonal collocation method is used to solve the governing equations. The finite difference and orthogonal collocation methods convert the problem to a set of algebraic equations. When the equations is nonlinear, the resulting set of equations is also nonlinear. The solution of the nonlinear equations may not be unique and the generation of any solution may be difficult, moreover, accuracy of this method is strongly depends on the number of collocation points. In this work for accurate simulation of ammonia synthesis reactors COMSOL–MATLAB program linking is used.
• The two dimensional heterogeneous model is considered.
• Heat and mass dispersions are negligible.7
• Steady-state operation is considered.
• The heat transfer resistance between the pellets and gas is negligible.7
• Due to symmetry in the θ direction of a cylindrical coordinate, the governing equations are independent of this direction.
![]() | (1) |
The modified Temkin equation is used to calculate intrinsic rate of reaction, RNH3, as follows:14
![]() | (2) |
k2 = 1.7698 × 10¹⁵![]() ![]() | (3) |
The equilibrium constant, Ka, is calculated as:7
![]() | (4) |
The components activity is defined as:
![]() | (5) |
ai = fi = yiϕiP | (6) |
The fugacity coefficients of nitrogen, hydrogen, and ammonia are determined from.14
![]() | (7) |
Here, the heat of reaction is calculated from the following equation:15
ΔHr = 9723.24[−23![]() | (8) |
Cf is specific heat for the gas mixture. Specific heat for pure components is a function of temperature and pressure that is given in.14
![]() | (9) |
In eqn (9) γi is stoichiometric coefficient of the ith component. After some straightforward manipulations, eqn (9) can be rewritten as the following dimensionless form:7
![]() | (10) |
The boundary conditions of this differential equation are as follows:
![]() | (11) |
Stefan–Maxwell equation for multicomponent diffusion is used for computing the diffusion coefficients of components as described in.16
After calculation of the intraparticle concentration from eqn (10), effectiveness factor can be estimated as:17
![]() | (12) |
![]() | (13) |
∇·(ρu) = 0 | (14) |
![]() | (15) |
Fig. 2 shows the overall two dimensional geometry of axial–radial bed. The boundary conditions used for the simulation are given in Table 1.
![]() | ||
Fig. 2 Axial–radial bed geometry (boundaries described in Table 1). |
Boundary No. | Boundary Condition | Description |
---|---|---|
1,3,6 | Wall | uz = 0; ur = 0 |
2 | Inlet | ur = 0; P = Pin |
4 | Inlet | uz = 0; P = Pin |
5 | Outlet | uz = 0; mass flow rate = m° |
Bed characteristics | |||||
---|---|---|---|---|---|
R1 (m) | R2 (m) | L1 (m) | L2 (m) | L (m) | |
Bed 1 | 0.328 | 1.169 | 0.40 | 0.60 | 2.91 |
Bed 2 | 0.454 | 1.155 | 0.46 | 0.65 | 4.53 |
Bed 3 | 0.504 | 1.154 | 0.61 | 0.80 | 6.92 |
Operating conditions | |
---|---|
Feed flow rate (kmol h−1): | 19622.17 |
Operating pressure (atm): | 220 |
Inlet temperature (K): | 615 |
![]() |
|
Feed compositions: | |
y0_NH3 | 0.0347 |
y0_N2 | 0.2093 |
y0_H2 | 0.6280 |
y0_Ar | 0.0341 |
y0_CH4 | 0.0939 |
The results are given in Fig. 3 and 4. Fig. 3a and b show the streamlines and pressure profile respectively. Fig. 3c shows the radial velocity component in the first bed.
![]() | ||
Fig. 3 (a) streamlines, (b) pressure profile (P (atm)), (c) radial component of velocity profile (ur (m s−1)), in the first bed. |
As shown in Fig. 3 most of the feed gas inters the catalyst bed through the perforated wall in radial direction. And the remaining gas flows down through the catalyst bed in an axial direction.
Fig. 4 shows the ammonia concentration profile in the first bed. The velocity in the axial direction is relatively low and at the top of the bed there is no radial flow, hence the concentration will increase sharply in this part of the bed.
In following the simulation is carried out at Pin = 250 and 300 atm to study the effect of pressure on outlet ammonia concentration. Fig. 5 shows the ammonia concentration profile at Pin = 250 atm.
As expected ammonia concentration is increased by increasing the pressure because higher pressure is thermodynamically favorable for ammonia synthesis reaction. Moreover, density and viscosity increase due to pressure rise hinders the velocity increase.
The simulation results are summarized in Tables 3 and 4. Table 3 shows the simulation result at the first bed outlet and the effect of pressure on outlet concentrations. As mentioned, higher pressure is thermodynamically favorable for ammonia synthesis and increase of the ammonia conversion was expected. Table 4 shows the simulation results at the second and third bed outlet. As it can be seen in Tables 3 and 4, nitrogen conversion (and consequently ammonia mole fraction) in the first bed is higher than those of the second and third ones. This is mainly for lower ammonia content in the first bed. Note that the given concentrations and temperatures are average values at the beds outlet.
Bed: | I | ||||
---|---|---|---|---|---|
Inlet (mol%) | Outlet | ||||
Cal. (300 atm) | Cal. (250 atm) | Cal. (220 atm) | Exp. (220 atm) | ||
NH3 | 3.47 | 15.46 | 14.67 | 13.05 | 14.05 |
N2 | 20.93 | 17.51 | 17.78 | 18.25 | 17.96 |
H2 | 62.80 | 52.63 | 53.36 | 54.74 | 53.9 |
CH4 | 9.39 | 10.58 | 10.41 | 10.25 | 10.33 |
Ar | 3.41 | 3.82 | 3.78 | 3.71 | 3.76 |
Temp (°C) | 342 | 539.7 | 521.2 | 494.2 | 494.7 |
Bed: | II | III | ||||||
---|---|---|---|---|---|---|---|---|
Compon. | Inlet (mol%) | Outlet | Relative error (%) | Inlet (mol%) | Outlet | Relative error (%) | ||
Cal. | Exp. | Cal. | Exp. | |||||
NH3 | 11.13 | 16.17 | 16.63 | 2.75 | 16.17 | 20.19 | 20.24 | 0.25 |
N2 | 18.78 | 17.37 | 17.23 | 0.81 | 17.37 | 16.23 | 16.22 | 0.62 |
H2 | 56.34 | 52.10 | 51.71 | 0.75 | 52.10 | 48.70 | 48.67 | 0.61 |
CH4 | 10.09 | 10.55 | 10.58 | 0.28 | 10.55 | 10.92 | 10.91 | 0.91 |
Ar | 3.66 | 3.83 | 3.84 | 0.26 | 3.83 | 3.96 | 3.96 | 0 |
Temp (°C) | 407.0 | 484.08 | 480.4 | 0.85 | 400.0 | 448.5 | 445.2 | 0.75 |
Results in Tables 3 and 4 demonstrate a good agreement between the simulated and industrial data.
COMSOL has an option to save the model as an M-file which is updated during the modeling. Then we have to modify the saved M-File by adding the input variables of the axial–radial model to the MATLAB function.
Next step is to start the COMSOL–MATLAB LiveLink (Windows: COMSOL with MATLAB, Linux: COMSOL server MATLAB, alternatively using mphstart.m in the COMSOL installation directory). Finally, load the axial–radial example model from the Model Library using mphload command as:
>model = mphload (‘axial–radial’); |
The mphload command automatically searches the COMSOL path to find the requested file. Mpheval function evaluates the velocity and pressure, which are the axial–radial model dependent variables. Mpheval uses the nodes of a simplex mesh to evaluate the function. To get data at a specific location not necessarily defined by node points, mphinterp command can be used to interpolate the results. The interpolation method uses the shape function of the elements.19
ε | Porosity of catalyst bed |
η | Effectiveness factor |
ϕi | Fugacity coefficient of component i |
ΔHr | Heat of reaction (kJ kmol−1) |
μ | fluid viscosity (Pa s) |
ρ | Density (kg m−3) |
This journal is © The Royal Society of Chemistry 2014 |