 Open Access Article
Creative Commons Attribution 3.0 Unported Licence
Catalyst-assisted electrochemical deposition of graphene decorated polypyrrole nanoparticles film for high-performance supercapacitor†
Yee Seng
Lim
a,
Hong Ngee
Lim
*ab,
Su Pei
Lim
c and
Nay Ming
Huang
 c
c
aDepartment of Chemistry, Faculty of Science, Universiti Putra Malaysia, 43400 UPM, Serdang, Selangor, Malaysia. E-mail: janet_limhn@yahoo.com; Tel: +60163301609
bFunctional Device Laboratory, Institute of Advanced Technology, Universiti Putra Malaysia, 43400 UPM, Serdang, Selangor, Malaysia
cLow Dimensional Materials Research Centre, Department of Physics, Faculty of Science, University of Malaya, 50603 Kuala Lumpur, Malaysia
First published on 14th October 2014
Abstract
A simple catalyst-assisted electrochemical deposition technique has been implemented to control the particle size of polypyrrole in the range of 5 to 10 nm embedded on graphene sheets, in which the nanocomposite will be used as a supercapacitor electrode material. The polypyrrole/graphene nanocomposite resulting from this approach maximizes the pseudocapacitive contribution of redox-active polypyrrole and electrical double layer capacitance (EDLC) contributed by individual graphene sheets. Specific capacitance, as high as 797.6 F g−1 is obtained when 1.0 mM of FeCl3 catalyst is added to the deposition solution, which is approximately four times higher than that of polypyrrole film and 2.6 times higher than that of polypyrrole/graphene nanocomposite in the absence of catalyst. This increase is attributed to the controlled particle size of polypyrrole growth on individual graphene sheets, which prevents the overlapping of graphene sheets. This gives rise to a highly open structure, which provides an easier access of electrolyte within the matrix of the nanocomposite film. A fabricated symmetric supercapacitor device yields a specific capacitance of 463.15 F g−1 and capacitance retention of 77.7% over 10![[thin space (1/6-em)]](https://www.rsc.org/images/entities/char_2009.gif) 000 charge/discharge cycles at a current density of 1 A g−1. The nanocomposite serves as a promising electrode material for supercapacitors.
000 charge/discharge cycles at a current density of 1 A g−1. The nanocomposite serves as a promising electrode material for supercapacitors.
1. Introduction
Graphene (GR) is a monolayer of sp2 hybridized carbon atoms arranged in a honeycomb lattice with a host of unusual properties,1,2 and thus emerges as a highly promising material for various applications.3–7 Graphene oxide (GO), obtained by oxidizing graphite with a strong oxidizer, whose basal planes and edges are rich with oxide-functional groups, has also recently attracted significant interest. The oxygen-containing groups, such as epoxy, hydroxyl, ether and carbonyl, promote good solubility in polar solvent and render versatility for the construction of GO-based hybrid nanocomposites, hence, expanding their potential applications.8Conducting polymers, such as polypyrrole (PPy), have been studied in great detail because their unique metal-like electrical properties, as well as highly desirable polymeric characteristics such as flexibility, low density, and ease of structural modification, lead to many new possibilities for device fabrication.9 Interest has developed in using PPy as an electrode material for supercapacitors owing to the ease of preparation, stability at ambient conditions and relatively high conductivity10–13 and is considered as one of the most promising electrode materials. Recently, there have been attempts to hybridize conducting polymers/carbon nanocomposite materials as supercapacitor electrodes, in which high capacitance and good stability have been achieved because of the synergistic effect between them.14–17 There are efforts to incorporate GR and its derivatives into PPy-based nanocomposite materials to harness its unique properties.18–20
A variety of electrode synthesis methods have been employed to form PPy/GR heterostructures. One-pot electrochemical copolymerization onto a substrate may be the best method to fabricate electrode materials. It is anticipated that the new nanocomposite materials may significantly enhance the performance and stability because of the synergistic effect of both the materials. However, electrochemical copolymerization with GR suffers from polymeric aggregation, in which the polymer often blocks electrolyte channels on the outer surface forming a dense polymer layer, which completely envelops GR sheets. This leads to high electrode resistance due to the poor interconnection of electronic conductivity in the structure.21,22 The dense layer of polymer on the surface of the composite film hinders the penetration of electrolyte into the bulk of the composite material. Consequently, the thick polymeric matrix limits the charge transfer kinetics, which has been considered as the main cause of reduction of practical specific capacitance of PPy/GR nanocomposite because only the surface of the film takes part in the charge storage process.
In a recent study, Davies et al.23 synthesized a high performance supercapacitor using pulse electropolymerization of PPy onto a pre-synthesized GR film, and demonstrated an improved uniformity of PPy coating on GR. Although a conformal coating of PPy on the pre-synthesized GR film is achieved, the pre-synthesized GR sheets have high tendency to restack during the preparation of graphene, leaving behind inter-graphene pore sizes that are not sufficient for accessibility to the electrolyte and the formation of EDL charges.24 This approach reduces the practical specific capacitance of GR. To fully harness the pseudocapacitance of PPy and EDLC of GR in PPy/GR nanocomposite, the pore accessibility of GR, as well as the particles size of PPy coated on GR sheets are critically important issues.25 Hence, substantial improvements have to be made for its commercialization. The challenges are in controlling the growth of the particle size of PPy on individual GR sheets during electrochemical deposition and simultaneously preventing GR sheets from restacking during the process.
Previously, several methods were used for the synthesis of PPy/GR nanocomposite as supercapacitor electrode, including in situ chemical oxidation polymerization,19,26,27 electropolymerisation,28–30 liquid/liquid interfacial polymerization.31 To the best of our knowledge, the catalyst-assisted electrochemical deposition method has not been previously reported for the synthesis of nanocomposite, and it only had been reported to control the particle size and morphology of PPy film.32 In this study, nano-size PPy particles are homogeneously decorated onto individual GR sheets as a result of chemical polymerization-potentiostatic process. These PPy nanoparticles, which acted as spacers to prevent the restacking of individual GR sheets, could only be materialized in the presence of FeCl3 as a catalyst to control the size and uniform dispersion of PPy on GR. The catalyst-assisted polypyrrole/graphene (C-PPy/GR) nanocomposite approach realizes a unique three-dimensional open structure, which facilitates the diffusion of electrolyte, resulting in impressive electrochemical properties.
2. Experimental methods
2.1 Materials
Graphite powder was obtained from Ashbury Graphite Mills Inc., code no. 3061. Sulfuric acid (H2SO4, 95–98%), phosphoric acid (H3PO4, 85%), potassium permanganate (KMnO4, 99.9%), and hydrogen peroxide (H2O2, 30%) were purchased from Systerm Chemicals. Hydrogen chloride (HCl, 37%) and iron(III) chloride (FeCl3, 98%) were purchased from Sigma-Aldrich. Pyrrole (99%, Acros Organics) was stored at 0 °C and distilled prior to use. Sodium p-toluenesulfonate (NapTS, 70%) was purchased from Fluka.2.2 Preparation of GO
GO was synthesized using a simplified Hummers method. Graphite oxide was obtained by the oxidation of 3 g of graphite flakes with H2SO4![[thin space (1/6-em)]](https://www.rsc.org/images/entities/char_2009.gif) :
:![[thin space (1/6-em)]](https://www.rsc.org/images/entities/char_2009.gif) H3PO4 (360
H3PO4 (360![[thin space (1/6-em)]](https://www.rsc.org/images/entities/char_2009.gif) :
:![[thin space (1/6-em)]](https://www.rsc.org/images/entities/char_2009.gif) 40 ml) and 18 g of KMnO4. The mixing process, using a magnetic stirrer, took less than 5 min to complete. However, to ensure the complete oxidation of the graphite, the mixture was stirred for 3 days. During the oxidation, the color of the mixture changed from dark purplish green to dark brown. To stop the oxidation process, H2O2 solution was added, whereupon the color of the mixture changed to bright yellow, indicating the high oxidation level of the graphite. The graphite oxide formed was washed with 1 M HCl in aqueous solution, and then repeatedly washed with deionized water until a pH of 4–5 was achieved. The washing process was carried out using a simple decantation of the supernatant via a centrifugation technique. During the washing process with deionized water, the graphite oxide experienced exfoliation, which resulted in a thickening of the GO solution, forming GO gel. The concentration of the GO gel was 4.38 mg ml−1.
40 ml) and 18 g of KMnO4. The mixing process, using a magnetic stirrer, took less than 5 min to complete. However, to ensure the complete oxidation of the graphite, the mixture was stirred for 3 days. During the oxidation, the color of the mixture changed from dark purplish green to dark brown. To stop the oxidation process, H2O2 solution was added, whereupon the color of the mixture changed to bright yellow, indicating the high oxidation level of the graphite. The graphite oxide formed was washed with 1 M HCl in aqueous solution, and then repeatedly washed with deionized water until a pH of 4–5 was achieved. The washing process was carried out using a simple decantation of the supernatant via a centrifugation technique. During the washing process with deionized water, the graphite oxide experienced exfoliation, which resulted in a thickening of the GO solution, forming GO gel. The concentration of the GO gel was 4.38 mg ml−1.
2.3 Preparation of C-PPy/GR nanocomposite
PPy/GR nanocomposite films were synthesized by catalyst-assisted electrochemical polymerization from an aqueous solution placed in a one-compartment cell. The deposition solution contained 0.1 M pyrrole, 1 mg ml−1 GO, 0.1 M NapTS and 1.0 mM FeCl3, and was vigorously stirred for 30 min to allow the formation of PPy nanoparticles in the solution. The experiment was repeated with the same condition and the amount of FeCl3 was varied at 0.25 mM and 0.50 mM to investigate the effect of FeCl3 on the morphology of PPy/GR nanocomposite. The concentration of FeCl3 was maintained low to ensure that the polymer was primarily doped with pTS− ions. Then, the solution was transferred to deposition cell, and PPy/GR was deposited at a constant potential of +0.8 V using potentiostat-galvanostat (Elchema model EQCN-502 Faraday cage) at room temperature. A graphite electrode was used as the counter electrode, whereas the working electrode was indium tin oxide (ITO) coated glass. All the potentials were referenced to a saturated calomel electrode (SCE). The time of polymerization was 2 h. The weight of PPy/GR nanocomposite electrode is determined via a weight difference of ITO before and after deposition. For comparison, a 0.1 M PPy/GR nanocomposite film without the catalyst was synthesized and 0.1 M PPy film was synthesized with and without the catalyst. All the films were thoroughly washed with distilled water to ensure that the water soluble FeCl3 is removed from the sample at the end of the reaction.2.4 Materials characterizations
The surface morphology of PPy, C-PPy, PPy/GR and C-PPy/GR was investigated using a field emission scanning electron microscopy (FESEM, FEI Nova NanoSEM 400). High resolution transmission electron microscopy (HRTEM) was carried out using a JEOL JEM-2100 F. The crystalline structure of the samples was analyzed using a Siemens D5000 X-ray diffractometer (XRD). Raman spectra were measured using a Renishaw inVia Raman microscope with a 532 nm laser and FTIR spectra were recorded on a Perkin-Elmer spectrophotometer, model 1725x.2.5 Electrochemical measurements
To understand the electrochemical performance of the nanocomposite electrode, the electrochemical properties of the materials were measured using a VersaSTAT 3 electrochemical system (Princeton Applied Research). Cyclic voltammetry (CV), galvanostatic charge/discharge and electrochemical impedance spectroscopy (EIS) were all carried out in a three-electrode cell system consisting of the nanocomposite film as a working electrode, a platinum wire as a counter electrode and an Ag/AgCl as a reference electrode. CV was carried out between −0.2 and 0.8 V (versus Ag/AgCl) at scan rates between 2 and 100 mV s−1. The specific capacitance values of the samples are calculated from cyclic voltammograms using eqn (1).33| Cm = ∫i/m*s | (1) |
2.6 Supercapacitor device testing
A two-electrode cell configuration was used to measure the performance of the as-fabricated supercapacitor. The supercapacitor was assembled using two pieces of 1.0 mM Fe C-PPy/GR as the electrode, and a piece of filter paper soaked with 1.0 M Na2SO4 aqueous electrolyte was used as a separator. The specific capacitance per mass of one electrode is calculated according to eqn (2)34| Cm = 4C/m | (2) |
| Ecell = CcellV2/2 | (3) |
| Pcell = E/t | (4) |
3. Results and discussions
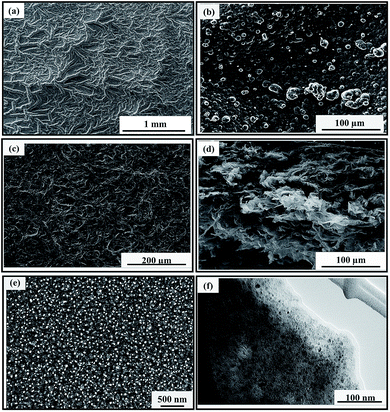
Graphene-based materials are currently the most promising electrode materials in the application of supercapacitors. However, the performance of graphene-based materials is largely determined by its nanostructures. Hence, numerous methods have been employed to tailor the nanostructures of graphene-based materials. In the present work, we combined the chemical polymerization (FeCl3) and electrochemical polymerization (potentiostatic polymerization) to control the nanostructure of the materials. The effect of catalyst on the morphology of the synthesized samples was first examined using FESEM.Fig. 1 shows the FESEM images of polypyrrole and polypyrrole/graphene nanocomposite with and without the presence of catalyst. In the presence of Fe3+ ion as a catalyst in the deposition solution, the C-PPy film shows dense dendritic structure (Fig. 1a). The dendritic PPy was possibly formed through micelle guided growth process by the pTS ions,36 a phenomenon that has been observed with amphiphilic dopants, such as β-naphthalenesulfonic acid, pyrenesulfonic acid and p-toluenesulfonic acid.37–39 The addition of oxidizing catalyst will polymerize the pyrrole monomer within the pTS micelle clusters. The presence of the catalyst increases the rate of polymerization, causing the geometry of the micelle clusters to stretch to accommodate the increase of PPy matrix, leading to dentritic PPy structure. In contrast, the PPy film grown in the absence of FeCl3 by the same process had typical cauliflower morphology (Fig. 1b). The slower rate of polymerization due to the absence of the catalyst enables the formation of PPy to occur within the confinement of the spherical micelle clusters. During the electrochemical deposition, the PPy formed in the deposition solution will be electropolymerized onto the ITO glass.
When GO is present during chemical polymerization, nano-PPy will uniformly adhere onto the GO sheets (Fig. S1†). During electropolymerization, the nano-PPy/GO sheets will deposit onto ITO and each individual PPy/GO sheet will randomly overlap with one other, forming C-PPy/GR nanocomposite (Fig. 1c). The electrochemical reduction of GO to GR from aqueous has been reported by applying negative voltages.40 However, when pyrrole monomers are present in the aqueous suspension, the GO can be reduced to GR forming PPy/GR nanocomposite at positive potential, which has been explained in detail in a previous study.30 In brief, during the initial stage of the electro-oxidation of pyrrole monomers, radical cations of pyrrole monomers will form, releasing the free electrons. The negatively charged GO will be attracted to the radical pyrrole cations due to electrostatic charge attraction. The subsequent chain growth of polypyrrole will reduce GO to GR by the free electrons released upon the formation of radicals, resulting in the formation of PPy/GR through π–π stacking interaction.
Fig. 1c shows the top view of the catalyst-assisted electrochemical deposition of C-PPy/GR nanocomposite film with the addition of 1.0 mM FeCl3. The image reveals an extended, continuous and porous network. A cross sectional view of the nanocomposite film depicts a highly porous, 3-D structure formed from the random overlapping of the GR sheets (Fig. 1d). A magnified image of a single GR sheet shows that the PPy nanoparticles homogeneously assemble on the GR sheet (Fig. 1e). These PPy nanoparticles assemblies on the GR sheets prevent π–π stacking interaction, resulting in a highly porous structure, which effectively facilitates the penetration of electrolyte and subsequently increases the pseudocapacitive contribution of nano-PPy. The TEM image of C-PPy/GR visualizes the black nanoparticles of PPy homogeneously embedded on a GR sheet. This suggested that the particle size of PPy is well controlled in the range of 5–10 nm using combined chemical and electrochemical polymerization.
Fig. 2a illustrates the deposition process in the absence of a catalyst. The absence of catalyst does not lead to the formation of PPy nanoparticles on the GO sheets. The pyrrole monomers electropolymerized and precipitated on the ITO and adjacent GO sheets, resulting in the formation of a layer of PPy film, which acts as a barrier that prevents the diffusion of additional pyrrole monomers between the GR sheets, leading to the thickening of PPy on the GR sheets instead. Furthermore, polymeric aggregation is worsened by the continuous electropolymerization on the existing polymer chains rather than nucleation to form new chains. The continual PPy agglomeration on the GR surface with a little penetration between the GR sheets leads to the formation of a dense morphology. Such structure lacks electrolyte channels, and thus reduces the contribution of pseudocapacitance from PPy and EDLC from GR because only the surface of the film takes part in the charge storage process.
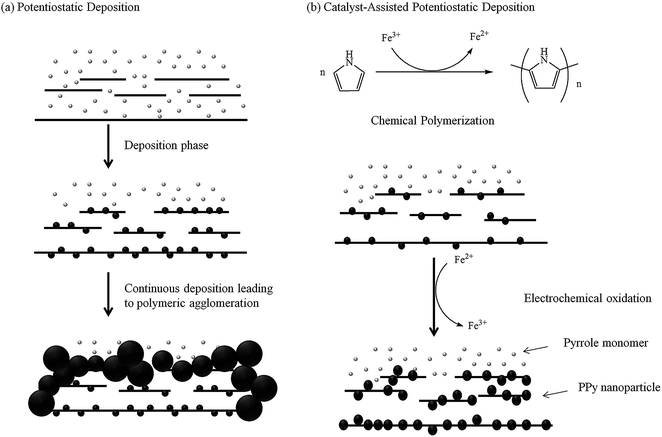 | ||
| Fig. 2 Schematic diagram illustrating the whole catalyst-assisted electropolymerization process compared with the potentiostatic electropolymerization (continuous deposition) process. | ||
A catalyst-assisted electrodeposition is shown in Fig. 2b, in which a low concentration of Fe3+ is added into the solution. Fe3+-catalyzed polymerization occurs during the 30 min of stirring prior to electrodeposition. The Fe3+ catalyst oxidizes the pyrrole monomers to form PPy nanoparticles on the GO sheets, simultaneously reducing Fe3+ to Fe2+.32 The subsequent electrodeposition process binds the nano-PPy/GO sheets to one another and reduces the GO to GR, forming the scaffold of the C-PPy/GR nanocomposite. The addition of the catalyst results in the uniform deposition of nano-PPy throughout the graphene film, hence, maximizing the exposed surface area of PPy and preventing the GR sheets to restack by interrupting the formation of π–π interaction between neighboring GR sheets. Fe3+ will be simultaneously regenerated during the electrochemical oxidation of PPy nanoparticles and can be re-employed to synthesize PPy nanoparticles.
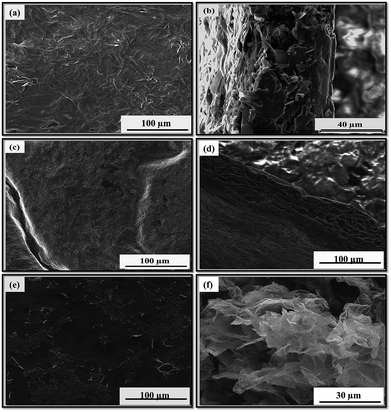
To investigate the effect of FeCl3 on the morphology of PPy/GR nanocomposite, various catalyst concentrations were added into the deposition solution. Regardless of the catalyst concentration, the C-PPy/GR nanocomposites have a 3-D porous structure. However, the formation of nano-size PPy particles was dependent upon the amount of the catalyst added. Fig. 3a depicts the top view of PPy/GR prepared in the absence of FeCl3, which has a dense and flat surface. Fig. 3b illustrates the cross sectional view of the film, made up of an agglomeration of GR and PPy because of the alignment of GR and PPy through the π-electrons interaction.26 With the addition of 0.25 mM of FeCl3 into the deposition solution, a waxy but porous surface is obtained (Fig. 3c), and its cross sectional view shows reduced polymeric agglomeration (Fig. 3d), considerably different from the one prepared without the catalyst. As the concentration of FeCl3 was further increased to 0.5 mM, the agglomeration of the polymer was retarded, as illustrated by the scarcity of polymeric aggregation (Fig. 3e). Its cross sectional view resembles that of the film prepared electrochemically with 1.0 mM FeCl3 (Fig. 3f). A higher concentration of catalyst apparently enhances the nucleation process for the formation of PPy nanoparticles on the GR sheets. The lack of a thick polymeric layer on the graphene sheets allows these thin silk-like sheets to randomly arrange into a highly porous structure.
X-ray photoelectron spectroscopy (XPS) was used to confirm the functional groups of the prepared nanocomposite. Fig. 4a shows the wide scan and de-convoluted C1s XPS spectra of GO, C-PPy and C-PPy/GR. In Fig. S2,† the peak at 399.6 eV in the full XPS spectrum of C-PPy/GR indicates the presence of nitrogen from the PPy on the GR.41 Moreover, the peak of Fe (700 eV)42 is not present in C-PPy and C-PPy/GR proving that the catalyst is thoroughly washed from samples.
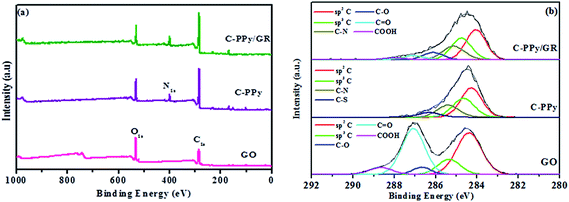 | ||
| Fig. 4 (a) Wide scans of GO, C-PPy, and C-PPy/GR nanocomposite film, and (b) de-convoluted XPS spectra of GO, C-PPy, and C-PPy/GR nanocomposite film. | ||
Moreover in Fig. 4b, the C1s core level spectrum of the GO film could be fitted into five component peaks with binding energies at 284.3 eV, 285.3 eV, 286.6 eV, 287.0 eV and 288.6 eV, attributed to the sp2 hybridized carbon, sp3 hybridized carbon, C–O, C![[double bond, length as m-dash]](https://www.rsc.org/images/entities/char_e001.gif) O and COOH species, respectively.43 The XPS spectrum of the pure PPy film demonstrated four component peaks, which were observed at 283.9 eV, 284.4 eV, 284.9 eV and 286.3 eV, suggesting the presence of sp2 hybridized carbon, sp3 hybridized carbon, C–N groups and the C–S group from NapTS as a dopant.44 The XPS C1S core level spectrum of the PPy/GR nanocomposite film could be fitted into six component peaks with binding energies of 283.8 eV, 284.5 eV, 285.0 eV, 286.2 eV, 287.7 eV and 289.0 eV, which are attributed to sp2 hybridized carbon, sp3 hybridized carbon, C–N, C–O, C
O and COOH species, respectively.43 The XPS spectrum of the pure PPy film demonstrated four component peaks, which were observed at 283.9 eV, 284.4 eV, 284.9 eV and 286.3 eV, suggesting the presence of sp2 hybridized carbon, sp3 hybridized carbon, C–N groups and the C–S group from NapTS as a dopant.44 The XPS C1S core level spectrum of the PPy/GR nanocomposite film could be fitted into six component peaks with binding energies of 283.8 eV, 284.5 eV, 285.0 eV, 286.2 eV, 287.7 eV and 289.0 eV, which are attributed to sp2 hybridized carbon, sp3 hybridized carbon, C–N, C–O, C![[double bond, length as m-dash]](https://www.rsc.org/images/entities/char_e001.gif) O and COOH. The oxygenated carbons were detected in the XPS spectrum of C-PPy/GR, but the intensities of these peaks are far diminished from those of GO. This indicates the deoxygenation of GO during the electrodeposition process.
O and COOH. The oxygenated carbons were detected in the XPS spectrum of C-PPy/GR, but the intensities of these peaks are far diminished from those of GO. This indicates the deoxygenation of GO during the electrodeposition process.
The obtained nanocomposites were further confirmed by XRD, as shown in Fig. S2.† The XRD pattern of the GO revealed an intense, sharp peak centered at 2θ = 9.9°, corresponding to an interlayer spacing (d-spacing) of 0.89 nm. The value of interplanar spacing depends on the degree of oxygen functionality on the surface of GO.41 For PPy and C-PPy, a broad asymmetric peak is observed from 2θ = 11° to 30°, indicating that PPy is amorphous. The broad peak comprises of two peaks at 2θ = 16° and 22.8°. The high angle peak arises from PPy chain, which is close to the inter-planar Van der Waals distance for aromatic groups and the peak at 16° corresponds to pyrrole counter ion, or intercounter ion scattering interactions.45 In the case of the PPy/GR and C-PPy/GR nancomposites, crystalline peaks are similar to those of PPy and C-PPy films, respectively. The absence of typical GO peaks for all nanocomposites indicates that the GO had been reduced to GR during the electrodeposition process. The XRD patterns of C-PPy/GR and C-PPy are less defined and wider than that of PPy/GR and PPy. This is because, in addition to being amorphous, the size of the dentritic PPy of C-PPy and nano-sized PPy of C-PPy/GR is significantly less orderly and smaller than their counterparts prepared in the absence of a catalyst. The absence of FeCl3 peaks in the XRD pattern proved that the catalyst is thoroughly washed at the end of the reaction using distilled water.
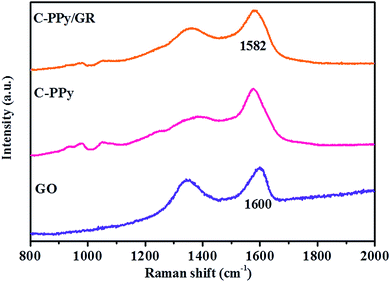
The Raman spectra obtained for GO, C-PPy and C-PPy/GR are shown in Fig. 5. For C-PPy, the bands located at 935, 981, and 1052 cm−1 are assigned to C–H out-of-plane deformation, ring deformation and C–H in-plane deformation, respectively.46,47 The bands at 1380 and 1577 cm−1 are attributed to ring stretching and C![[double bond, length as m-dash]](https://www.rsc.org/images/entities/char_e001.gif) C backbone stretching of PPy.48 These characteristic bands are also observed in the Raman spectrum of C-PPy/GR. Moreover, the characteristic D band (1357 cm−1) and G band (1582 cm−1) of GO are also exhibited in the nanocomposite film. The G band corresponds to the vibration of sp2 hybridized carbon49 while the D band indicates the defect or edge plane in the structure.41 Therefore, the D/G intensity ratio (ID
C backbone stretching of PPy.48 These characteristic bands are also observed in the Raman spectrum of C-PPy/GR. Moreover, the characteristic D band (1357 cm−1) and G band (1582 cm−1) of GO are also exhibited in the nanocomposite film. The G band corresponds to the vibration of sp2 hybridized carbon49 while the D band indicates the defect or edge plane in the structure.41 Therefore, the D/G intensity ratio (ID![[thin space (1/6-em)]](https://www.rsc.org/images/entities/char_2009.gif) :
:![[thin space (1/6-em)]](https://www.rsc.org/images/entities/char_2009.gif) IG) expresses the atomic ratio of sp2/sp3 carbons to measure the extent of disordered graphite. The calculated ID
IG) expresses the atomic ratio of sp2/sp3 carbons to measure the extent of disordered graphite. The calculated ID![[thin space (1/6-em)]](https://www.rsc.org/images/entities/char_2009.gif) :
:![[thin space (1/6-em)]](https://www.rsc.org/images/entities/char_2009.gif) IG ratio for GO is 0.89, which indicates the extensive oxidation of GO in the process of chemical oxidation of graphite, leading to a reduction in the size of the in-plane sp2 domains.50 The ID
IG ratio for GO is 0.89, which indicates the extensive oxidation of GO in the process of chemical oxidation of graphite, leading to a reduction in the size of the in-plane sp2 domains.50 The ID![[thin space (1/6-em)]](https://www.rsc.org/images/entities/char_2009.gif) :
:![[thin space (1/6-em)]](https://www.rsc.org/images/entities/char_2009.gif) IG ratio (0.76) of C-PPy/GR significantly decreases, indicating the conversion of GO into GR.41 The relatively large sp2 domains of the nanocomposite film indicate the increase of π-electron conjugation within the sp2 domain. As a result, the spectrum of the nanocomposite shows a red shift in the G band (1582 cm−1) as compared to GO (1600 cm−1), another evidence for the reduction of GO.51
IG ratio (0.76) of C-PPy/GR significantly decreases, indicating the conversion of GO into GR.41 The relatively large sp2 domains of the nanocomposite film indicate the increase of π-electron conjugation within the sp2 domain. As a result, the spectrum of the nanocomposite shows a red shift in the G band (1582 cm−1) as compared to GO (1600 cm−1), another evidence for the reduction of GO.51
The FTIR spectrum of GO in Fig. S3† shows a broad and intense peak at 3355 cm−1, which corresponds to OH peak. The peak at 1723 cm−1 and those in the range of 1400–1000 cm−1 correspond to C–O functionalities; COOH and COC/C–OH, respectively. These absorption bands are typical of GO.52 From the spectrum of C-PPy/GR, the absorption bands related to oxygen containing groups diminished, proving that GO had been effectively reduced. Moreover, the peaks at 1514, 1430, 1119 and 1003 cm−1 correspond to N–H bend, aromatic ring stretching, C–N stretching and N–H out-of-plane bending of PPy, respectively, showing the presence of PPy in the nanocomposite film.52,53
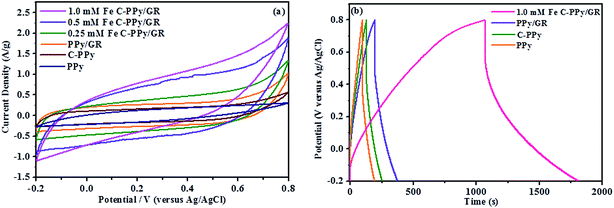
The CV curves of PPy, PPy/GR and C-PPy/GR have increasingly rectangular shape and symmetrical anodic and cathodic directions, which are the characteristics of an ideal supercapacitor,54 as shown in Fig. 6a. All C-PPy/GR nanocomposite electrode exhibits high output current in comparison to the electrode of PPy and PPy/GR, indicating an enhancement of charge storage in C-PPy/GR. Generally, voltammograms with a higher current response correspond to higher specific capacitance. Applying eqn (1) to the CV curves for all the electrodes yields specific capacitances ranging from 797.6 F g−1 for 1.0 mM Fe C-PPy/GR, 689.6 F g−1 for 0.5 mM Fe C-PPy/GR, 422.9 F g−1 for 0.25 mM Fe C-PPy/GR, 296.9 F g−1 for PPy/GR, 188.5 F g−1 for C-PPy and 157.4 F g−1 for PPy. These results demonstrate that with only 1.0 mM FeCl3 catalyst, the capacitance of the nanocomposite increases more than 4 times compared with the PPy films synthesized with and without a catalyst, and increase 2.6 times compared with PPy/GR nanocomposite film, making it an efficient and cost-effective electrode. 1.0 mM Fe C-PPy/GR shows the best performance because its high particle density and narrow size distribution leads to a unique 3-D morphology that contributes to a high degree of electrolyte channels. This structure allows the pseudocapacitance from PPy and EDLC from GR to be fully harnessed, thus exhibiting superior charge storage performance in supercapacitor application. Conversely, the thick and densely packed PPy particle growth of PPy/GR is undesirable for fast ion kinetics and attributes to decreased charge storage performance.
All of the curves in Fig. 6b display a near-ideal EDLC behavior of the charge/discharge curves, in which the charge and discharge slopes are symmetrical and triangular curves are observed.55 The curved slopes indicate a faradaic reaction process. 1.0 mM Fe C-PPy/GR has the most pronounced curvatures because of its increased contribution of pseudocapacitance to the electrochemical system, reflecting an improvement of capacitance.
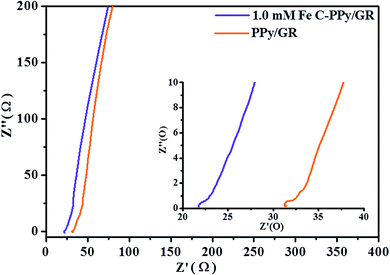
All EIS plots (Fig. 7) exhibit a straight line at low frequencies, indicating a pure capacitive behavior that represents ion diffusion in the electrode structure.56 The first intercept point of the semi-circle on the real axis represents equivalent series resistance (ESR). This corresponds to the total resistance due to resistance from the electrolyte, internal resistance of electrode and contacts between the electrode and the current collector.57 The diameter of the semicircle is associated with the double layer capacitance and charge transfer resistance (Rct).58 The resistance arises due to discontinuities in the charge transfer process at the electrode/electrolyte interface contributed by different conductivity of the electrode material (electronic conductivity) and aqueous electrolyte phase (ionic conductivity). This forms an activation barrier (also called kinetic regime), which limits the migration of charge-complexes. The ESR and Rct for 1.0 mM Fe C-PPy/GR (ESR = 21.7 Ω and Rct = 0.7 Ω) nanocomposite are lower than that of PPy/GR (ESR = 31.3 Ω and Rct = 0.9 Ω) nanocomposite. This is caused by polymeric agglomeration in PPy/GR, which blocks the electrolyte channels and prevents the continuous diffusion of the electrolyte to the electrode material. On the contrary, the highly porous structure of C-PPy/GR enables easier access (less resistance) for the intercalation and de-intercalation of charges. The inset in Fig. 7 shows a magnified high frequency region of the nanocomposites. The impedance pseudo-semicircles are attributable to good electronic conductivity of the nanocomposites.
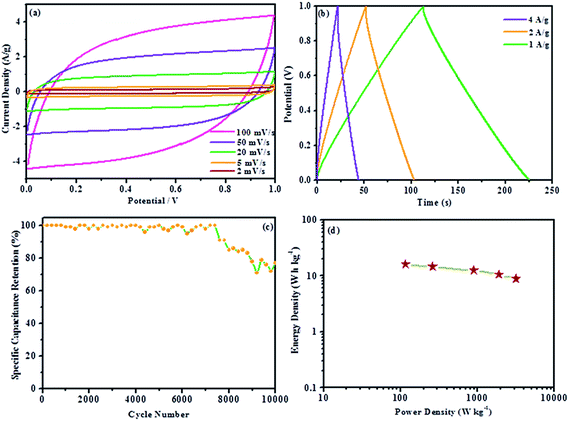
Most of the reported results of the hybrid system of graphene (EDLC) and metal oxide/conducting polymer (pseudocapacitance) use a three-electrode system for electrochemical measurements. However, the performance of composite materials considerably varies.59–61 A three-electrode system shows a high sensitivity to faradaic reaction, which explains the large deviation when measuring the energy storage capability of a supercapacitor electrode material.34 There is still a scarcity of the measurement of materials assembled into a supercapacitor device. To further evaluate the actual performance of the nanocomposite as an electrode material for supercapacitors, we fabricated a symmetrical two-electrode cell using 1.0 mM Fe C-PPy/GR. The selection of 1.0 mM Fe C-PPy/GR was based on the results of the three-electrode system. 1.0 mM Fe C-PPy/GR displays the largest current and superior kinetics due to the enhanced morphology resulting in superior charge storage and delivery properties. Fig. 8a exhibits the CV of the supercapacitor device with a rectangular shape over a 1.0 V potential window, indicating excellent charging and discharging of the sandwich device.62 The specific capacitance of 1.0 mM Fe C-PPy/GR is calculated according to eqn (2), in which the specific capacitance of the electrode under the scan rates of 100, 50, 20, 5 and 2 mV s−1 are 252.55, 303.39, 356.81, 415.78 and 463.15 F g−1, respectively, which are higher than those reported for polypyrrole/graphene assembly into supercapacitor device.20,63,64 The highest reported value is 280 F g−1.
Fig. 8b shows the galvanostatic charge/discharge of the supercapacitor device at current densities of 1, 2 and 4 A g−1. The linear symmetric charging and discharging at different current densities signifies outstanding reversibility, which is useful for real application as the system is able to handle different current ranges.65 The specific capacitance is calculated using equation given below:
| C = iΔt/mΔV |
In Fig. 8c, the specific capacitance retention is plotted against cycle number showing the stability of the device. Encouragingly, the device exhibits excellent stability up to ∼7500 cycles before its performance gradually decreases. The device exhibits the capacitance retention of 77% up to 10![[thin space (1/6-em)]](https://www.rsc.org/images/entities/char_2009.gif) 000 cycles at a current density of 1 A g−1, which demonstrates that the 1.0 mM Fe C-PPy/GR nanocomposite possesses good electrochemical stabilities. The dependence between power output and energy density is shown in a Ragone plot (Fig. 8d). It shows the device has good power density and energy density. A high power density of 3156.88 W kg−1 was achieved with energy density of 8.77 W h kg−1 (specific capacitance of 252.55 F g−1 at the scan rate of 100 mV s−1) and still maintained its power density of 115.79 W kg−1 with energy density of 16.08 W h kg−1 (specific capacitance of 463.15 F g−1 at the scan rate of 2 mV s−1). The result showed improved energy density (1.4–10.5 W h kg−1) from a previous report for polypyrrole/graphene.20 The thin paper-like nanocomposite is a potential electrode for the realization of a flexible supercapacitor. The supplementary video of the nanocomposite sandwiched into a device and successfully lighting up an LED, conveys a clear message that it is indeed workable as a flexible supercapacitor. No binder such as PTFE is employed to bridge the nanocomposite onto the current collector.
000 cycles at a current density of 1 A g−1, which demonstrates that the 1.0 mM Fe C-PPy/GR nanocomposite possesses good electrochemical stabilities. The dependence between power output and energy density is shown in a Ragone plot (Fig. 8d). It shows the device has good power density and energy density. A high power density of 3156.88 W kg−1 was achieved with energy density of 8.77 W h kg−1 (specific capacitance of 252.55 F g−1 at the scan rate of 100 mV s−1) and still maintained its power density of 115.79 W kg−1 with energy density of 16.08 W h kg−1 (specific capacitance of 463.15 F g−1 at the scan rate of 2 mV s−1). The result showed improved energy density (1.4–10.5 W h kg−1) from a previous report for polypyrrole/graphene.20 The thin paper-like nanocomposite is a potential electrode for the realization of a flexible supercapacitor. The supplementary video of the nanocomposite sandwiched into a device and successfully lighting up an LED, conveys a clear message that it is indeed workable as a flexible supercapacitor. No binder such as PTFE is employed to bridge the nanocomposite onto the current collector.
4. Conclusions
We presented a simple method to create polypyrrole and graphene nanocomposite films using a catalyst-assisted electrochemical deposition method with significantly enhanced charge storage performance. The FESEM images clearly show that the particle size of PPy was controlled using different concentrations of FeCl3 catalyst, and nano-sized PPy was rooted on the GR sheets in the presence of 1.0 mM of the catalyst. In contrast, without the catalyst, PPy in nano-sized dimension could not be formed, as the elongation instead of nucleation of PPy occurred. This explains the formation of a thick layer PPy in the nanocomposite in the absence of the catalyst. The highly porous PPy decorated graphene enables the efficient transfer of electrons, as well as ions within the matrix of the nanocomposite.A three-electrode measurement was performed to evaluate the electrochemical performance of C-PPy/GR. The results concluded that the 1.0 mM Fe C-PPy/GR nanocomposite displays the best electrochemical performance with a specific capacitance of 797.6 F g−1. Then, this nanocomposite was used as an electrode material to construct a supercapacitor. The result shows that the device remarkably (463.15 F g−1) performed with excellent reversibility. A capacity retention of 77% at 1 A g−1 could be achieved for 10![[thin space (1/6-em)]](https://www.rsc.org/images/entities/char_2009.gif) 000 cycles. The impressive performance of C-PPy/GR was attributed to the unique morphology of C-PPy/GR, in which the pseudocapacitance of PPy and EDLC of GR could be fully harnessed. In view of the advantages, the catalyst-assisted electrochemically synthesized C-PPy/GR nanocomposite is an important basis for the material design of supercapacitor electrode.
000 cycles. The impressive performance of C-PPy/GR was attributed to the unique morphology of C-PPy/GR, in which the pseudocapacitance of PPy and EDLC of GR could be fully harnessed. In view of the advantages, the catalyst-assisted electrochemically synthesized C-PPy/GR nanocomposite is an important basis for the material design of supercapacitor electrode.
Acknowledgements
The author would like to thank Universiti Putra Malaysia for the Graduate Research Fellowship. This research work was supported by Prototype Research Grant Scheme (PRGS/1/2013/TK02/UPM/02/1), Exploratory Research Grant Scheme (ER008-2012A) and High Impact Research Grant UM.C/1/HIR/MOHE/SC/21) from the Ministry of Higher Education. The authors are grateful to Prof. Dr Rodney Ruoff from the University of Texas at Austin for his valuable advice on the paper.References
- L. Grande, V. T. Chundi, D. Wei, C. Bower, P. Andrew and T. Ryhanen, Particuology, 2012, 10, 1–8 CrossRef CAS PubMed.
- V. Singh, D. Joung, L. Zhai, S. Das, S. I. Khondaker and S. Seal, Prog. Mater. Sci., 2011, 56, 1178–1271 CrossRef CAS PubMed.
- D. A. C. Brownson and C. E. Banks, Analyst, 2010, 135, 2768–2778 RSC.
- M. Pumera, Chem. Rec., 2009, 9, 211–223 CrossRef CAS PubMed.
- D. A. C. Brownson, D. K. Kampouris and C. E. Banks, J. Power Sources, 2011, 196, 4873–4885 CrossRef CAS PubMed.
- N. T. Kirkland, T. Schiller, N. Medhekar and N. Birbilis, Corros. Sci., 2012, 56, 1–4 CrossRef CAS PubMed.
- J. Liu, L. Zhang, H. B. Wu, J. Lin, Z. Shen and X. W. Lou, Energy Environ. Sci., 2014, 7, 3709–3719 CAS.
- D. R. Dreyer, S. Park, C. W. Bielawski and R. S. Ruoff, Chem. Soc. Rev., 2010, 39, 228–240 RSC.
- T. A. Skotheim and J. R. Reynolds, Handbook of conducting polymers, CRC, 2007 Search PubMed.
- D. P. Dubal, S. H. Lee, J. G. Kim, W. B. Kim and C. D. Lokhande, J. Mater. Chem., 2012, 22, 3044–3052 RSC.
- Y. Wang, C. Yang and P. Liu, Chem Eng J, 2011, 172, 1137–1144 CrossRef CAS PubMed.
- W. Sun, R. Zheng and X. Chen, J. Power Sources, 2010, 195, 7120–7125 CrossRef CAS PubMed.
- Y. Wang, X. Wang, C. Yang, B. Mu and P. Liu, Powder Technol., 2013, 235, 901–908, DOI:10.1016/j.powtec.2012.11.049.
- H. Lee, H. Kim, M. S. Cho, J. Choi and Y. Lee, Electrochim. Acta, 2011, 56, 7460–7466 CrossRef CAS PubMed.
- H. An, Y. Wang, X. Wang, L. Zheng, X. Wang, L. Yi, L. Bai and X. Zhang, J. Power Sources, 2010, 195, 6964–6969 CrossRef CAS PubMed.
- S. R. Sivakkumar, J. M. Ko, D. Y. Kim, B. C. Kim and G. G. Wallace, Electrochim. Acta, 2007, 52, 7377–7385 CrossRef CAS PubMed.
- J. Liu, J. Sun and L. Gao, J. Phys. Chem. C, 2010, 114, 19614–19620 CAS.
- S. Bose, T. Kuila, M. E. Uddin, N. H. Kim, A. K. T. Lau and J. H. Lee, Polymer, 2010, 51, 5921–5928 CrossRef CAS PubMed.
- S. Bose, N. H. Kim, T. Kuila, K. Lau and H. L. Joong, Nanotechnology, 2011, 22, 369502 CrossRef.
- D. Zhang, X. Zhang, Y. Chen, P. Yu, C. Wang and Y. Ma, J. Power Sources, 2011, 196, 5990–5996 CrossRef CAS PubMed.
- Y. Han, B. Ding and X. Zhang, Chin. Sci. Bull., 2011, 56, 2846–2852, DOI:10.1007/s11434-011-4646-1.
- Y. Fang, J. Liu, D. J. Yu, J. P. Wicksted, K. Kalkan, C. O. Topal, B. N. Flanders, J. Wu and J. Li, J. Power Sources, 2010, 195, 674–679 CrossRef CAS PubMed.
- A. Davies, P. Audette, B. Farrow, F. Hassan, Z. Chen, J. Choi and A. Yu, J. Phys. Chem. C, 2011, 115, 17612–17620, DOI:10.1021/jp205568v.
- C. Liu, Z. Yu, D. Neff, A. Zhamu and B. Z. Jang, Nano Lett., 2010, 10, 4863–4868, DOI:10.1021/nl102661q.
- J. Liu, W. Zhou, L. Lai, H. Yang, S. Hua Lim, Y. Zhen, T. Yu, Z. Shen and J. Lin, Nano Energy, 2013, 2, 726–732 CrossRef CAS PubMed.
- C. Xu, J. Sun and L. Gao, J. Mater. Chem., 2011, 21, 11253–11258 RSC.
- L. Fan, G. Liu, J. Wu, L. Liu, J. Lin and Y. Wei, Electrochim. Acta, 2014, 137, 26–33, DOI:10.1016/j.electacta.2014.05.137.
- Y. Song, J. Xu and X. Liu, J. Power Sources, 2014, 249, 48–58, DOI:10.1016/j.jpowsour.2013.10.102.
- Y. S. Lim, Y. P. Tan, H. N. Lim, N. M. Huang, W. T. Tan, M. A. Yarmo and C. Yin, Ceram. Int., 2014, 40, 3855–3864, DOI:10.1016/j.ceramint.2013.08.026.
- Y. S. Lim, Y. P. Tan, H. N. Lim, N. M. Huang and W. T. Tan, J. Polym. Res., 2013, 20, 1–10, DOI:10.1007/s10965-013-0156-y.
- C. Bora and S. K. Dolui, Polymer, 2012, 53, 923–932, DOI:10.1016/j.polymer.2011.12.054.
- L. Xu, W. Chen, A. Mulchandani and Y. Yan, Angew. Chem., Int. Ed., 2005, 44, 6009–6012 CrossRef CAS PubMed.
- J. Wang, Y. Xu, X. Chen and X. Du, J. Power Sources, 2007, 163, 1120–1125 CrossRef CAS PubMed.
- M. D. Stoller and R. S. Ruoff, Energy Environ. Sci., 2010, 3, 1294–1301, 10.1039/c0ee00074d.
- Y. J. Kang, S. Chun, S. Lee, B. Kim, J. H. Kim, H. Chung, S. Lee and W. Kim, ACS Nano, 2012, 6, 6400–6406, DOI:10.1021/nn301971r.
- J. Wang, Y. Xu, F. Yan, J. Zhu and J. Wang, J. Power Sources, 2011, 196, 2373–2379, DOI:10.1016/j.jpowsour.2010.10.066.
- J. Liu and M. Wan, J. Mater. Chem., 2001, 11, 404–407 RSC.
- G. Lu, C. Li and G. Shi, Polymer, 2006, 47, 1778–1784 CrossRef CAS PubMed.
- Y. S. Yang, J. Liu and M. X. Wan, Nanotechnology, 2002, 13, 771 CrossRef CAS.
- M. Hilder, B. Winther-Jensen, D. Li, M. Forsyth and D. R. MacFarlane, Phys. Chem. Chem. Phys., 2011, 13, 9187–9193, 10.1039/c1cp20173e.
- C. A. Amarnath, C. E. Hong, N. H. Kim, B. Ku, T. Kuila and J. H. Lee, Carbon, 2011, 49, 3497–3502, DOI:10.1016/j.carbon.2011.04.048.
- D. Wilson and M. A. Langell, Appl. Surf. Sci., 2014, 303, 6–13 CrossRef CAS PubMed.
- S. Yumitori, J. Mater. Sci., 2000, 35, 139–146 CrossRef CAS.
- L. Ruangchuay, J. Schwank and A. Sirivat, Appl. Surf. Sci., 2002, 199, 128–137 CrossRef CAS.
- K. Cheah, M. Forsyth and V. Truong, Synth. Met., 1998, 94, 215–219 CrossRef CAS.
- J. Duchet, R. Legras and S. Demoustier-Champagne, Synth. Met., 1998, 98, 113–122 CrossRef CAS.
- Y. Furukawa, S. Tazawa, Y. Fujii and I. Harada, Synth. Met., 1988, 24, 329–341 CrossRef CAS.
- N. G. Sahoo, Y. C. Jung, H. H. So and J. W. Cho, Synth. Met., 2007, 157, 374–379 CrossRef CAS PubMed.
- P. Si, S. Ding, X. Lou and D. Kim, RSC Adv., 2011, 1, 1271–1278 RSC.
- S. Stankovich, D. A. Dikin, R. D. Piner, K. A. Kohlhaas, A. Kleinhammes, Y. Jia, Y. Wu, S. T. Nguyen and R. S. Ruoff, Carbon, 2007, 45, 1558–1565 CrossRef CAS PubMed.
- C. Liu, K. Wang, S. Luo, Y. Tang and L. Chen, Small, 2011, 7, 1203–1206 CrossRef CAS PubMed.
- Y. Han, L. Hao and X. Zhang, Synth. Met., 2010, 160, 2336–2340, DOI:10.1016/j.synthmet.2010.09.008.
- S. Jamadade, S. V. Jadhav and V. Puri, J. Non-Cryst. Solids, 2011, 357, 1177–1181 CrossRef CAS PubMed.
- B. E. Conway, Electrochemical supercapacitors: scientific fundamentals and technological applications, Plenum Press, 1999 Search PubMed.
- A. L. Reddy and S. Ramaprabhu, J. Phys. Chem. C, 2007, 111, 7727–7734, DOI:10.1021/jp069006m.
- Y. Wang, Z. Shi, Y. Huang, Y. Ma, C. Wang, M. Chen and Y. Chen, J. Phys. Chem. C, 2009, 113, 13103–13107, DOI:10.1021/jp902214f.
- S. K. Meher, P. Justin and G. R. Rao, Electrochim. Acta, 2010, 55, 8388–8396 CrossRef CAS PubMed.
- S. D. Perera, R. G. Mariano, N. Nijem, Y. Chabal, J. P. Ferraris and K. J. Balkus Jr, J. Power Sources, 2012, 215, 1–10 CrossRef CAS PubMed.
- Z. Li, J. Wang, X. Liu, S. Liu, J. Ou and S. Yang, J. Mater. Chem., 2011, 21, 3397–3403, 10.1039/c0jm02650f.
- H. Wang, Q. Hao, X. Yang, L. Lu and X. Wang, Electrochem. Commun., 2009, 11, 1158–1161, DOI:10.1016/j.elecom.2009.03.036.
- D. Wang, F. Li, J. Zhao, W. Ren, Z. Chen, J. Tan, Z. Wu, I. Gentle, G. Q. Lu and H. Cheng, ACS Nano, 2009, 3, 1745–1752, DOI:10.1021/nn900297m.
- J. Yan, J. Liu, Z. Fan, T. Wei and L. Zhang, Carbon, 2012, 50, 2179–2188, DOI:10.1016/j.carbon.2012.01.028.
- H. P. de Oliveira, S. A. Sydlik and T. M. Swager, J. Phys. Chem. C, 2013, 117, 10270–10276, DOI:10.1021/jp400344u.
- F. Zhang, F. Xiao, Z. H. Dong and W. Shi, Electrochim. Acta, 2013, 114, 125–132, DOI:10.1016/j.electacta.2013.09.153.
- S. O. Kasap, Principles of electronic materials and devices, McGraw-Hill, Boston, 2006 Search PubMed.
Footnote |
| † Electronic supplementary information (ESI) available. See DOI: 10.1039/c4ra09234a |
| This journal is © The Royal Society of Chemistry 2014 |

