Improvement of CdSe quantum dot sensitized solar cells by surface modification of Cu2S nanocrystal counter electrodes

Jeong-Hyun Park, Sung-Jin Kang, Soojin Kim, Hochun Lee and Jong-Soo Lee*
Department of Energy Systems Engineering, Daegu Gyeongbuk Institute of Science & Technology (DGIST), Daegu, 711-873, Republic of Korea. E-mail: jslee@dgist.ac.kr

Received 23rd August 2014 , Accepted 6th October 2014

First published on 6th October 2014


Abstract

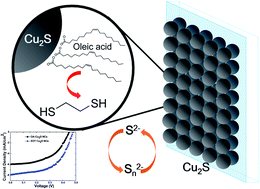
We report the improvement of a CdSe quantum-dot-sensitized solar cell (QDSSCs) based on surface modification of Cu2S nanoparticle counter-electrodes (CEs). In this work, we explored a low-cost, easy method to fabricate counter electrodes by direct deposition of colloidal Cu2S NCs on conducting FTO glass using drop casting or spin coating. The colloidal Cu2S NC films provide high surface area, which improves the catalytic activity for the redox couple and enhances the final photovoltaic performance. A CdSe QDSSC based on the 0.1 M EDT treated Cu2S CE/FTO shows a short-circuit current density (JSC) of 7.95 mA cm−2, a fill factor (FF) of 55.44%, and yielded a superior power conversion efficiency (η) of 2.1%, an improvement of 50% over that of the OA-capped Cu2S CE/FTO CE (1.4%).


1. Introduction

Quantum-dot-sensitized solar cells (QDSSCs) are the most promising solar energy conversion devices due to their larger extinction coefficient, to a bandgap tunable by adjustment of the QD size and composition, and to the generation of multiple excitons from each photon absorbed.1–4 In the last few years, the power conversion efficiency (PCE) of QDSSCs has achieved remarkable improvement.5–10 Nevertheless, QDSSCs still show rather limited efficiency compared to competing systems, including dye-sensitized solar cells (DSSC),11 perovskite solar cells,12,13 and thin-film-based solar cells.14 The main reason for the poor efficiency of QDSSCs is the charge recombination required before extracting the carriers, made necessary by back-electron transfer occurring at the interface between the photo-anode and electrolyte.15–17 Another critical issue is poor electrical catalytic activity between the electrolyte and the counter electrode (CE).18–20 To improve the performance of QDSSCs, one needs to optimize proper charge injection from NCs to the TiO2 photo-anodes, and facile-charge transfer to the redox couple at the CE. Recently, various Pt-free inorganic chalcogenide materials (e.g., Cu2S, CoS, PbS), and hybrid graphene-based nano-composites, have been reported as alternatives for CE made with expensive platinum (Pt).21–25 In particular, The Cu2S CE is the most commonly used for high efficiency QDSSCs because of its superior catalytic activity and stability.18,20 A successive ionic layer adsorption and reaction (SILAR) and spray pyrolysis method are used to deposit Cu2S counter electrode onto FTO. However, these methods are limited to make uniform counter electrode to improve catalytic activity and charge transfer.26 The general procedure most often used to fabricate Cu2S CE involves soaking a thin brass substrate in a polysulfide-electrolyte solution to form Cu2S interfacial layers on the substrate.18–20 This method, however, may give rise to serious corrosion of the brass substrate by the polysulfide electrolyte, leading to mechanical instability of the electrode and to leakage of the electrolyte solution. To overcome these obstacles, we explored a low-cost method to fabricate a CE by direct deposition of colloidal-Cu2S NCs with high surface-to-volume ratio onto conducting FTO glass using drop-casting or spin-coating. Long-chain organic ligands, crucial for colloidal synthesis, provide thick insulating barriers around each NCs for blocking the charge transport in NC solids. It was recently reported that surface treatment with shorter ligand like 1,2-ethanedithiol (EDT), hydrazine (N2H4) and metal chalcogenide complexes (MCCs) significantly decrease the interparticle spacing and improve electronic transport in NC films.27–32 Cu2S-NC films provide greater surface area, thus improving catalytic activity for the redox couple and enhancing the final photovoltaic performance. In this paper, we report the effects of surface modification of CE assembled from colloidal-Cu2S NCs to evaluate the photovoltaic performance of CdSe QDSSCs. Our results show that CdSe QDSSCs based on 0.1 M-EDT-treated Cu2S NCs/FTO CE provide a PCE of 2.1%, an improvement of 50% over that of OA-capped Cu2S NCs/FTO CE (1.4%). Furthermore, the CdSe QDSSCs based on 0.1 M EDT-treated Cu2S/FTO CEs show outstanding mechanical stability in working conditions involving continuous exposure and illumination for several hours, without drastic reduction of the efficiency.

2. Experimental procedures

2.1 Materials

All the following chemicals were used as received: selenium (powder, 99.99%, Aldrich), cadmium oxide (CdO, 99% Aldrich), trioctylphosphine (TOP, 97%, Strem), oleic acid (OA, 90%, Aldrich), trioctylphosphine oxide (TOPO, 99%, Aldrich), 1-octadecene (ODE, 90%, Aldrich), oleylamine (97%, Aldrich), dodecanethiol (98%, Aldrich), copper(II) acetylacetonate (99.99%, Aldrich), ammonium diethyldithiocarbamate (Aldrich).

2.2 Synthesis of CdSe QDs

CdSe NCs were synthesized using the hot injection method. The precursor [0.5 M Cd(oleate)2] was prepared by heating CdO (1.45 g, 0.5 M) and oleic acid (20 ml) at 240 °C for 30 min under nitrogen flow. A selenium solution (1 M TOP) was prepared by dissolving selenium shots in TOP under vigorous stirring. For the synthesis of CdSe NCs, 3 ml of Cd(oleate)2 and 2.2 g of TOPO were mixed with 16 ml of ODE in a 3-neck flask. The mixture was heated to 100 °C for 1 h with vigorous stirring under vacuum, and then the temperature was raised to 300 °C under nitrogen flow. When the temperature reached to 300 °C, 6 ml of oleylamine was injected into the reaction flask, followed by injection of 8 ml of 1 M TOP-Se under nitrogen. The reaction flask was held at this temperature for 5 min followed by removal from the heat and cooling to room temperature using a water bath. The NCs obtained were re-dissolved in toluene and centrifuged to remove any insoluble species. Then the product was additionally precipitated by adding 10–20 ml ethanol and centrifuging. After washing three times with toluene–ethanol, the NPs were re-dispersed in toluene (6–7 ml).

2.3 Synthesis of Cu2S QDs

The synthesis of the Cu2S NCs involved the mixing of 1.25 mmol of ammonium diethyldithiocarbamate with 10 ml of dodecanethiol and 17 ml of oleic acid (OA) in a 3-neck flask. The solution was heated up to 110 °C under nitrogen flow, followed by a quick injection of a suspension mixture of 1 mmol of copper(II) acetylacetonate and 3 ml of oleic acid. Then, the solution was quickly heated to 180 °C and kept at this temperature for 10–20 min, followed by cool-down to room temperature. The reaction product was purified by three washing cycles of precipitation and re-dispersion, adding the anhydrous hexane and ethanol in a glove-box to avoid any possible oxidation of the NCs.

2.4 Preparation of photo-anode, electrolyte, and counter electrode

For the preparation of photo-anodes, the FTO substrates were sonicated for 10 min each in ultrasonic baths containing DI water, acetone, and 2-propanol. The cleaned FTO substrates were immersed in 40 mM TiCl4 at 70 °C for 30 min to deposit a thin TiO2 layer onto the FTO substrate. The mesoporous TiO2 films were deposited onto the TiO2 pastes on the FTO using the doctor-blading method, followed by calcination at 450 °C for 30 min. For the QD sensitization, the substrates (TiO2/FTO) were immersed in diluted CdSe NCs (4 mg ml−1) in toluene for 24 h, and then rinsed in anhydrous hexane. Finally, a passivation layer of ZnS was added to the CdSe/TiO2/FTO substrate. To this end, two SILAR cycles in ZnAc2 (0.03 M) and Na2S (0.03 M) were performed. The immersion time in each precursor was 1 min, followed by rinsing with DI water, and drying with a N2 gun.

The polysulfide electrolyte was prepared by dissolving Na2S (1 M) and S (1 M) in purified D.I. water without methanol. For the preparation of CE, Cu2S NC films were formed by drop-casting a solution of Cu2S NCs in a hexane–octane (∼9[thin space (1/6-em)]:[thin space (1/6-em)]1 vol) mixture onto FTO substrate. Closed-packed OA-capped Cu2S NC films were treated with 1,2-ethanediol (EDT) by dipping the counter electrode in 0.1 M EDT acetonitrile solution for 30 s.

2.5 Material characterization

Transmission electron microscopy (TEM) images were obtained using a Hitachi HF-3300 operating at an acceleration voltage of 300 keV. The FIB instrument is used for preparation of cross-section specimen of CE. Wide-angle, powder-X-ray-diffraction patterns were collected using an Empyrean HR-XRD with Cu Ka radiation source. The absorption spectra of the solutions and films were collected using a Cary 5000 UV-vis-NIR spectrophotometer. The transmittance and total reflectance of the thin-film samples were measured using a DRA 2500 diffuse reflectance accessory (integrating sphere).

Photoluminescence (PL) spectra were collected using a FluoroMax-4 spectrofluorometer (HORIBA Jobin Yvon). Dynamic light scattering (DLS) data were collected using a Zetasizer Nano-ZS (Malvern Instruments, UK). Fourier-transform infrared (FTIR) spectra were acquired in transmission mode using a Thermo Scientific spectrometer with a resolution of 0.09 cm−1 and averaging over 64 scans. For the FT-IR measurements, closed-packed Cu2S NCs were prepared on KBr crystal substrates using concentrated NC solutions. The Cu2S NC films were treated with 1,2-ethanediol (EDT) by dipping the counter electrode into 0.1 M EDT in acetonitrile for 30 s. Hereafter, OA-capped Cu2S NCs, 0.1 M EDT treated Cu2S CEs will be described as OA-, EDT-Cu2S CE, respectively.

All the samples were dried at 80 °C for 30 min. For quantitative comparison of different samples, the same mass-per-substrate area was deposited (about 5 mg cm−2) and the spectra were baseline-corrected.

2.6 Photo-electrochemical characterization

Photovoltaic current–voltage characteristics of CdSe QDSSCs were measured under 1 Sun illumination (100 mW cm−2, AM 1.5) verified by an AIST-calibrated Si-solar cell. The incident photon-to-current efficiency (IPCE) was obtained from the photocurrent ratio versus the rate of incident photons as a function of wavelength. Electrochemical experiments were carried out with a VSP potentiostat (BioLogic). A standard, three-electrode configuration was employed. Ag/AgCl and Pt wire served as reference and auxiliary electrodes, respectively. The active area of the CE was 0.09 cm2, which is same as that of the CE employed for photovoltaic measurement. The active area was controlled by selectively removing the Cu2S NC films from the FTO. The removed FTO surface was wrapped with insulating imide tape (3M) to prevent unwanted secondary reactions. The polysulfide electrolyte, made by dissolving 1 M Na2S and 1 M S in deionized water, was employed in all the electrochemical measurements. Cyclic voltammetry (CV) was performed from −0.4 to −1.0 V at a scan rate of 50 mV s−1. Electrochemical impedance spectroscopy (EIS) measurements were carried out at the equilibrium potential of the polysulfide over a frequency range from 100 kHz to 10 mHz, with amplitude of 5 mV.

3. Results and discussion

Fig. 1a represents the general configuration of the CdSe QDSSCs in this study. The cells were composed of a CdSe-NC sensitized photo-anode, a CE assembled from mono-dispersed Cu2S NCs, and polysulfide electrolyte, which is known to be the best shuttle for QDSSCs. Mono-dispersed colloidal OA-CdSe NCs were used to sensitize mesoporous TiO2 (Fig. 1b). Fig. 1c shows a TEM image of uniform CdSe NCs with an average diameter of 2.85 nm, with size distribution below 10%. In Fig. 1d, the CdSe NCs exhibit sharp excitonic features corresponding to the zinc-blend structure in the absorption spectra. They also show narrow photoluminescence associated with the recombination of photo-excited carriers from 1Sh and 1Se quantum-confined states, with full-width at half-maximum (FWHM) of ∼20 nm centered at 554 nm.
image file: c4ra09154j-f1.tif
Fig. 1 (a) Schematic diagram of QDSSC, (b) photographic image of colloidal CdSe NCs dispersed in toluene, (c) TEM image of as-synthesized CdSe NCs, (d) absorption and photoluminescence spectrum of colloidal CdSe NCs.

Fig. 2 shows a microstructure and optical properties of mono-dispersed Cu2S NCs. As shown in the TEM image in Fig. 2a, the as-synthesized Cu2S NCs were nearly spherical (average diameter 3.5 nm), which is consistent with the results obtained from DLS measurement, with size deviation below 10% (inset of Fig. 2a). Due to their enhanced surface-to-volume ratio, mono-dispersed Cu2S NCs provide the potential to improve catalytic activity in the interface between polysulfide electrolytes of CEs. The colloidal stability of the resulting solutions was also evidenced by dynamic light scattering (DLS) and in photographs of the colloidal Cu2S NCs solution (inset of Fig. 2a and c). Fig. 2b shows the representative XRD patterns of as-synthesized Cu2S NCs using the colloidal method. The corresponding peaks of the crystal planes of Cu2S NCs were indexed as shown in Fig. 2b, and matched the hexagonal phase chalcocite β-Cu2S (JCPDS card no. 46-1195, a = 3.97 Å, c = 6.8 Å).33 Fig. 2c shows the absorption spectrum of Cu2S NC films assembled on glass substrate. The UV-vis absorption spectra show a steep rise at short wavelengths, a low intensity onset extending up to ∼1000 nm, and negligible NIR extinction. Recently several groups reported enhanced surface plasmonic effects in stoichiometric copper chalcogenide, which is prone to oxidation to form more thermodynamically stable nonstoichiometric copper chalcogenide phases containing both Cu+ and Cu2+ ions.34,35 The extinction spectra of copper chalcogenide shows drastic enhancement of the NIR band in the NCs, with increasing oxidation time. The oxidation of NCs may inhibit the charge transport and catalytic activity in the CE, so the oxidation of NCs has to be restrained. In this experiment, as-deposited Cu2S-NC films did not show a pronounced NIR band even after several days of exposure to ambient air. These results imply that CE assembled from Cu2S NCs can suppress the formation of an oxidation layer on the electrode. This makes them ideal candidates for long-term stability and good catalytic activity. Fig. 2c (inset) shows a photograph of the colloidal Cu2S inks (25 mg ml−1) in toluene used to deposit the CE films. Fig. 2d shows the cross-section TEM image of closed-packed EDT-Cu2S CE assembled on FTO substrate. We confirmed that a substantially uniform Cu2S nanoparticles were assembled on FTO substrate without degradation after EDT treatment.


image file: c4ra09154j-f2.tif
Fig. 2 (a) TEM image of as-synthesized Cu2S NCs. The inset shows the average size distribution of Cu2S NCs based on dynamic light scattering (DLS). (b) XRD patterns of Cu2S films: the blue line is JCPDS 90-020-0988 (hexagonal, P63/mmc space group). (c) Absorption spectra of the Cu2S NCs. The inset shows an image of colloidal Cu2S NCs dispersed in toluene. (d) Cross-section TEM image of closed-packed EDT-Cu2S CE assembled on the FTO substrate.

In general, the surface ligands used for synthesis of NCs are functionalized for high affinity to the NC surface, and stabilize colloidal solutions in nonpolar solvents. Bulky ligands, however, create a thick insulating barrier around each nanoparticles which can retard the facile-charge-transport in NC solids. To overcome this limitation, the original surface ligands have to be replaced with shorter molecular ligands.29,30 This approach provides the benefit of allowing convenient fabrication of high-quality NC films using colloidal solutions stabilized by original ligands, followed by soaking the NC film in a solution containing new capping ligands such as ethanethiol.29,30

Fig. 3 shows the current density–voltage (JV) curves of the CdSe QDSSCs using OA- and EDT-Cu2S NCs as the CE, under a standard simulated AM 1.5 illumination (100 mW cm−2). The corresponding detailed photovoltaic performances are summarized in Table 1.


image file: c4ra09154j-f3.tif
Fig. 3 (a) Photocurrent–voltage characteristics of CdSe QDSSCs with Cu2S CE (with EDT, OA-Cu2S), measured under AM 1.5 illumination (100 mW cm−2); (b) IPCE spectra of the CdSe QDSSCs using Cu2S CE (with EDT, OA-Cu2S).
Table 1 Photovoltaic properties of QDSSCs composed of different counter electrodes
Samples JSC (mA cm−2) Voc (V) FF η (%)
OA-Cu2S CE 5.99 0.45 51.57 1.4
EDT-Cu2S CE 7.95 0.48 54.44 2.1


It is noted that the CdSe QDSSCs employing different CEs exhibited quite different values of short-circuit current density (JSC), but showed similar values of open-circuit voltage (Voc). This is consistent with the expected influence of the CEs on QDSSC performance. The EDT-Cu2S CE based on the QDSSCs, had a short-circuit current density (JSC) of 7.95 mA cm−2, a fill factor (FF) of 55.44%, and yielded superior power conversion efficiency (η) of 2.1%. In contrast, the QDSSCs using OA-Cu2S CEs showed a much inferior device performance of 1.4% with JSC 5.99 mA cm−2 and FF 51.57. The enhanced photovoltaic performance of CdSe QDSSC with EDT-Cu2S CE is originated from the decreased inter-particle distances, resulting in improved electronic transport, and also from enhanced catalytic activity in the Cu2S-NC CE because of the cross-linking between shorter functional groups.29–32

Fig. 3b shows the IPCE spectra of the CdSe QDSSC obtained from OA- and EDT-Cu2S CEs. The IPCE spectra were defined as the number of electrons in the external circuit generated at a given wavelength, divided by the number of incident photons. The IPCE spectra resembled the absorption spectra of CdSe NCs (Fig. 1d), indicating that the IPCE results originated from the direct band-gap transition of the CdSe NCs. The IPCE values measured from 350 to 600 nm showed an order of OA-Cu2S < EDT-Cu2S CE, which is identical to that of the corresponding efficiency of the QDSSCs employing different CEs. The short-circuit photocurrents estimated from the integrated IPCE spectra of Fig. 3b are 4.3, 6.0 mA cm−2 for the OA-, EDT-Cu2S CE, respectively. The short-circuit photocurrents were smaller than the JSC values obtained from the JV measurements under one-sun (AM 1.5 G) illumination (Fig. 3a). The discrepancy could be due to light intensity lower than AM 1.5 G illumination, because of the lower efficiency of charge separation, and of collection, at lower illumination intensities.

Fig. 4 shows a representative FTIR spectra taken before and after ligand exchange with 0.1 M EDT for OA-Cu2S NCs, which indicate the strong absorption bands at 2800–3000 cm−1 arising from characteristic C–H stretching of the original long-hydrocarbon ligand.29,30 The peaks were completely diminished after the ligand exchange reaction with 0.1 M EDT in acetonitrile, confirming the almost complete removal of organic surfactants from the OA-Cu2S NC surface.


image file: c4ra09154j-f4.tif
Fig. 4 FT-IR spectra of OA-, EDT-Cu2S NCs annealed at 80 °C for 30 min.

Cyclic voltammetry (CV) was performed to compare the redox properties of OA-, EDT-Cu2S electrodes in 1 M Na2S/1 M S electrolyte. The EDT-Cu2S working electrode exhibited much higher current density than that of OA-Cu2S NCs. Also, the high redox current of EDT-Cu2S NCs was sustained for five cycles, in contrast to the rapid fading observed with OA-Cu2S NCs. This demonstrates the superior stability of the EDT-Cu2S CEs. To obtain better understanding of the interfacial-charge-transport behaviors of Cu2S-CEs EIS measurements were carried out (Fig. 5b). Each impedance plot shows two semi-circles at high (100 kHz to 100 Hz) and middle (100–1 Hz) frequency ranges, and an inclined line at the low-frequency end. The high-frequency semicircle is attributed to the charge-transfer reaction at the Cu2S/electrolyte interface, and the middle-frequency semicircle to the intra-electrode impedances such as between Cu2S NCs, or at the Cu2S/FTO interface.36 The charge-transfer resistance (Rct) at the Cu2S/electrolyte interface was extracted from the fitting data using an equivalent circuit (inset of Fig. 5b). The Rct value for EDT-Cu2S (0.23 Ω cm2) was much smaller than that of the OA-Cu2S (5.1 Ω cm2), indicating that EDT-Cu2S NCs have excellent charge transfer. The large Rct value for the OA-Cu2S CE can be attributed to the long alkyl ligands on the NC surface, which may alter the charge transfer rate. The electrochemical catalytic activity of CEs can be quantitatively assessed by the exchange current density (J0), which is equal to J0 = RT/nFRct,37,38 where R is the gas constant, T the absolute temperature in K, n the number of electrons involved in the electrochemical reaction, and F the Faraday constant. Assuming n = 2 from the reaction S22− + 2e = 2S2−, the J0 value of EDT-Cu2S CE would be 54.9 mA cm−2, which is much higher than 2.5 mA cm−2 for OA-Cu2S CEs. It is noted that J0 (54.9 mA cm−2) for EDT-Cu2S CE was higher than that of Cu2S/reduced graphene oxide composite (16 mA cm−2), which is calculated assuming that n = 1.36 These results are consistent with the higher JSC and FF obtained from EDT-Cu2S CE compared with OA-Cu2S CE. It seems very possible that the power conversion efficiency of QDSSC using EDT-Cu2S CE could be further improved by optimizing surface-modification conditions. This might be done, for example, by employing small molecular ligands or metal chalcogenide complexes (MCCs), an approach currently being investigated by our group.


image file: c4ra09154j-f5.tif
Fig. 5 (a) Cyclic voltammograms (CVs) of OA-, EDT-Cu2S NCs films measured in polysulfide (1 M Na2S/1 M S) solution, at a scan rate of 50 mV s−1. (b) Nyquist plots of OA-, EDT-Cu2S films measured at the equilibrium potential of the polysulfide. The experimental spectra are denoted with circles, and the best-fitted results using the equivalent circuit with solid lines.

4. Conclusions

We demonstrated the effects of surface modification of Cu2S CE assembled from colloidal-Cu2S NCs to evaluate the photovoltaic performance of CdSe. Our results showed that EDT-Cu2S CE based on the QDSSCs exhibited higher short-circuit current density (7.95 mA cm−2) and higher fill factor of 55.44%, yielding superior power conversion efficiency of 2.1%. The charge-transfer resistance at the Cu2S/electrolyte interface for EDT-Cu2S (0.23 Ω cm2) was much smaller than that of the OA-Cu2S CE (5.1 Ω cm2), indicating that EDT-Cu2S NCs have excellent catalytic activity. Furthermore, the EDT-Cu2S CE demonstrated superior long-term stability during the catalytic process.

Acknowledgements

This work was supported by the Leading Foreign Research Institute Recruitment Program (Grant no. 2012K1A4A3053565) through the National Research Foundation of Korea (NRF) funded by the Ministry of Education, Science and Technology (MEST) and the DGIST R&D Program of the Ministry of Science, ICT & Future Planning (14-BD-0401), and DGIST MIREBRAIN startup fund. H. Lee is also grateful for financial support from the IT R&D program of MOTIE/KEIT (10041856, Technology development for life improvement of high-Ni-composition cathode at high temperature).

References

  1. W. W. Yu, L. Qu, W. Guo and X. Peng, Chem. Mater., 2003, 15, 2854–2860 CrossRef CAS.
  2. P. Wang, S. M. Zakeeruddin, J. E. Moser, R. Humphry-Baker, P. Comte, V. Aranyos, A. Hagfeldt, M. K. Nazeeruddin and M. Grätzel, Adv. Mater., 2004, 16, 1806–1811 CrossRef CAS.
  3. P. V. Kamat, J. Phys. Chem. C, 2007, 111, 2834–2860 CAS.
  4. A. J. Nozik, M. C. Beard, J. M. Luther, M. Law, R. J. Ellingson and J. C. Johnson, Chem. Rev., 2010, 110, 6873–6890 CrossRef CAS PubMed.
  5. I. Hod, Z. Tachan, M. Shalom and A. Zaban, J. Phys. Chem. Lett., 2011, 2, 1032–1037 CrossRef CAS.
  6. S. Ruhle, M. Shalom and A. Zaban, ChemPhysChem, 2010, 11, 2290–2304 CrossRef PubMed.
  7. K. Tvrdy and P. V. Kamat, J. Phys. Chem. A, 2009, 113, 3765–3772 CrossRef CAS PubMed.
  8. I. Mora-Sero and J. Bisquert, J. Phys. Chem. Lett., 2010, 1, 3046–3052 CrossRef CAS.
  9. V. Gonzalez-Pedro, X. Xu, I. Mora-Sero and J. Bisquert, ACS Nano, 2010, 4, 5783–5790 CrossRef CAS PubMed.
  10. L. Liu, J. Hensel, R. C. Fitzmorris, Y. Li and J. Z. Zhang, J. Phys. Chem. Lett., 2010, 1, 155–160 CrossRef CAS.
  11. M. Graetzel, Nature, 2001, 414, 338 CrossRef PubMed.
  12. M. Liu, M. B. Johnston and H. J. Snaith, Nature, 2013, 501, 395–398 CrossRef CAS PubMed.
  13. P. Qin, S. Tanaka, S. Ito, N. Tetreault, K. Manabe, H. Nishino, M. K. Nazeeruddin and M. Grätzel, Nat. Commun., 2014, 5, 3834 Search PubMed.
  14. H. Katagiri, K. Jimbo, S. Yamada, T. Kamimura, W. S. Maw, T. Fukano, T. Ito and T. Motohiro, Appl. Phys. Express, 2008, 1, 041201 CrossRef.
  15. M. Shalom, I. Hod, Z. Tachan, S. Buhbut, S. Tirosh and A. Zaban, Energy Environ. Sci., 2011, 4, 1874–1878 CAS.
  16. M. Shalom, Z. Tachan, Y. Bouhadana, H. N. Barad and A. Zaban, J. Phys. Chem. Lett., 2011, 2, 1998–2003 CrossRef CAS.
  17. I. Hod, V. Gonzalez-Pedro, Z. Tachan, F. Fabregat-Santiago, I. Mora-Sero, J. Bisquert and A. Zaban, J. Phys. Chem. Lett., 2011, 2, 3032–3035 CrossRef CAS.
  18. Z. Tachan, M. Shalom, I. Hod, S. Ruhle, S. Tirosh and A. Zaban, J. Phys. Chem. C, 2011, 115, 6162–6166 CAS.
  19. Z. Yang, C. Y. Chen, C. W. Liu and H. T. Chang, Chem. Commun., 2010, 46, 5485–5487 RSC.
  20. G. Hodes, J. Manassen and D. Cahen, J. Electrochem. Soc., 1980, 127, 544–549 CrossRef CAS PubMed.
  21. Q. X. Zhang, Y. D. Zhang, S. Q. Huang, X. M. Huang, Y. H. Luo, Q. B. Meng and D. M. Li, Electrochem. Commun., 2010, 12, 327–330 CrossRef CAS PubMed.
  22. T. Loucka, J. Electroanal. Chem., 1972, 36, 355–367 CrossRef CAS.
  23. R. Muszynski, B. Seger and P. Kamat, J. Phys. Chem. C, 2008, 112, 5263–5266 CAS.
  24. K. Jasuja, J. Linn, S. Melton and V. Berry, J. Phys. Chem. Lett., 2010, 1, 1853–1860 CrossRef CAS.
  25. K. Vinodgopal, B. Neppolian, I. V. Lightcap, F. Grieser, M. Ashokkumar and P. V. Kamat, J. Phys. Chem. Lett., 2010, 1, 1987–1993 CrossRef CAS.
  26. H. Salaramoli, E. Maleki and Z. Shariatinia, J. Photochem. Photobiol., A, 2013, 271, 56–64 CrossRef CAS PubMed.
  27. D. V. Talapin, J.-S. Lee, M. V. Kovalenko and E. V. Shevchenko, Chem. Rev., 2010, 110, 389–458 CrossRef CAS PubMed.
  28. J.-S. Lee, M. V. Kovalenko, J. Huang, D. Chung and D. V. Talapin, Nat. Nanotechnol., 2011, 6, 348–352 CrossRef CAS PubMed.
  29. J. M. Luther, M. Law, Q. Song, C. L. Perkins, M. C. Beard and A. J. Nozik, ACS Nano, 2008, 2, 271–280 CrossRef CAS PubMed.
  30. M. Law, J. M. Luther, Q. Song, B. K. Hughes, C. L. Perkins and A. J. Nozik, J. Am. Chem. Soc., 2008, 130, 5974–5985 CrossRef CAS PubMed.
  31. O. E. Semonin, J. M. Luther, S. Choi, H. Y. Chen, J. Gao, A. J. Nozik and M. C. Beard, Science, 2011, 334, 1530–1533 CrossRef CAS PubMed.
  32. J.-S. Lee, M. I. Bodnarchuk, E. V. Schevchenko and D. V. Talapin, J. Am. Chem. Soc., 2010, 132, 6383–6391 Search PubMed.
  33. M. Deng, Q. Zhang, S. Huang, D. Li, Y. Luo, Q. Shen, T. Toyoda and Q. Meng, Nanoscale Res. Lett., 2010, 5, 986–990 CrossRef CAS PubMed.
  34. P. Afanasiev, J. Am. Chem. Soc., 2004, 126, 14678–14678 CrossRef CAS.
  35. V. Chakrapani, D. Baker and P. V. Kamat, J. Am. Chem. Soc., 2011, 133, 9607–9615 CrossRef CAS PubMed.
  36. J. G. Radich, R. Dwyer and P. V. Kamat, J. Phys. Chem. Lett., 2011, 2, 2453–2460 CrossRef CAS.
  37. M. Wang, A. M. Anghel, B. Marsan, N. L. Cevey Ha, N. Pootrakulchote, S. M. Zakeeruddin and M. Graetzel, J. Am. Chem. Soc., 2009, 131, 15976–15977 CrossRef CAS PubMed.
  38. A. J. Bard and L. R. Faulkner, Electrochemical methods: fundamentals and applications, Wiley, New York, 2nd edn, 2001, pp. 93–105 Search PubMed.

This journal is © The Royal Society of Chemistry 2014