Liquid–liquid phase separation and its effect on the crystallization in polylactic acid/poly(ethylene glycol) blends

Yafang Xu, Wei Yu* and Chixing Zhou
Advanced Rheology Institute, Department of Polymer Science and Engineering, Shanghai Jiao Tong University, Shanghai, P. R. China. E-mail: wyu@sjtu.edu.cn; Tel: +86-21-54743275

Received 20th August 2014 , Accepted 2nd October 2014

First published on 3rd October 2014


Abstract

The miscibility in blends of polylactic acid (PLA) and poly(ethylene glycol) (PEG) was investigated by means of differential scanning calorimetry (DSC), polarized optical microscopy (POM) and rheology using a specifically designed thermal procedure. The direct observation of a phase separated morphology using phase contrast optical microscopy, is difficult because of the quite close refractive indices of the two components. Liquid–liquid phase separation (LLPS) was confirmed by the appearance of two glass transitions after the samples have been annealed at low temperatures (95–125 °C). Moreover, the accelerated crystallization rate after the sample annealing at high temperatures (140–160 °C) also indicated the existence of LLPS, according to a fluctuation-assisted nucleation mechanism. An upper critical solution temperature (UCST) type of phase diagram was derived using the combination of DSC and rheological methods. Furthermore, the effects of LLPS on the kinetics of the subsequent crystallization of PLA in blends with 15 wt% PEG and 30 wt% PEG were investigated. Considering the complex effects of LLPS on the crystallization, we proposed a new model that integrates the Lauritzen–Hoffman theory and the self-concentration theory to account for the influence of miscibility on the crystallization in blends with different thermal histories. It is suggested that the effect of acceleration or deceleration of LLPS on the subsequent crystallization in a highly asymmetric system, depends on the interplay between the fluctuation-assisted nucleation and the variation of mobility during LLPS.

1. Introduction

In the last twenty years, biodegradable polymers have attracted much more attention due to the growing popular awareness of exhausted petroleum resources and the long degradation period of petroleum-based polymers. Polylactic acid (PLA) is one kind of aliphatic polyesters that can be made from renewable resources.1,2 However, some drawbacks like the slow crystallization rate, inherent brittleness and poor thermal resistance limit the wider application of PLA.1 It has been reported that these shortages can1 be overcome by adding nanoparticles3–6 and/or other components.7–12 Thereby, poly(ethylene glycol) (PEG) is one of the most studied modifiers of PLA, which can decrease the glass transition temperature, enhance elongation at break and accelerate crystallization.4,9,13–17 Generally, the physical properties of a blend strongly depend on the degree of miscibility and the crystallinity of the components. Earlier reports claimed that PLA/PEG blends could be completely miscible or partially miscible according to the number of glass transitions.13,15,16 This criterion was somewhat arbitrary as some later research revealed that two glass transitions could also be found in miscible blends with large dynamic asymmetry.18,19 Lai et al.9 reported that the blends, with PLA Mw = 200[thin space (1/6-em)]000 and PEG Mw = 2000, were thermodynamically miscible throughout the entire range of composition above the melting point of PLA, as they calculated a negative Flory–Huggins interaction parameter. In some cases, the intermolecular interaction plays an important role in the miscibility, the apparent hydrogen bonding in PLA/PEG blends can actually be neglected due to the absence of hydrogen bonding bands in the infrared spectra.20 Lai9 also claimed that hydrogen bonds are expected to form between the PEG chains themselves as they found a lower level compatibility in PLA/PEG (2-OH) than in PLA/PEG (2-CH3). Another related factor is the solubility parameter δ. The δ values of PLA and PEG are in the range of 9.5–9.8 meaning good compatibility, but it is not the decisive parameter of the phase behaviour especially in mixtures with significant differences in molecular structure and molecular weight.20 The large dynamic asymmetry between PLA and PEG (big difference in Tg) can generate quite different molecular dynamics at the same temperature, and this divergence of chain mobility enhances with the decrease in temperature. Actually, only a few studies reported on the phase behaviour of PLA/PEG blends. Hu et al.21 focused on the aging process and the phase separation at ambient temperatures. To date, the compatibility between PLA and PEG in the temperature region above the melting point of PEG are still not clear. Recently, the interplay between liquid–liquid phase separation and crystallization has received much more attention as it provides an efficient way to modulate the final phase morphology by controlling the level of phase separation and crystallization. Tanaka and Nishi22,23 investigated PCL/PS blends and found local liquid–liquid phase separation at the growth front of spherulites during crystallization. Han and co-workers have investigated the competition dynamics of LLPS and crystallization22–25 and the influence of LLPS on the subsequent crystallization.26 In turn, the crystallization kinetics can indicate the behaviour during LLPS. For example, Wang et al.27 constructed a phase diagram for HDPE/LLDPE blends by investigating the effect of LLPS on the following crystallization. They estimated a binodal curve by monitoring the crystallization kinetics and a spinodal curve from the crystal-decorated phase morphologies. Most recent research has considered the dynamic asymmetry of components in the liquid–liquid phase separation.28,29 In spite of these advances, the interpretations of the effect of LLPS on crystallization are mainly limited to more qualitative approaches,30–32 to better control blend morphology and structure, quantitative explanations are necessary.

In this paper, we will illustrate the liquid–liquid phase separation of PLA/PEG based on the effect of annealing on the variation of the glass transition temperature (at a low annealing temperature, Tanneal) and on the crystallization behaviour (at high Tanneal), from which a phase diagram is derived. Furthermore, we intend to provide a quantitative insight into the effect of liquid–liquid phase separation on the subsequent crystallization. Hoffman and Miller33 have introduced the concept of reptation to interpret the crystallization of entangled polymers, where the crystal growth rate was constrained by the mobility of the chain segments. The miscibility with a second component not only changes the activation energy of chain motion, but also greatly alters the absolute value of the monomer friction coefficient as illustrated by the self-concentration model.18 Therefore, we proposed a new model, which combines the Lauritzen–Hoffman model and the self-concentration model (LH–SC), to describe the crystallization kinetics in crystalline polymer-rich phases and/or miscible blends.

2. Experimental section

2.1. Materials and sample preparation

PLA used in this work is a NatureWorks® product 2002D. The semicrystalline grade resin comprises around 4% D-lactide and the monomer content is less than 0.3 wt%. It has a weight-average molecular weight of about 2.0 × 10⁵ g mol−1 and a polydispersity of 1.75.34 Polyethylene glycol (PEG) with a molecular weight of 104 g mol−1 was obtained from Sinopharm Chemical Reagent Co., Ltd, P. R. China. PLA and PEG were dried at 40 °C for 12 h under vacuum before mixing. Blends with different compositions were mixed in chloroform, and the weight fraction indicates the content of PEG. The solutions were cast on glass plates, the solvent was removed firstly by evaporation at ambient temperature for 3 days, and the residue was further dried in a vacuum oven at 40 °C until a constant weight was reached. It is noted that, if the preparation temperature is below the melting points of PLA and PEG, crystallization may take place. However, all tests in this work were carried out after eliminating the thermal history at 180 °C for 5 min. It is found that the glass transition behaviours (both the transition temperature and the width of transition) are identical for samples with different annealing times (5 min and 50 min) at 180 °C, which means 5 min is sufficient for the samples to become homogeneous.

2.2. Differential scanning calorimetry (DSC) analysis

DSC (TA Instruments Q2000) was used to measure the glass transition temperature and investigate the isothermal crystallization behaviour of the blends with different thermal histories. The effect of annealing on the glass transition was studied using procedure I (in Scheme 1). A part of the sample, about 5 mg, was heated to 180 °C and held at 180 °C for 5 min, then the temperature was decreased to the annealing temperature Tanneal (between 95 °C and 125 °C) and held at Tanneal for three hours, followed by a rapid decrease to −80 °C where the sample was kept for 5 min. The sample was finally heated to 180 °C with 10 °C min−1 to determine the glass transition temperature. For blends without annealing, the sample was quenched by decreasing the temperature from 180 °C directly to −80 °C. The glass transition temperature was detected in the following heating procedure. The effect of annealing on isothermal crystallization was studied using procedure II (in Scheme 1). The sample was annealed at 140 °C for 2 h. The subsequent crystallization temperature Tc was set between 90 and 110 °C. After completion of the crystallization, the sample was again heated to 180 °C to determine the melting point. For blends crystallized from the molten state, the sample was quenched directly to Tc, and then heated to 180 °C at 10 °C min−1.
image file: c4ra08985e-s1.tif
Scheme 1 Annealing and crystallization procedures of the PLA/PEG blends.

2.3. Polarizing optical microscopy (POM)

A polarizing optical microscope (Leica DM LP, Leica Microsystems GmbH, Germany) equipped with a hot stage (LK-600PH, Linkam, UK) was used to investigate the growth dynamics of the crystals. The sample was firstly cooled from 180 °C to Tanneal (140 °C), held for different times at Tanneal (0.5 h, 1 h and 2 h) and then decreased to Tc (120 °C) for isothermal crystallization. Crystallization of PLA was monitored isothermally using a Sony video camera at appropriate interval times and the growing radii of the crystals were measured using Scion Image software.

2.4. Rheological measurements

Dynamic rheological experiments were carried out on a Gemini 200HR rotational rheometer (Malvern Instruments, UK) with parallel plate geometry of 25 mm in diameter. Samples for the rheological measurement were obtained by compressing and molding of the prepared blends into about 1 mm thick sheets at 180 °C under 5 MPa. Two kinds of rheological measurements were performed. One consists of isothermal dynamic time sweeps after high-temperature annealing with a frequency of 1 rad s−1 and a strain of 1% to study the crystallization process. Thereby, the variation of the viscosity over time during the crystallization was obtained. The other one consists of isothermal frequency sweeps in the range of 1–100 rad s−1 under a given strain amplitude of 5%, which was in the linear viscoelastic regime as determined previously by strain sweeps. The temperature of the frequency sweeps ranged from 120 °C to 180 °C with 10 °C intervals, from which the temperature dependence of the zero shear viscosity was obtained. The total time for a dynamic frequency sweep was very short (several minutes) as compared to the process of crystallization and/or LLPS, so the blends can be reasonably considered as homogeneous during testing.

3. Results and discussion

3.1. Effect of annealing on glass transition

Fig. 1a shows the last heating runs of the 15 wt% blends after annealing at 95–125 °C for three hours (procedure I). The cold crystallization has disappeared and the melting enthalpies of PLA (in Table 1) are almost identical, which indicates that three hours is sufficient for PLA to complete crystallization. Of particular interest here is the change of glass transition. Only one glass transition is observed for the sample without annealing, while two distinct glass transitions can be clearly identified from the derivative heat flow curves of the annealed samples in Fig. 1b and c in the high temperature range and the low temperature range, respectively. In the high temperature range, there is a partial overlap of the glass transition of PLA and the melting process of PEG (Fig. 1a). The glass transition of the 15 wt% blend is at about 27–39 °C, and the melting point of PEG in the blend is above 50 °C, even so, they can be separated well in the derivative heat flow curves (Fig. 1b).
image file: c4ra08985e-f1.tif
Fig. 1 DSC heating curves for 15 wt% PEG after annealing at different temperatures for 3 hours (a) and derivative heat flow curves in the high temperature region (b) and the low temperature region (c).
Table 1 DSC data together with the corresponding average volume concentration of PEG in two phases
Tanneal (°C) ΔHm,PLA (J g−1) Tg,1 (°C) Tg,2 (°C) ϕPEG,1a (v%) ϕPEG,2a (v%)
a The average volume concentrations of PEG were calculated from the glass transition temperature using the self-concentration model.
No annealing 33.5 25.9 16.6
95 36.5 −61.1 31.9 88.0 11.2
105 36.5 −56.9 36.9 84.4 8.8
115 36.6 −56.1 38.0 82.3 7.9
125 36.9 −55.7 39.4 80.5 7.1


Two glass transition temperatures are usually found either in phase-separated or in miscible blends with large dynamic asymmetry.18 After annealing, the crystallization of PLA would make the PEG concentration increase if the amorphous domain is still miscible, which will reduce the glass transition temperature of PLA. This is inconsistent with the experimental observations. There are two possible reasons for the shift of the PLA’s Tg to higher temperatures. One is due to the liquid–liquid phase separation (LLPS) between PLA and PEG. LLPS results in a decrease in PEG concentration in the PLA-rich domains, which can lead to an increase in PLA’s Tg. The other possible reason is the formation of a so-called “rigid amorphous phase” (RAF) during the crystallization, which has a higher Tg than the “mobile amorphous phase” (MAF).35 The formation of a RAF always brings about a widening of the glass transition, while LLPS results in a narrowing of the glass transition. The width of the transition for the annealed sample is estimated to be about 16 K narrower than that obtained without annealing, which is estimated to be 20 K. In addition, the crystallization of PEG in the 15 wt% blend is difficult due to the low concentration. Even after the crystallization of PLA, the concentration of PEG in the amorphous phase is not sufficiently high (about 20 wt%) for crystallization if there is no LLPS. It is highly probable that the crystallization of PEG in the blend after annealing happens in the PEG-rich domains. This is consistent with the appearance of a second glass transition at lower temperatures (Fig. 1c), which is ascribed to the glass transition of the PEG-rich phase. All these phenomena support the assumption that LLPS takes place during annealing.

3.2. Dependence of glass transition on composition

From the above discussion, the liquid–liquid phase separation and the level of phase separation can be reflected by the variation of the glass transition. Since the glass transition is directly related to the blend composition, it is possible to evaluate the phase composition from the Tg-concentration dependence. Thermal diagrams of a set of blends directly quenched from 180 °C are measured and shown in Fig. 2. Due to the fast quenching, a possible liquid–liquid phase separation is prevented in the measurements. Only one Tg is observed, which decreased from 59 °C for pure PLA to 25 °C for the 15 wt% blend. In the blends with a PEG content higher than 70 wt%, only a weak and broad transition at very low temperatures was found. The glass transitions of the PEG-dominant blends in the low temperature range and of the PLA-dominant blends in the high temperature range can be seen more clearly in the insets. A glass transition temperature for pure PLA is hardly observed under our experimental conditions and reported in the literature as −67 °C.36
image file: c4ra08985e-f2.tif
Fig. 2 DSC traces for PLA/PEG blends with a heating scan rate of 10 °C min−1. Arrows are added to guide the eye for variation of the glass transition temperature with the composition.

The glass transition temperature as a function of the PEG content is shown in Fig. 3, where the PEG content denotes the volume fraction in the amorphous phase. Because the crystallization of PEG and PLA cannot be avoided even under fast cooling, the average concentration of PLA and PEG in the amorphous phase should be corrected by subtracting the fraction of crystallinity as follows,

 
image file: c4ra08985e-t1.tif(1)


image file: c4ra08985e-f3.tif
Fig. 3 Dependence of the glass transition temperature on the PEG content. The solid lines are fitting curves using the self-concentration model with ϕs,PLA = 0.23 and ϕs,PEG = 0.48.

The enthalpies of PEG melting in PEG-dominant blends as well as the PLA cold crystallization and melting in PLA-dominant blends, are summarized in Table 2, the corrected average volume concentrations of PEG are also listed. We adopt the self-concentration model of Lodge–McLeish18 to describe the glass transition temperature in the blends. The self-concentration model is based on the assumption that the local composition for monomers of type A is different from the average bulk composition, as the surrounding environment is enriched with component A due to chain connectivity. The effective local concentration ϕeff,i of component i can be calculated from the self-concentration ϕs and the bulk composition ϕ using

 
ϕeff,i = ϕs,i + (1 − ϕs,i)ϕi (2)

Table 2 Parameters of the heating scans of the DSC curves and the corrected PEG average volume concentrations
Sample (wt% PEG) ΔHcc,PLA (J g−1) ΔHm,PLA (J g−1) ΔHm,PEG (J g−1) Tg,PLA (°C) Tg,PEG (°C) ϕamPEGa (%)
a The referred ΔH0m,PLA is 93.7 J g−1,5 and ΔH0m,PEG is 220 J g−1.37 ρPEG is 1.128 g cm−3 and ρPLA is 1.27 g cm−3.
0 0.3 59.2 0
5 17.5 17.5 45.5 5.6
10 26.8 26.9 38.4 11.1
15 33.3 33.5 25.9 16.6
70 0.5 17.1 59.9 −49.9 77.9
80 7.9 90.0 −46.3 77.0
90 1.6 126.2 −55.2 79.7


Self-concentration is suggested to be the ratio between the self-volume occupied by the chain segments Vs and the reference volume Vref, i.e., ϕS = CM0/KρNAVVref, where C is the characteristic ratio of the polymer, K is the number of backbone bonds per polymer repeat unit, ρ is the polymer density, NAV is Avogadro’s number and M0 is the repeat unit molar mass. The choice of reference volume is a little arbitrary, and it is suggested to use the volume occupied by the Kuhn segment18 or to use it as a fitting parameter. The effective glass transition temperature (Tg,eff) of component i is related to its local concentration in a volume comparable to the size of its chain segments instead of the average bulk concentration. The Fox equation is suggested to correlate the effective concentration and the effective glass transition temperature:

 
image file: c4ra08985e-t2.tif(3)
where Tg,i and Tg,j are the glass transition temperatures for the pure components i and j, respectively. Such a model implies that two glass transitions can be observed even in miscible blends as long as a big difference exists in the components’ glass transition. Moreover, it also suggests that the change in the glass transition depends on the variation of the local environment of the chain segment, which is related to the miscibility of the components in the polymer blends. Eqn (2) and (3) are used to fit the glass transition temperature as shown in Fig. 3, where the self-concentrations of PLA and PEG are taken as the fitting parameters. The best fit gives ϕs = 0.23 for PLA and 0.48 for PEG, which are close to the theoretical calculations (0.2 for PLA and 0.36 for PEG). Using the fitted self-concentrations, we can calculate the mean concentration from the glass transition temperature and the results are shown in Table 1.

3.3. Effect of annealing on crystallization

To study the effect of annealing on the crystallization, the thermal history of procedure II in Scheme 1 is adopted. Fig. 4 shows the crystal radii of the 5 wt% and 15 wt% blends that were recorded at 120 °C after the samples have been annealed at 140 °C for different times. No crystals were observed using polarized optical microscopy, when annealed at 140 °C. The linear growth of the crystals is shown in Fig. 4. The slope gives the overall crystal growth rate, which is around 2.05 μm min−1 for all 5 wt% blends. For the 15 wt% blends, the growth rate increases with the previous annealing time, i.e., 6.36 μm min−1, 6.63 μm min−1 and 7.25 μm min−1 for 0 h, 1 h, and 2 h annealing, respectively. The acceleration in crystallization after annealing can be attributed to the LLPS.27,31 One explanation is that, in this case, the probability of crystallizable polymers adsorbing onto the crystal growth front is higher than that in the miscible blend, similar to the “poisoning” effect of diluents.38 The other one is ascribed to an increase in the nucleation rate in the concentration gradient region (or interface), where the diffusion-induced aligned segments may attach themselves to the interface and become nuclei or precursors of nuclei for crystallization.39
image file: c4ra08985e-f4.tif
Fig. 4 The time-dependence of crystal radius at 120 °C.

To elucidate the effect of annealing temperature on the subsequent crystallization, a rheological method was adopted due to its high sensitivity to crystallization. The variation of complex viscosity during the crystallization is monitored on a rotational rheometer by a dynamic time sweep. The lower limit of the annealing temperature should ensure no crystal generation and the upper limit should avoid thermal degradation. The whole process was carried out under quasi-quiescent conditions to avoid the influence from shear flow. Three blends of 15 wt%, 30 wt% and 50 wt% were investigated. Fig. 5a shows the variation of the normalized complex viscosity of the 15 wt% blend after annealing at 140 °C, 150 °C and 155 °C for different time periods. The monotonic increase in viscosity denotes that crystallization takes place. The time when the normalized complex viscosity becomes two, is taken as the onset of crystallization. The shorter the onset crystallization time, the faster the crystallization. It can be seen from Fig. 5a that the onset crystallization time decreases with the increase in annealing time at 140 °C and 150 °C. When the annealing temperature increases to 155 °C, the acceleration of the following crystallization almost disappears. A similar trend can be found for the 30 wt% blend (Fig. 5b). The vanished acceleration in crystallization at higher annealing temperatures signifies weaker LLPS and indicates a UCST-type of phase diagram.


image file: c4ra08985e-f5.tif
Fig. 5 The normalized complex viscosity as a function of time at Tc = 120 °C for samples with different thermal treatments. (a) The 15 wt% PEG blend has been annealed at 140 °C, 150 °C and 155 °C; (b) the 30 wt% PEG blend has been annealed at 150 °C, 155 °C and 160 °C.

3.4. Phase diagram

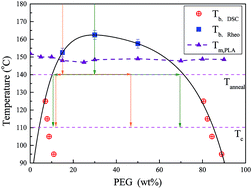
A phase diagram provides important information for partially miscible polymer blends. The phase boundary is usually obtained by measuring the discontinuity of some physical properties with the temperature, such as the cloud point or the transmittance temperature,40 the storage modulus of the bulk41 or the change of the heat flow.42 Since the two components in this work possess nearly identical refractive indices (RI,PLA = 1.44–1.46, RI,PEG = 1.46),1,36 it is difficult to detect their liquid–liquid phase separation temperatures via optical methods. In contrast, the crystallization of PLA is relatively easy to monitor using either optical microscopy or the rheology method. Moreover, in the presence of LLPS, the glass transition temperature and the kinetics of crystallization can be altered, which also provides indirect ways to infer the binodal boundaries of LLPS.

The phase diagram of a PEG/PLA blend is shown in Fig. 6, which is composed of two parts. At high annealing temperatures (above 140 °C), the liquid–liquid phase separation is the only phase transition. We identified the binodal point as the annealing temperature, above which the annealing treatment has no influence on the subsequent crystallization. The transition temperatures are 150–155 °C, 160–165 °C and 155–160 °C for the 15 wt%, 30 wt% and 50 wt% blends, respectively. Such a method to construct phase boundaries is based on the interplay between crystallization and phase separation. At low temperatures (95–125 °C), LLPS and crystallization can happen simultaneously, and the interplay between them determines the concentration distribution and morphology development. When the blend was annealed at low temperatures, the resulting crystallization and LLPS change the local concentration in the amorphous PLA-rich domains and the amorphous PEG-rich domains, which is revealed by a change in the glass transition. The mean concentrations in the different domains have been estimated using the self-concentration model as shown in Table 1, and they are taken as the approximated phase boundaries in Fig. 6. Such a phase boundary is probably not the first thermodynamic equilibrium, because the actual extent of LLPS depends on the competing crystallization. At 125 °C, the crystallization is slow and LLPS has sufficient time to develop in spite of the lower thermodynamic driving force. On the contrary, the crystallization under 95 °C is much faster, the system is quickly frozen and the development of the LLPS is limited. Therefore, it is expected that more deviation from the equilibrium would exist at lower temperatures.


image file: c4ra08985e-f6.tif
Fig. 6 Phase diagram for PLA/PEG determined using the rheology method and DSC. The solid line is the fitting curve using a polynomial equation. The arrows denote the evolution of concentration during the two-step quench procedures which will be discussed in section 3.5.

3.5. Effect of annealing on the kinetics of crystallization

In the blends with simultaneous LLPS and crystallization, it is interesting to identify specific variations in the crystallization kinetics due to the presence of the liquid–liquid phase separation. To this end, the crystallization behaviour of the 15 wt% and 30 wt% blends were studied using DSC and the thermal history in procedure II in Scheme 1. Fig. 7 shows a set of overall heat flow curves with time at different crystallization temperatures for samples with one-quench or two-quench treatment, where one-quench denotes that the sample is quenched directly from the melt (180 °C) to Tc, while two-quench denotes that the sample is firstly quenched from the melt to the annealing temperature (140 °C) for 2 h and then to the crystallization temperature.
image file: c4ra08985e-f7.tif
Fig. 7 Heat flow curves varying with time at different crystallization temperatures for (a) 15 wt% PEG and (b) 30 wt% PEG. The filled symbols are the samples directly quenched from the melt and the hollow symbols are the samples quenched firstly to 140 °C for 2 h and then quenched to Tc.

The crystallization rate is clearly displayed in the graph of the half-crystallization time t1/2 with Tc, as shown in Fig. 8. For the same thermal treatment, t1/2 becomes smaller as the temperature decreases, which is attributed to an enhancement of nucleation at low temperatures. Meanwhile, as compared with the one-quench procedure, t1/2 of the 15 wt% blend decreases obviously in the two-quench procedure, which is consistent with the previous POM and rheological results. For the 30 wt% blend, the effect of LLPS on crystallization is less obvious. At the same annealing temperature (140 °C), the thermodynamic driving force of LLPS is larger for the 30 wt% blend than for the 15 wt% blend due to the strong quenching. It is possible that the separated PLA-rich domains and PEG-rich domains in the 30 wt% blend have component concentrations that are much closer to the phase boundary when annealing for the same time (as indicated by arrows in Fig. 6). Therefore, the PLA-rich domains in the 30 wt% blend have a lower content of PEG and therefore a higher glass transition temperature, that is, a weaker chain mobility for the PLA crystallization. Both the effect of “fluctuation-assisted nucleation” and the chain mobility depend on the level of phase separation. For a comprehensive understanding of the crystallization, detailed analysis of the thermodynamic parameters is necessary.


image file: c4ra08985e-f8.tif
Fig. 8 Relationship of t1/2 with Tc for one-quench and two-quench procedures.

Actually, the effect of LLPS on the crystallization in the blends with different PEG contents and different thermal histories relies on both the transportation ability and the nucleation ability. According to the Lauritzen–Hoffman secondary nucleation theory,33 the growth rate of linear polymer crystals with the chain folding is expressed as:

 
image file: c4ra08985e-t3.tif(4)
where G0 is a pre-exponential term that contains all factors that do not strongly depend on the temperature, U* is the activation energy for the transportation of segments to the crystallization site, R is the universal gas constant, Tc is the crystallization temperature and T is the temperature at which all the motions associated with the viscous flow are frozen, defined as T = TgC, where C is a constant (30 K). ΔT is supercooling T0mTc, f is the correction factor which accounts for the change in the heat of fusion as the temperature is decreased below T0m. Kg is the nucleation rate given as Kg = nbσσeT0m/kΔH0m,33 where k is the Boltzmann constant, b is the thickness of the stem added to the substrate, σ is the lateral surface free energy, σe is the free energy of folding, ΔH0m is the enthalpy of fusion. In this theory, the growth rate G was governed by the energy required to transport segments across the solid–liquid interface and by the nucleation rate variations occurring at high degrees of undercooling. In the crystallization of homopolymers, both the activation energy and the surface free energy determine the kinetics. However, these parameters might change due to the presence of the second partially miscible component.

Due to the intrinsic differences in chain mobility between the components, the presence of PEG could alter the activation energy for the transportation of PLA. However, as both LLPS and the crystallization continuously vary the PEG concentration with time, it is difficult to determine the dynamic activation energy for the transportation during crystallization, but we can still estimate it based on the average concentration of PEG. At crystallization temperatures (approximately near and below Tg + 100 °C), the dependence of the activation energy on the temperature shifts from Arrhenius to ‘Vogel’ behaviour,33 where U* can be determined from the zero shear viscosity η0

 
image file: c4ra08985e-t4.tif(5)

Dynamic frequency sweeps at different temperatures (120–170 °C) were measured using a rheometer, and the zero shear viscosity is fitted using the Carreau–Yasuda model. Fig. 9 displays the variation of the zero shear viscosity with the reciprocal of the temperature for blends from 0 wt% to 30 wt%. A linear dependency between ln[thin space (1/6-em)]η0 and 1/T can be found, and the activation energy for the transportation of segments is determined from the slope according to eqn (5). The values are 109.8 kJ mol−1, 107.1 kJ mol−1, 83.5 kJ mol−1 and 80.0 kJ mol−1 for the PEG contents 0 wt%, 5 wt%, 15 wt% and 30 wt%, respectively. Although some of the experiments are investigated in the two-phase regime of the phase diagram (Fig. 6), the effect of LLPS can be ignored during the rheological measurements because the terminal relaxation is fast for all testing samples, and the dynamic frequency sweeps were done within several minutes. The results show that the activation energy for transportation does not change greatly for 15 wt% and 30 wt%. Therefore, it is expected that the variation of U*, due to the addition of PEG, is not the main cause for the difference in the crystallization.


image file: c4ra08985e-f9.tif
Fig. 9 Zero shear viscosities of PLA/PEG blends versus the reciprocal of the temperature, whose slopes are used to determine the activation energy for transportation.

Furthermore, the chain dynamics are important for crystallization and phase separation. Hoffman and Miller33 have conjoined the reptation theory and the surface nucleation theory to analyze crystallization, where the pre-exponential term in eqn (4) is inversely proportional to the monomeric friction coefficient ζ0, i.e., G0 = G0/ζ0. In the reptation theory, the monomeric friction coefficient determines the whole chain dynamics. Since the local dynamics of each component in a blend can be reflected by their distance from the glass transition temperature, it is suggested that the actual friction coefficient can be evaluated using the WLF equation with the effective glass transition temperature according to the self-concentration model,18

 
image file: c4ra08985e-t5.tif(6)
where cg1 and cg2 are constants, ζg,i denotes the friction coefficient at the glass transition temperature. It is important to notice that the self-concentration model considers the scale of the Kuhn segment length, which is different from the scale of the monomer. We assume here that the dynamics at both length scales have the same temperature dependence, and eqn (6) is also suitable for the monomeric friction coefficient. Combining the SC model for the monomeric friction and the L–H theory for secondary nucleation and growth, we have
 
image file: c4ra08985e-t6.tif(7)

The third term on the left hand side of eqn (7) represents the correction of the growth rate with the change of the chain dynamics. The nucleation rate Kg is obtained from the slope of the left side of eqn (7) with 1/fTcΔT. In this work, attention is paid to the PLA-rich domains as they are able to crystallize in our investigated temperature region. Thus, only the values of cg1 and cg2 of PLA need to be determined and they are supposed to be the same as those of pure PLA. The time–temperature superposition principle is established for pure PLA. Through fitting the temperature dependence of the horizontal shifting factor using the WLF equation, cg1 and cg2 are obtained as 19.3 and 48.4, respectively. Tg,eff,i(ϕ) is the effective glass transition temperature of a PLA-rich phase, which can be readily calculated if the composition of the PLA-rich phase after LLPS is known. As the extent of LLPS is not easy to determine, we make a crude approximation that the phase separation reaches the apparent binodal boundary (about 10 wt% PEG, referring to Fig. 6) in the two-quench process for both the 15 wt% and 30 wt% blends, while the PEG concentration in the one-quench process is as in the prepared composition. The plot of the LH–SC model (eqn (7)) is shown in Fig. 10, where the absolute value of the slope is used to determine Kg. It is seen that the nucleation constant Kg decreases from 1.6 × 10⁶ Pa2 in the one-quench process to 1.4 × 10⁶ Pa2 in the two-quench process for the 15 wt% blend. While, Kg of the 30% PEG blend changes very slightly. If the crystallization regime is not changed, we can suppose that the lateral surface free energy is also unchanged. Then, the free energy of folding in the 15 wt% PEG blend decreased about 13% in the two-quench test as compared to that of the one-quench one, while the change in the 30 wt% PEG blend is negligible. This result manifests directly the effect of fluctuation-assisted nucleation on the free energy of chain folding.


image file: c4ra08985e-f10.tif
Fig. 10 Plots of the LH–SC model for the PLA/PEG blends containing 15% and 30% PEG with different thermal histories. Solid lines denote the linear fit of the one-quench data, dashed lines denote the linear fit of the two-quench data.

Therefore, the apparent crystallization speed is an interplay between the mobility factor and the folding free energy. When the non-crystallizing component has a higher Tg, LLPS will cause a decrease in the effective Tg of the crystallizing polymer, which results in faster chain motion. Such an effect has the same positive contribution to the crystallization speed as the fluctuation-assisted nucleation, which decreases the folding free energy. In contrast, when the non-crystallizing component has a lower Tg, LLPS will cause an increase in the effective Tg of the crystallizing polymer, which slows down the chain motion. The apparent crystallization speed will be determined by the dominating factor, either the change of mobility or the change of folding free energy. Then it is possible that LLPS can result in either faster crystallization or slow crystallization. In most previous studies on the relationship between LLPS and crystallization using polyolefin blends, it was found that the dynamic asymmetry is not important and LLPS always induces faster crystallization. In the present study, although PLA/PEG is a typical dynamical asymmetric system, the decrease in chain mobility during phase separation is not significant enough to slow down the crystallization. The apparent crystallization after weak LLPS is still dominated by the fluctuation-assisted nucleation.

4. Conclusions

The liquid–liquid phase separation and its effect on the crystallization in blends of PLA/PEG were studied. Although most studies state that PLA and PEG are miscible, evidence is found here to justify liquid–liquid phase separation between the two components. One piece of evidence is the appearance of two glass transition temperatures after annealing at relatively low temperatures (95–125 °C), where the increased glass transition of PLA and the appearance of a glass transition for PEG suggest liquid–liquid phase separation during annealing. Quasi-equilibrium phase compositions are determined from the steady-state glass transition temperatures of the separated phases based on the dependence of the glass transition temperature on composition. The other evidence is the acceleration in crystallization after the samples have been annealed in the high temperature region (140–160 °C), and the lowest annealing temperature which has no effect on the subsequent crystallization is deemed as the binodal point of the investigated blend. Then, the phase diagram is constructed from the effect of annealing on Tg and the effect of annealing on the crystallization.

The effect of LLPS on the subsequent crystallization was studied with 15 wt% and 30 wt% blends. The isothermal half-crystallization time becomes smaller in the two-quench test of the 15 wt% blend, but changes little in the 30 wt% blend. The difference comes from the extent of LLPS, where both the concentration fluctuation and the chain dynamics affect the crystallization. We suggest combining the Lauritzen–Hoffman model with the self-concentration model to separate the effects of chain dynamics and concentration fluctuation. No obvious variation in the folding free energy of the 30 wt% blend was found in both situations, while the free energy of chain folding in the 15 wt% blend decreases about 13% in the two-quench test, which manifests quantitatively the effect of fluctuation-assisted nucleation by chain stretching in the interfacial region. The combination of the L–H model and the S-C model in partially miscible blends also implies a competition between fluctuation-assisted nucleation and LLPS induced mobility variation in blends with high dynamic asymmetry. It is possible that LLPS can accelerate or decelerate the apparent crystallization speed depending on the glass transition temperatures of the crystallizable component and the non-crystallizable component, while the deceleration effect still needs further experiments to justify this conclusion.

Acknowledgements

This work is supported by the National Natural Science Foundation of China (no. 50930002) and the National Basic Research Program of China (no. 2012CB025901). W. Yu is supported by the Program for New Century Excellent Talents in University and the SMC project of Shanghai Jiao Tong University.

References

  1. D. Garlotta, J. Polym. Environ., 2001, 9, 63–84 CrossRef CAS.
  2. K. Madhavan Nampoothiri, N. R. Nair and R. P. John, Bioresour. Technol., 2010, 101, 8493–8501 CrossRef CAS PubMed.
  3. L. Jiang, J. Zhang and M. P. Wolcott, Polymer, 2007, 48, 7632–7644 CrossRef CAS PubMed.
  4. H. Li and M. A. Huneault, Polymer, 2007, 48, 6855–6866 CrossRef CAS PubMed.
  5. R. Liao, B. Yang, W. Yu and C. Zhou, J. Appl. Polym. Sci., 2007, 104, 310–317 CrossRef CAS.
  6. J. You, W. Yu and C. Zhou, Ind. Eng. Chem. Res., 2014, 53, 1097–1107 CrossRef CAS.
  7. L. Zhang, C. Xiong and X. Deng, Polymer, 1996, 37, 235–241 CrossRef CAS.
  8. O. Martin and L. Avérous, Polymer, 2001, 42, 6209–6219 CrossRef CAS.
  9. W.-C. Lai, W.-B. Liau and T.-T. Lin, Polymer, 2004, 45, 3073–3080 CrossRef CAS PubMed.
  10. E. Piorkowska, Z. Kulinski, A. Galeski and R. Masirek, Polymer, 2006, 47, 7178–7188 CrossRef CAS PubMed.
  11. C. Liu, S. Lin, C. Zhou and W. Yu, Polymer, 2013, 54, 310–319 CrossRef CAS PubMed.
  12. J. You, L. Lou, W. Yu and C. Zhou, J. Appl. Polym. Sci., 2013, 129, 1959–1970 CrossRef CAS.
  13. C. Nakafuku and M. Sakoda, Polym. J., 1993, 25, 909–917 CrossRef CAS.
  14. C. Nakafuku, Polym. J., 1996, 28, 568–575 CrossRef CAS.
  15. M. Sheth, R. A. Kumar, V. Davé, R. A. Gross and S. P. McCarthy, J. Appl. Polym. Sci., 1997, 66, 1495–1505 CrossRef CAS.
  16. J. M. Yang, H. L. Chen, J. W. You and J. C. Hwang, Polym. J., 1997, 29, 657–662 CrossRef CAS.
  17. Z. Kulinski and E. Piorkowska, Polymer, 2005, 46, 10290–10300 CrossRef CAS PubMed.
  18. T. P. Lodge and T. C. B. McLeish, Macromolecules, 2000, 33, 5278–5284 CrossRef CAS.
  19. A. N. Gaikwad, E. R. Wood, T. Ngai and T. P. Lodge, Macromolecules, 2008, 41, 2502–2508 CrossRef CAS.
  20. H. Younes and D. Cohn, Eur. Polym. J., 1988, 24, 765–773 CrossRef CAS.
  21. Y. Hu, Y. S. Hu, V. Topolkaraev, A. Hiltner and E. Baer, Polymer, 2003, 44, 5711–5720 CrossRef CAS.
  22. H. Tanaka and T. Nishi, Phys. Rev. Lett., 1985, 55, 1102 CrossRef CAS.
  23. H. Tanaka and T. Nishi, Phys. Rev. A, 1989, 39, 783 CrossRef CAS.
  24. H. Wang, K. Shimizu, H. Kim, E. K. Hobbie, Z.-G. Wang and C. C. Han, J. Chem. Phys., 2002, 116, 7311 CrossRef CAS PubMed.
  25. W. Shi and C. C. Han, Macromolecules, 2011, 45, 336–346 CrossRef.
  26. X. Zhang, Z. Wang, X. Dong, D. Wang and C. C. Han, J. Chem. Phys., 2006, 125, 024907–024910 CrossRef PubMed.
  27. S. Wang, C. Wu, M.-Q. Ren, R. M. Van Horn, M. J. Graham, C. C. Han, E. Chen and S. Z. D. Cheng, Polymer, 2009, 50, 1025–1033 CrossRef CAS PubMed.
  28. W. Yu, R. Li and C. Zhou, Polymer, 2011, 52, 2693–2700 CrossRef CAS PubMed.
  29. W. Yu and C. Zhou, Polymer, 2012, 53, 881–890 CrossRef CAS PubMed.
  30. S. Wook Lim, K. Hee Lee and C. Hyung Lee, Polymer, 1999, 40, 2837–2844 CrossRef.
  31. J. Luo, Y. Liang, J. Yang, H. Niu, J.-Y. Dong and C. C. Han, Polymer, 2012, 53, 2465–2475 CrossRef CAS PubMed.
  32. Z. He, Y. Liang, P. Wang and C. C. Han, Polymer, 2013, 54, 2355–2363 Search PubMed.
  33. J. D. Hoffman and R. L. Miller, Polymer, 1997, 38, 3151–3212 Search PubMed.
  34. J. Liu, L. Lou, W. Yu, R. Liao, R. Li and C. Zhou, Polymer, 2010, 51, 5186–5197 CrossRef CAS PubMed.
  35. B. Wunderlich, Prog. Polym. Sci., 2003, 28, 383–450 CrossRef CAS.
  36. J. E. Mark, Polymer Data Handbook, Oxford University Press, 1999 Search PubMed.
  37. K. Pielichowski and K. Flejtuch, Polym. Adv. Technol., 2002, 13, 690–696 CrossRef CAS.
  38. S. Z. D. Cheng, Phase Transitions in Polymers: The Role of Metastable States, Elsevier, 2008 Search PubMed.
  39. X. Zhang, Z. Wang, R. Zhang and C. C. Han, Macromolecules, 2006, 39, 9285–9290 Search PubMed.
  40. C. Huang, J. Gao, W. Yu and C. Zhou, Macromolecules, 2012, 45, 8420–8429 Search PubMed.
  41. R. Li, W. Yu and C. Zhou, J. Macromol. Sci., Part B: Phys., 2007, 46, 1051–1062 CrossRef CAS.
  42. P. Van de Witte, A. Boorsma, H. Esselbrugge, P. J. Dijkstra, J. W. A. van den Berg and J. Feijen, Macromolecules, 1996, 29, 212–219 CrossRef CAS.

This journal is © The Royal Society of Chemistry 2014
Click here to see how this site uses Cookies. View our privacy policy here.