DOI:
10.1039/C4RA08862J
(Paper)
RSC Adv., 2014,
4, 62737-62745
Impact of the degree of functionalization of graphene oxide on the electrochemical charge storage property and metal ion adsorption†
Received
18th August 2014
, Accepted 14th November 2014
First published on 14th November 2014
Abstract
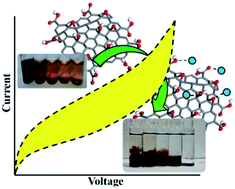
Graphene oxide (GO) samples were prepared at room temperature using a modified Hummer's method. The quantitative variation of oxidizing agent for the oxidation of graphene sheets resulted in increase of the oxygen functionalities on the GO samples. The qualitative analysis of functional groups and surface charge variation were studied using Fourier transform infra-red (FTIR) spectroscopy and zeta potential, respectively. Different oxidation degrees of GO were investigated by X-ray diffraction (XRD), Raman and X-ray photoelectron spectroscopy (XPS). The electrochemical charge storage properties of the GO samples were studied using a two electrode supercapacitor cell. The fabricated supercapacitor demonstrates linear enhancement in the specific charge storage with an increase in the oxidation of the GO samples. A maximum charge storage of 71 F g−1 has been obtained with the highly oxidized GO sample at room temperature. The adsorption of metal ions from aqueous solution has also been studied with the variation in the degree of functionalization of the GO samples. It was observed that increasing oxygen functionalities from GO-1 to GO-5 amplifies the uptake of metal ions [Cd(II) and Cu(II)]. The experimental data fits well with the Langmuir adsorption model, indicating monolayer adsorption of metal ion on the GO samples.
1. Introduction
Graphene has attracted great interest worldwide for its excellent mechanical, electrical, thermal and optical properties. The remarkable properties of graphene reported so far include high Young's modulus value (∼1100 GPa), fracture strength (125 GPa), thermal conductivity (∼5000 W m−1 K−1) and specific surface area (2630 m2 g−1).1 Many techniques have been developed recently for the production of graphene, such as micro-mechanical exfoliation of highly ordered pyrolytic graphite, epitaxial growth, chemical vapor deposition and the reduction of graphene oxide (GO).2 GO is an atomic sheet of graphite containing several oxygenated functional groups on its basal planes and edges, owing to the mixing of sp2 and sp3 hybridized carbon atoms.3 GO has many applications in various fields such as photocatalysis, memory devices, energy storage and drug delivery agents.4–7 The two amazing characteristics of GO are that firstly, it can be produced using inexpensive graphite as raw material by cost-effective chemical methods in high yields, and secondly, it is highly hydrophilic and forms stable aqueous colloids which facilitate the assembly of macroscopic structures. Both these properties are important for large-scale use of graphene oxide.
Three major methods have been used for the synthesis of GO. Pioneering work in this area was done by Brodie for ascertaining carbon atomic weight of graphite.8 Later Hummer9 and Staudenmaier10 developed popular methods with improved experimental safety and reduced formation of toxic gases. Since then, oxidation of graphite has not been paid much attention until recently, when GO was realized as a promising potential route for the large scale production of graphene.11 There are few reports in the literature focusing on optimizing the degree to which graphite should be oxidized for its efficient exfoliation to single layers of GO.12 The oxidation mechanism of GO and their structures are still indefinable due to its nonstoichiometry and strong hygroscopic nature. Szabó et al., studied in detail the evolution of surface functional groups in a series of progressively oxidized GO by the Brodie method.13 The model proposed that GO, exhibited a carbon network comprising of two regions: trans-linked cyclohexane chairs and ribbons of flat hexagons with C
C double bonds decorated with functional groups.13 The aromatic structure of graphite was completely destroyed by the oxidation using Brodie method. Therefore, Hummers method has been found to be more apposite for preparing GO. Lerf et al., had proposed a model for GO consisting of two kinds of regions: aromatic regions with unoxidized benzene rings and regions with aliphatic six-membered rings.14 The comparative area of the two regions depends on the degree of oxidation, with hydroxyl and epoxy groups located on the interior of GO and carboxyl (COOH) groups at the edges of sheets.14 Wilson et al.15 found that the latter model was consistent with their experimental observations. However, the influence of layer spacing on the exfoliation of GO sheets was not discussed in their report. It is known that the functional groups and heteroatoms on the carbon sheets improve the wettability of GO electrode due to increased number of hydrophilic polar sites and thus enhance the over-all charge storage capacitance of the electrodes.16 Graphite and graphene possess sp2 hybrid carbon atoms which are partially degraded to sp2–sp3 hybrid atoms in GO. Because of the lesser π–π stacking stability and poor conductivity, GO was theoretically claimed to be inappropriate electrode material for supercapacitors.17 However, Xu et al.18 reported that the GO, which is an intermediate during graphene synthesis, exhibits higher capacitance than graphene due to an additional pseudo-capacitance effect of the attached oxygen-containing functional groups on its basal planes. Taking into consideration its lower cost and shorter processing time, GO may become a better choice than graphene as the electrode material for supercapacitors.18 Further, the presence of the negative charged oxygenated functional groups and the aromatic network influences the adsorptive behavior of GO.19 It is also known as a potential adsorbent for the removal of organics such as methylene blue, methyl violet, orange G, malachite green, methyl green, acridine, phenols19–22 and inorganic contaminants viz.; Zn(II), Cu(II), Cd(II), Pb(II), Co(II), Eu(III), U(IV), Au(III), Pd(II), Pt(IV) etc. from aqueous solutions.23–28
In the present study, we have focused on introducing varying scale of oxygenated functional groups on the GO surface. We used the modified Hummers method to synthesize GO at 300 K.31 Different degrees of oxidation of graphite were achieved by altering the dosage of oxidizing agent (KMnO4) during the synthesis. In total, five GO samples were synthesized and labeled as GO-1, GO-2, GO-3, GO-4 and GO-5, respectively in the order of increasing the level of oxidation. All the samples were characterized in detail for degree of oxidation, surface properties, interlayer spacing and zeta potential. The effect of degree of oxidation on the charge storage property of GO was evaluated using electrochemical two electrode cyclic voltammetric and galvanostatic charge–discharge method.
As Cu and Cd are few of the major pollutants in the marine and waste stream coming from mining operations, textile, electrochemical, and petrochemical industries.29 These non-biodegradable, persistence pollutant effects the water bodies and accumulate in the environmental elements viz. food cycle, which may significantly endanger human health.29,30 Hence, adsorption extent of metal ions, Cu(II) and Cd(II) on GO (1–5) samples at different pH (2 and 4) were also studied in detail using GO samples.
2. Materials and characterization
2.1. Materials
Potassium permanganate (KMnO4) (99%), cadmium chloride (CdCl2) (99%) and copper chloride (CuCl2) (99%) were used as received from Sigma Aldrich Pvt. Ltd., Mumbai. Graphite powder of 99% purity and standard solution of cadmium and copper for ICP-AES was obtained from Alfa Aesar Pvt. Ltd. Sulfuric acid (H2SO4) (98%) and hydrochloric acid (36%) were obtained from S.D. Fine Chemicals. De-ionized (DI) water obtained from Millipore, was used for all the experiments.
2.2. Characterization
FTIR spectra of the GO samples were carried out using Bruker-VERTEX 80v FTIR spectrophotometer in transmittance mode with 128 scan using the KBr pellet method with resolution of 1 cm−1. XRD spectra of the samples were recorded in a wide angle range (2θ = 5° to 80°) on D8-Adavance Bruker X-ray Diffractometer, with scanning speed of 0.016 s per step, using monochromatized CuKα radiation of wavelength 1.54 Å. Malvern zetasizer nano ZS90 was used to measure the zeta potential of the GO samples. The Raman spectra of GO sample were recorded in the range 1000 to 4000 cm−1 at an ambient temperature (303 K) with a Horiba HR 800 model equipped with laser excitation wavelength 514.5 nm, spot size 1 μm and incident power ∼10 mW. X-ray photoelectron spectroscopy (XPS) of GO sample were carried out on AXIS ULTRA, AXIS 165, equipped with integrates the Kratos patented magnetic immersion lens, charge neutralisation system with new spherical mirror analyser and Al Kα X-rays as the source (hυ = 1486.6 eV). The electrochemical impedance measurements for GO samples were measured at normal temperature and pressure (NTP) conditions on LCR (Wayne Kerr 6500B, Chichester, West Sussex, UK) within the frequency range of 20 Hz to 20 MHz and bias potential of 1 V.
2.3. Inductive coupled plasma-atomic emission spectroscopy (ICP-AES)
Metal ion (Cd(II) and Cu(II)) concentrations, before and after adsorption were analyzed by ICP-AES Arcos M/s. Spectro, Germany. The working parameters of charge coupled device (CCD) and the radio frequency generator maximum were 1.6 kW, 27.12 MHz. For injection of samples into the plasma, the pump speed was maintained at 30 rpm. The flow rate of argon was maintained at 1, 0.8, and 12 dm3 min−1 for auxiliary gas, the nebulizer gas, and plasma generation respectively.
3. Experimental details
3.1. Synthesis of graphene oxide
The suspension of exfoliated graphite (Ex-G) (200 mg) particles were prepared in conc. H2SO4 (100 cm3), followed by the slow addition of oxidizing agent (KMnO4) and kept for 3 h under continuous stirring.31 The reaction mixture was diluted with 100 cm3 DI water and subsequently stirred for 24 h. The reaction mass was further treated with 600 cm3 of water, followed by the addition of 30% H2O2 solution (20 cm3), which acts as the bleaching agent. The resulting mixture was then centrifuged and the solid residue obtained was sonicated in 7 N HCl (100 cm3) for the removal of MnO2 impurities. The GO thus obtained was washed thoroughly with DI water till neutral pH was obtained. The samples prepared were labelled as GO-1, GO-2, GO-3, GO-4 and GO-5 corresponding to the quantitative variation of KMnO4 dosage as 0.2, 0.6, 1.0, 1.4 and 1.8 g, respectively. GO suspensions obtained in DI water has been pictorially shown in Fig. S1 of ESI.†
3.2. Electrode fabrication and electrochemical measurements
The aqueous GO suspension was prepared by sonicating the sample for 30 mins. The electrode for capacitor was prepared by dropcasting the GO suspension on 1 cm (diameter) circular graphitized carbon paper followed by drying at 303 K for 24 h and further use in Teflon swagelok cell with stainless steel current collector.32 The swagelok cell comprise of two electrodes that are isolated from electrical contact by a porous separator soaked in 0.5 M H2SO4. The electrochemical performance was examined on multichannel potentiostat and galvanostat using Metrohm, μAutolab type III electrochemical workstation. The cyclic voltammetry was carried out at the scan rate of 30 mV s−1 and galvanostatic charge/discharge at 1 A g−1 (current density) at an operating voltage window of 0–0.8 V.33
3.3. Metal ion adsorption from aqueous solutions
The batch adsorption equilibrium uptake of divalent Cu and Cd ions on GO was determined at pH 2 and pH 4. The GO samples (4 mg) were ultrasonicated in 10 cm3 of DI water and then mixed with 10 cm3 of metal ion solution. The pH of solution was adjusted by the addition of 0.1 M HCl and NaOH. The suspension was equilibrated for 24 h at 303 K. After equilibration, the GO particles were separated by centrifugation. The amount of metal ions adsorbed on GO was estimated from eqn (1)19,23| |
 | (1) |
where, C0 (mg dm−3) is initial metal ion concentration in aqueous solution and the Ce (mg dm−3) is equilibrium liquid phase metal ion concentration, V is the volume of the suspension, and m is the mass of GO used for the adsorption. For the isotherm studies, the metal ion (Cd and Cu) were varied from 10 to 200 mg dm−3 at pH = 4 as both the metal ions exist as divalent positive ions at this pH.19,23
4. Results and discussion
4.1. X-ray diffraction analysis
The XRD patterns provide information on the contents of oxidized GO part and non-oxidized graphite part in the sample.19 The XRD spectra (Fig. 1) of the synthesized GO samples shows significant change in the crystallinity of GO at different degrees of oxidation. The starting material graphite shows a highly intense peak at 26° corresponding to (002) reflection from hexagonal carbon structure. The sample GO-1 shows two peaks which is characteristic of the ordered (002) hexagonal graphitic planes (2θ = 26°) and (001) reflections at 2θ = 11.10° corresponding to defected hexagonal graphitic structure due to the insertion of oxygenated functional group on the oxidized graphitic surface.19,34–40 Further, with an increase in oxidation from GO-2 to GO-5 the peak at 26° disappears and simultaneously we get a single peak in the range of 10–12°. This reveals that large number of oxygen-containing groups have been introduced on GO sheet.19 The addition of oxygenated functional groups (–OH, C–O–C, C
O) on graphite lattice, shifts (001) reflections to lower 2θ value of 11.10, 11.0, 10.82, 10.52 and 10.34 for the samples GO-1 to GO-5 compared to 26° for graphite. This also increases the interlayer spacing (Bragg's equation) of graphite sheets from 0.34 nm in case of graphite to 0.79, 0.8, 0.82, 0.84 and 0.85 for GO-1, GO-2, GO-3, GO-4 and GO-5 samples, respectively (Fig. S2, ESI†). The interlayer spacing of all GO samples is more than ∼2.4 times higher than pristine graphite (0.34 nm), which is well in agreement with reported literature.19
 |
| | Fig. 1 XRD patterns of GO samples. | |
4.2. Raman spectroscopy analysis
Raman spectra (Fig. 2) of all GO samples shows two characteristic peaks viz. D band at ∼1340 cm−1 and G band at ∼1590. It is known that the G band indicates the first-order scattering of the E2g mode related to sp2 hybridized C atoms while the D band designates the A1g symmetry mode signifying the generation of defects in the graphite material (such as bond-angle and bond-length distortions, vacancies, edges etc.) due to the conversion of sp2-hybridized carbon to sp3-hybridized carbon.19,40 Oxidation of graphite in GO-1 leads to the G band shift towards higher wavenumber (1592 cm−1) while the D band has a higher intensity, which can attributed to the formation of defects and disorder such as the presence of in-plane hetero-atoms, grain boundaries, aliphatic chain, etc. As the oxidation increases, the G band shifts towards a higher wavenumber, the maximum shift of 1599 cm−1 was observed for the highest oxidation level, GO-5 sample. This shift in G band is related to the formation of new sp3 C centers in the graphite lattice.40 The full width half maxima (FWHM) of the G band with increasing oxidation level was obtained as 75, 92, 131, 136, and 142 cm−1, for the samples GO-1, GO-2, GO-3, GO-4 and GO-5, respectively. Similarly, the intensity of D band also gets affected with the varying oxidation level in all GO samples. The D band intensity increases with increasing oxidation for (GO-1 to GO-2) while it becomes constant at higher oxidation level (GO-3 and GO-5). The FWHM of the D band linearly increase with increase in the oxidation levels representing that the oxidation process influences the in-plane sp2 domains of the graphite with defects.40,41 The intensity ratio of ID/IG bands is inversely relative to average aromatic cluster size in GO.19 Fig. S3 of ESI† shows non monotonous pattern of ID/IG ratio for the five samples, it increases for GO-1 and GO-2 (lower oxidation levels) and then decreases followed by saturation for higher level oxidized samples. The average aromatic cluster size was calculated by using eqn (2).40,42| | |
La = [(2.4 × 10⁻¹⁰)(λ)]/(ID/IG)
| (2) |
where, La is the average crystallite size of the sp2 domains, λ is the input laser energy, ID and IG are the intensity of the D and G bands, respectively. The La value of the precursor graphite was calculated to be 124.5 nm while for samples GO-1, GO-2, GO-3, GO-4 and GO-5, the calculated values are 16.14, 13.45, 14.13, 15.25, 15.85 nm, respectively. These results indicate that the average crystallite size decreases with oxidation, resulting in breaking of crystallites and the formation of defects, disorders, sp3 hybridization and changes in crystallinity. Further, La starts increasing for GO-3 sample and becomes almost constant (GO-4 and GO-5) at higher levels of oxidation. The decrease in ID/IG ratio and increase in the La values at higher oxidation levels is compensated by the increase in the FWHM of the G band.40 The above results are in well agreement with the previous investigations on the crystallite size of GO for different degrees of oxidation.40,43
 |
| | Fig. 2 Raman spectra of pure graphite, GO-1, GO-2, GO-3, GO-4 and GO-5. | |
Another significant feature in the Raman spectra of graphite is the presence of 2D (an overtone of the D band) and D + G band at ∼2680 cm−1 and ∼2945 cm−1, respectively.35,43 The 2D band is very sensitive to the stacking order of the graphite along the c-axis and hence is used to evaluate the structural parameters of the c-axis orientation.42 The intensity of the 2D and D + G band is smaller and broadens after oxidation. Decrease in the 2D band intensity is attributed to the breaking of the stacking order due to the harsh chemical oxidation reactions which results in the formation of different types of oxygenated functional groups at the basal plane and also at the edges.
4.3. X-ray photoelectron spectroscopic (XPS) analysis
XPS provides clear evidence of percentage and type of functional group attached to GO sheets (Fig. 3). The C1s peaks of the XPS spectra shows the main peak at 284.0 and 284.5 eV corresponding to the graphitic carbon, and other peak at 285.5 eV, 286.5 eV, 287.5 and 288.4 eV corresponding to C–O, C–O–C, C
O bonds in carbonyl and O–C
O in carboxylic and/or ester groups respectively.19,44 The consecutive increase in the intensity of epoxide (O–C–O) groups form GO-1 < GO-2 < GO-3 < GO-4 < GO-5 as compared to O–C
O and C–O was observed. The GO-5 shows ∼5 times higher amount of epoxy group as compare to GO-1. As the oxidation level is increased, total intensity of non-aromatic carbon increases with the corresponding lowering of aromatic carbon intensity. This above trends is in agreement with earlier report in GO by Krishnamoorthy et al.40
 |
| | Fig. 3 XPS spectrum of GO-1, GO-2, GO-3, GO-4 and GO-5 samples. | |
The integrated intensity of aromatic (Iaromatic carbon) and non-aromatic (Inon-aromatic carbon) carbon obtained from C1s XPS spectra and the integrated intensity of GO (IGO) and graphite (IGraphite) obtained from XRD spectra was further employed to calculate the oxidation degree of the GO series by using eqn (3).19
| |
 | (3) |
The degree of oxidation 21%, 52%, 58%, 62%, and 64% was calculated for GO-1, GO-2, GO-3, GO-4 and GO-5 samples respectively. It confirms increases in the degree of oxidation from GO-1 to GO-5. Yan et al.19 reported successive increment in degree of oxidation with increase in oxidant amount with maximum 58% of oxidation degree of GO. The Raman, XRD and XPS pattern confirms that increase in the oxidant dosage increases the degree of oxidation.
4.4. FTIR spectroscopic analysis
The FTIR spectra of the GO samples are shown in Fig. 4. The spectra show a band at 1573 cm−1 due to the presence of C–C stretching in the graphitic structure. The peak at 3416 cm−1 is attributed to the O–H stretching vibrations, which appears due to the presence of moisture or adsorbed water. The band at 1728 cm−1 corresponds to the stretching vibrations from C
O, 1620 cm−1 to skeletal vibrations from unoxidized graphitic domains and hydroxyl groups at GO, 1420 cm−1 corresponds to OH deformation peak, 1220 cm−1 corresponding to C–O stretching vibrations and 1052 cm−1 is attributed to C–O stretching vibrations.40,44,45 The presence of these peaks confirms the synthesis of functionalized graphene oxide sheets.40 The polar oxygen functional group renders hydrophilic character to GO and hence it can be easily dispersed in the polar solvents.
 |
| | Fig. 4 FTIR spectra of GO with different degrees of oxidation. | |
4.5. Zeta Potential
The zeta potential is a physical property exhibited by the particles in dispersion and is a vital parameter for characterizing the electrical properties of interfacial layers in dispersion. The zeta potential values of GO-1, GO-2, GO-3, GO-4 and GO-5 were measured to be −40, −43, −54, −58 and −61 mV respectively (Fig. S4, ESI†). The successive increment in the degree of oxidation, increases negatively charge oxygenated functional groups that are attached to the GO samples resulting in the linear increase of the zeta potential of the GO samples.40,46 These is in well correlation with XRD, Raman and XPS analysis. Hence, increment of the oxidant dosage increases degree of oxidation. As per the American Society for Testing and Materials (ASTM) standards, the zeta potential value for colloidal suspension ranging between 30 and 40 mV shows moderate stability. However, any value higher +40 mV or lower than −40 mV exhibits high stability.40 Hence, samples GO-1 to GO-5 show high stability in the form of aqueous suspension. Further, this negatively charged behavior of GO is related to both, the pseudocapacitive nature of electrode materials in supercapacitors46 and for the adsorption of metal ions on GO surface.
4.6. Morphological studies
The morphological changes due to the degree of oxidation in five GO samples were analyzed by TEM. Fig. 5 shows difference in the transparency of GO sheet, this may due to different number of GO sheet stacked in the structure. The GO-1 shows opaque or less transparent sheet as compare to rest of the GO samples, this may be due to multilayer of partially unoxidized GO sheet. As explained earlier by XRD, Raman and XPS, the percentage of functional group attached to GO sheet in GO-1 sample is minimum, which further restrict the exfoliation of multilayer GO sheet. As the oxidation increases more transparent, thin few layer GO sheets were observed indicating improvement in exfoliation of multilayer sheets, due to increment in oxygenated functional groups attached to the GO planes. This is well in co-ordination with the information obtained from XRD, XPS and Raman spectroscopy.19
 |
| | Fig. 5 TEM image of GO-1, GO-2, GO-3, GO-4 and GO-5 samples. | |
4.7. Electrochemical studies
The cyclic voltammetry of GO in Fig. 6a shows an elliptical curve, deviated from an ideal rectangular voltammogram indicating a faradaic reaction of electrolyte ions at the interface of the electrodes.47 This charge storage mechanism is a characteristic behavior of pseudocapacitors. The specific capacitance of GO samples were measured by galvanostatic charge/discharge curve shown in Fig. 6b. The charge–discharge curve was obtained at the constant current of 1 A g−1 and charge storage was calculated to be 17, 21, 36, 64 and 71 F g−1 for GO-1, GO-2, GO-3, GO-4 and GO-5 respectively (Fig. 6c). The increase in percentage of oxygenated functional group from GO-1 to GO-5 significantly increases the pseudo-capacitance. The presence of functional groups, defects and grain boundaries on the GO planes acts as effective redox centers for the charge storage reactions, due to weak interaction of electrolyte ions with the electrode interface.48 Enhancement in the charge storage was obtained with the cycles as shown in Fig. 6d. This enhancement is due to the better percolation of the electrolyte ions in the electrode material used, with increase in the number of cycles.49
 |
| | Fig. 6 (a) Cyclic voltammetry obtained at the scan rate of 30 mV s−1 (b) galvanostatic charge–discharge obtained at the constant current of 1 A g−1 (c) charge storage capacitance and (d) stability curves for GO-1, GO-2, GO-3, GO-4 and GO-5 samples. | |
The impedance spectra is a direct evidence to understand the behavior of material in actual operating conditions.32,49 Fig. S5 of ESI† shows the electrochemical impedance spectroscopy (EIS) data of five GO samples, which were analyzed by using a Nyquist plot containing imaginary (Z′′) and real component (Z′) of the impedance in the frequency range of 20 Hz–20 MHz.32 As seen from the spectra, the degree of oxidation and charge transfer resistance has direct linear co-relation. The diameter of semicircle curve at higher frequency region represents the ESR of the cell, which depends on the characteristic of the electrode material and ionic accessibility into the electrode material.50 The diameter of semicircle increase with the increase in degree of oxidation which is an indication of the enhanced ESR of the supercapacitor cell.49 It was also observed that the Warburg curve was missing which is attributed to the short ion diffusion path. It facilitate the efficient access of electrolyte ions to the surfaces of the electrodes (Fig. S5 of ESI†).51,52 Further detailed analysis and optimization of the degree of oxidation is required for commercial supercapacitor electrodes.
4.8. Adsorption of heavy metal ion
As discussed earlier, increase in the degree of oxidation increases the amount of functional groups (O–C
O, C
O, C–O, C–OH, C–O–C etc.) on the surface of GO. These functional groups present in GO assist in forming hydrogen bonding with water molecules leading to stable dispersion of carbon based GO. This dispersion further facilitates the adsorption of heavy metals from the aqueous solution.23,27 Fig. 7 and 8 shows, as the degree of oxidation increases from GO-1 to GO-5, the adsorption of metal ion viz., Cd(II) and Cu(II) on the surface of GO increases.
 |
| | Fig. 7 Adsorption of cadmium and copper ions on GO with different degree of oxidation at pH 2 & 4. | |
 |
| | Fig. 8 Adsorption isotherm for (a) copper ions and (b) cadmium ions on GO with different degree of oxidation at pH = 4. | |
It is well known that with the variation in the pH of the solution, metal ions in water solution may exist in various forms. For the current study, adsorption of these metal ions was performed at pH = 2 and 4. At pH = 4, more than 90% of Cd is present in its divalent cationic form, while >99% copper exists as Cu2+ ion form.23 Further, the pHpzc (point of zero charge) value of GO is 3.8–3.9. Therefore, at pH > 3.9 (pH > pHpzc), the electrostatic interactions between the metal ions and GO become stronger or positively charged divalent metal ions undergoes organo-metal ion complexation because the surface charge of GO is negative.23,27,53
Hence at pH = 4, GO-5 which contains maximum oxygen functionalities shows approximately three times higher adsorption for Cu(II) and 2.5 times higher adsorption for Cd(II) as compared to GO-1. Further, any decrease in the charge on the functional group or metal ion affects the adsorption pattern. Fig. 7 showed that adsorption of Cu(II) and Cd(II) ion at pH = 2 was less compared to that of pH = 4. This is attributed to the simultaneous presence of high H+ ions which result in protonation of oxygenated functional groups and also hinder the dissociation of COOH functional groups.23 At higher pH (pH > 6), Cu(II) and Cd(II) precipitated from the solution, so studies were restricted to pH = 4.
The isothermal batch equilibrium adsorption mechanism was understood, by fitting the experimental data into the linear form of with Langmuir isotherm, eqn (4).54
| | |
qe = qmaxKLCe/(1 + KLCe)
| (4) |
where,
qmax is the maximum metal ion adsorption capacity per unit weight of GO (mg g
−1),
Ce is metal ion concentration in aqueous phase at equilibrium (mg dm
−3).
KL represents the Langmuir adsorption constant. The Langmuir adsorption isotherms were obtained by fitting the adsorption equilibrium data to the isotherm model, as shown in
Fig. 8a & b for Cu and Cd ions, respectively. The Langmuir model shows the best fit, confirming monolayer adsorption of metal ion on to the surface of GO. It was also observed from the adsorption studies that Cu ions adsorb preferentially compared to Cd(
II) ions on the same adsorbent material. This agrees very well with the metal electronegativity values for Cu and Cd. The electronegativity is a contributing parameter in the metal ion uptake by graphene oxide sample.
23,55
5. Conclusion
The series of GO with different degree of oxidation have been successfully synthesized by altering the oxidant dose. The XRD, Raman, XPS and zeta potential analysis confirms successive increment in negatively charged oxygenated functional group on the GO surface with increase in oxidation level. As the percentage of oxygenated functional groups present on GO increases, it leads to enhancement in redox pseudocapacitive current, which further boost its charge storage capacity. The negatively charged GO sample exhibits stronger affinity to positively charge metal ion in water. The GO with higher degree of oxidation shows higher adsorption capacity following Langmuir adsorption pattern. The enormous amount of negatively charged functional group on surface of GO, it's good dispersion ability and strong affinity towards metal ion is an important aspect in field of extraction, separation and purification.
Acknowledgements
Authors would like to thank the Department of Science and Technology, Government of India (Dy. no. JS & FA/2163) University Grant Commission- SAP and UGC-Networking resource center for the financial support.
References
- S. Park and R. S. Ruoff, Nat. Nanotechnol., 2009, 4(4), 217 CrossRef CAS PubMed.
- J. H. Warner, F. Schaffel, M. Rummeli and A. Bachmatiuk, Graphene: Fundamentals and emergent applications, Elsevier, Newnes, 2012, ch. 4 Search PubMed.
- D. R. Dreyer, S. Park, C. W. Bielawski and R. S. Ruoff, Chem. Soc. Rev., 2010, 39(1), 228 RSC.
- S. Chen, J. Zhu, X. Wu, Q. Han and X. Wang, ACS Nano, 2010, 4(5), 2822 CrossRef CAS PubMed.
- U. Khan, P. May, A. O'Neill and J. N. Coleman, Carbon, 2010, 48(14), 4035 CrossRef CAS PubMed.
- K. Krishnamoorthy, R. Mohan and S. J. Kim, Appl. Phys. Lett., 2011, 98(24), 244101 CrossRef PubMed.
- G. Wang, X. Sun, C. Liu and J. Lian, Appl. Phys. Lett., 2011, 99(5), 053114 CrossRef PubMed.
- B. C. Brodie, Philos. Trans. R. Soc. London, 1859, 149, 249 CrossRef.
- W. S. Hummers Jr and R. E. Offeman, J. Am. Chem. Soc., 1958, 80(6), 1339 CrossRef.
- L. Staudenmaier, Ber. Dtsch. Chem. Ges., 1898, 31, 1481 CrossRef CAS.
- C. Y. Su, Y. Xu, W. Zhang, J. Zhao, A. Liu, X. Tang, C. H. Tsai, Y. Huang and L. J. Li, ACS Nano, 2010, 4(9), 5285 CrossRef CAS PubMed.
- G. Eda, J. Ball, C. Mattevi, M. Acik, L. Artiglia, G. Granozzi, Y. Chabal, T. D. Anthopoulos and M. Chhowalla, J. Mater. Chem., 2011, 21(30), 11217 RSC.
- T. Szabó, O. Berkesi, P. Forgó, K. Josepovits, Y. Sanakis, D. Petridis and I. Dékány, Chem. Mater., 2006, 18(11), 2740 CrossRef.
- A. Lerf, H. He, M. Forster and J. Klinowski, J. Phys. Chem. B, 1998, 102(23), 4477 CrossRef CAS.
- N. R. Wilson, P. A. Pandey, R. Beanland, R. J. Young, I. A. Kinloch, L. Gong, Z. Liu, K. Suenaga, J. P. Rourke and S. J. York, ACS Nano, 2009, 3(9), 2547–2556 CrossRef CAS PubMed.
- S. Shukla and S. Saxena, Appl. Phys. Lett., 2011, 98(7), 073104 CrossRef PubMed.
- Y. Wang, Z. Shi, Y. Huang, Y. Ma, C. Wang, M. Chen and Y. Chen, J. Phys. Chem. C, 2009, 113(30), 13103 CAS.
- B. Xu, S. Yue, Z. Sui, X. Zhang, S. Hou, G. Cao and Y. Yang, Energy Environ. Sci., 2011, 4(8), 2826 CAS.
- H. Yan, X. Tao, Z. Yang, K. Li, H. Yang, A. Li and R. Cheng, J. Hazard. Mater., 2014, 268, 191 CrossRef CAS PubMed.
- P. Sharma and M. R. Das, J. Chem. Eng. Data, 2013, 58(1), 151 CrossRef CAS.
- G. K. Ramesha, A. Vijaya Kumara, H. B. Muralidhara and S. Sampath, J. Colloid Interface Sci., 2011, 361(1), 270 CrossRef CAS PubMed.
- L. Sun, H. Yu and B. Fugetsu, J. Hazard. Mater., 2012, 203–204, 101 CrossRef CAS PubMed.
- R. Sitko, E. Turek, B. Zawisza, E. Malicka, E. Talik, J. Heimann, A. Gagor, B. Feist and R. Wrzalik, Dalton Trans., 2013, 42(16), 5682 RSC.
- G. Zhao, J. Li, X. Ren, C. Chen and X. Wang, Environ. Sci. Technol., 2011, 45(24), 10454 CrossRef CAS PubMed.
- F. Zhang, B. Wang, S. He and R. Man, J. Chem. Eng. Data, 2014, 59(5), 1719–1726 CrossRef CAS.
- Y. Sun, Q. Wang, C. Chen, X. Tan and X. Wang, Environ. Sci. Technol., 2012, 46(11), 6020 CrossRef CAS PubMed.
- L. Liu, S. Liu, Q. Zhang, C. Li, C. Bao, X. Liu and P. Xiao, J. Chem. Eng. Data, 2013, 58(2), 209 CrossRef CAS.
- G. Zhao, T. Wen, X. Yang, S. Yang, J. Liao, J. Hu and X. Wang, Dalton Trans., 2012, 41(20), 6182 RSC.
- M. Kazemipour, M. Ansari, S. Tajrobehkar, M. Majdzadeh and H. R. Kermani, J. Hazard. Mater., 2011, 150, 322 CrossRef PubMed.
- M. Kobya, E. Demirbas, E. Senturk and M. Ince, Bioresour. Technol., 2005, 96, 1518 CrossRef CAS PubMed.
- M. M. Kadam, M. B. Sravani, V. G. Gaikar and N. Jha, AIP Conf. Proc., 2013, 1538, 249, DOI:10.1063/1.4810067.
- W. Chen, R. B. Rakhi, M. N. Hedhili and H. N. Alshareef, J. Mater. Chem. A, 2014, 2, 5236 CAS.
- K. Sheng, Y. Sun, C. Li, W. Yuan and G. Shi, Sci. Rep., 2012, 2(247), 1–5 Search PubMed.
- N. A. Kumar, H.-J. Choi, Y. R. Shin, D. W. Chang, L. Dai and J.-B. Baek, ACS Nano, 2012, 6(2), 1715 CrossRef CAS PubMed.
- P. Ramesh, S. Bhagyalakshmi and S. Sampath, J. Colloid Interface Sci., 2004, 274, 95 CrossRef CAS PubMed.
- D. C. Marcano, D. V. Kosynkin, J. M. Berlin, A. Sinitskii, Z. Sun, A. Slesarev, L. B. Alemany, W. Lu and J. M. Tour, ACS Nano, 2010, 4(8), 4806 CrossRef CAS PubMed.
- G. Wang, X. Sun, C. Liu and J. Lian, Appl. Phys. Lett., 2011, 99(5), 053114 CrossRef PubMed.
- G. Venugopal, K. Krishnamoorthy, R. Mohan and S.-J. Kim, Mater. Chem. Phys., 2012, 132(1), 29 CrossRef CAS PubMed.
- C. Hontoria-Lucas, A. Lopez-Peinado, J. d. D. López-González, M. Rojas-Cervantes and R. Martin-Aranda, Carbon, 1995, 33(11), 1585 CrossRef CAS.
- K. Krishnamoorthy, M. Veerapandian, K. Yun and S.-J. Kim, Carbon, 2013, 53, 38–49 CrossRef CAS PubMed.
- A. C. Ferrari and J. Robertson, Phys. Rev. B: Condens. Matter Mater. Phys., 2000, 61, 14095 CrossRef CAS.
- M. A. Pimenta, G. Dresselhaus, M. S. Dresselhaus, L. G. Cancado, A. Jorioa and R. Saito, Phys. Chem. Chem. Phys., 2007, 9, 1276 RSC.
- C. H. Lucas, A. J. L. Peinado, D. L. Gonzalez, M. L. R. Cervantes and R. M. M. Aranda, Carbon, 1995, 33, 1585 CrossRef.
- Y.-Li. Huang, H.-W. Tien, C.-C. M. Ma, S.-Y. Yang, S.-Y. Wu, H.-Y. Liu and Y.-W. Mai, J. Mater. Chem., 2011, 21, 18236 RSC.
- F. A. de La Cruz and J. Cowley, Nature, 1962, 196, 468 CrossRef CAS.
- I. Jung, D. A. Dikin, R. D. Piner and R. S. Ruoff, Nano Lett., 2008, 8(12), 4283 CrossRef CAS PubMed.
- H.-K. Jeong, M. Jin, E. J. Ra, K. Y. Sheem, G. H. Han, S. Arepalli and Y. H. Lee, ACS Nano, 2010, 4(2), 1162 CrossRef CAS PubMed.
- M. Zhi, C. Xiang, J. Li, M. Li and N. Wu, Nanoscale, 2013, 5, 72–88 RSC.
- C. Fu, G. Zhao, H. Zhang and S. Li, Int. J. Electrochem. Sci., 2013, 8, 6269 CAS.
- E. Teer, M. Deraman, I. A. Talib, S. A. Hashmi and A. A. Umar, Electrochim. Acta, 2011, 56(27), 10217 CrossRef PubMed.
- B. A. Abd-El-Nabey, A. M. Abdel-Gaber, E. Khamis, A. I. A. Morgaan and N. M. Ali, Int. J. Electrochem. Sci., 2013, 8, 11301 CAS.
- A. K. Mishra and S. Ramaprabhu, J. Phys. Chem. C, 2011, 115, 14006 CAS.
- S. Park, K.-S. Lee, G. Bozoklu, W. Cai, S. T. Nguyen and R. S. Ruoff, ACS Nano, 2008, 2(3), 572 CrossRef CAS PubMed.
- S. T. Yang, Y. Chang, H. Wang, G. Liu, S. Chen, Y. Wang, Y. Liu and A. Cao, J. Colloid Interface Sci., 2010, 351(1), 122 CrossRef CAS PubMed.
- S. A. Dastgheib and D. A. Rockstraw, Carbon, 2002, 40(11), 1843 CrossRef CAS.
Footnote |
| † Electronic supplementary information (ESI) available: Fig. S1: pictorial presentation of the GO samples prepared. Fig. S2: interlayer spacing for GO samples with different degrees of oxidation. Fig. S3: plot ID/IG ratio for graphite and different GO samples (GO-1 to GO-5). Fig. S4: plot of zeta potential vs. samples with different oxidation levels. Fig. S5: impedance vs. frequency plot of GO-1, GO-2, GO-3, GO-4 and GO-5 samples. See DOI: 10.1039/c4ra08862j |
|
| This journal is © The Royal Society of Chemistry 2014 |
Click here to see how this site uses Cookies. View our privacy policy here.