DOI:
10.1039/C4RA08839E
(Paper)
RSC Adv., 2014,
4, 62987-62995
A SiO2-coated nanoporous alumina membrane for stable label-free waveguide biosensing
Received
18th August 2014
, Accepted 12th November 2014
First published on 14th November 2014
Abstract
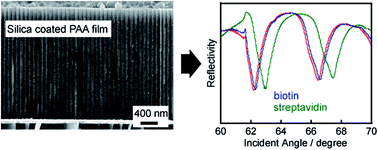
Nanoporous anodic alumina (PAA) has been widely employed in many areas due to its well-ordered and self-organized pore structures. In the present study, we demonstrated two uses of a SiO2 coating: to attach a free-standing PAA membrane to a hydroxylated gold layer for use as a planar optical waveguide sensor and to create a protective layer against etching in aqueous solution by a surface sol–gel (SSG) method. Scanning electron microscopy (SEM) indicates that the as-formed SiO2 layer covers both the inner and outer surfaces of the PAA membrane. Optical waveguide spectroscopy (OWS) measurements show that the apparent waveguide modes were typical for a PAA/Au film with “SiO2 glue”, while only the typical surface plasma resonance curve was observed before the SSG process was performed. Additionally, the SiO2-coated PAA/Au film after five SSG cycles displays greater aqueous stability in the range of pH 2.4 to 7.3 in comparison to the primary PAA membrane, indicating that the SiO2 layer was continuous. The feasibility of label-free optical biosensing was demonstrated by two immunosensor experiments that monitored the adsorption of either bovine serum albumin (BSA) or streptavidin in real time. The application of the SSG method to a thicker PAA film (>2.5 μm) with an organized pore structure for OWS biosensing was demonstrated, and improved sensitivity in good agreement with simulation results was achieved.
Introduction
Recently, nanoporous materials have attracted interest due to their potential applications in selective molecular separation, drug delivery, catalysis, nanostructure fabrication, energy storage, sensors and nanodevices.1–8 Nanoporous anodic alumina (PAA) film, with its self-organized, densely packed, one-dimensional cylindrical pore structure, is a specific class of nonporous material. There is interest in using functionalized PAA films as optical waveguides9–12 and surface plasmon resonance13 for various sensing applications. Changes in the refractive index (RI) of the film due to the rapid adsorption of an analyte into the pores can be detected by converting biomolecular interactions into detectable signals, such as acoustic signals,14 electrochemical signals,15 optical signals9–11 and thermal signals.16 Compared to fluorometric sensors, which show higher sensitivity, much effort has been made to enhance the sensitivity of label-free biosensors using PAA film. For example, Hotta et al.11 reported the use of PAA with an optimized nanostructure as a nanoporous waveguide sensor, which responded to the adsorption of BSA with an extremely large red-shift of the waveguide mode. Gold-coated ordered PAA bilayers were presented as a cost-effective label-free optical biosensor due to the increase in the RI contrast between the PAA layer and the sensing aqueous solution.17 Furthermore, label-free biosensors prepared from other materials and methods have also been investigated.18–23
Biosensors based on PAA films have several advantages. The structural parameters of PAA films can be easily engineered by adjusting the anodization conditions.24 For example, the pore diameter and the porosity of a PAA film can be accurately controlled through the anodization potential and wet etching in phosphoric acid solutions, the thickness of a PAA film can be controlled by the anodization time and anodization potential, and the inter-pore distance is linearly proportional to the anodization potential. Moreover, PAA films offer large surface areas and are relatively stable at physiological pH.9,25 Because no passivation step is required, surface functionalization can be easily carried out at both the inner and outer surfaces of the films.26,27 For broad biosensing applications, it is more desirable to integrate PAA films with other substrates. PAA films with organized pores usually require a two-step anodization process for which a thicker Al layer with low surface roughness and high purity is needed.28,29 However, this method is not suitable for directly anodizing the Al layer deposited on substrates under vacuum, as these conditions restrict the thickness of the Al layer with low roughness due to the development of grain microstructure.30 Thus, electropolished bulk Al foil was usually used for the fabrication of PAA films, thus circumventing the aforementioned thickness problem, followed by integration between the free PAA and the substrate. Lazzara et al.31 used an adhesive to integrate the PAA film with an Au layer as the planar optical waveguide, and they showed superior waveguide coupling properties. Tan et al.12 demonstrated a method to bond free-standing PAA templates by atomic layer deposition (ALD) onto a piece of gold-coated substrate. Using these prepared substrates as optical waveguide sensors, subangstrom sensitivity was achieved with bovine serum albumin. Although optical biosensing with PAA film showed excellent sensitivity, it dissolves in both alkaline and acidic solutions due to its amphoteric character, which would cause an unfavorable shift in the baseline during biosensing applications.25 To overcome the instability problem of the inorganic porous membrane, Hotta et al.32 presented an improved aqueous stability of a PAA membrane by using a protective coating layer composed of poly(acrylic acid) and poly(allylamine hydrochloride). A label-free optical interference immunosensor based on a TiO2-coated porous silicon also displayed greater aqueous stability in the pH range 2–12.33
In our study, we employed the surface sol–gel (SSG) method of SiO2 to integrate a free-standing PAA film with a gold-deposited glass substrate (Au substrate), as shown in Fig. 1, and used as a biosensor. The structure of the proposed biosensor can be easily tuned by controlling the anodization conditions and post-etching conditions of the PAA template, and the cycles of SSG to attain a high performance for the biosensor. SSG is a layer-by-layer method, and it usually involves repeats of two-step deposition cycles.34,35 Molecules in the precursor solution were first adsorbed, and then a hydrolysis step was carried out to form an oxide film after a post-adsorption wash that desorbs weakly bound molecules.36 In this report, the SiO2 layer formed through five SSG cycles can serve as an adhesive to fill the voids/gaps between the free-standing PAA film and Au substrates for intimate contact. This bonded sample can then be used as a planar optical waveguide biosensor, and typical waveguide modes were observed in the angular reflection spectra (incident angle vs. reflectivity) compared to the system without the SSG treatment, in which typical surface plasmon resonance (SPR) was observed based on optical waveguide spectroscopy (OWS). Moreover, the SiO2 layer was also demonstrated to be an effective protective coating layer that prevents dissolution of the PAA film in acidic solutions (pH 2.4–7.3) when compared to a bare PAA film. The feasibility of the SiO2-coated PAA film as a planar optical waveguide biosensor was demonstrated by adsorption of bovine serum albumin (BSA) and a biotin–streptavidin affinity model in real time. Finally, an increased sensitivity was achieved with a thicker PAA film based on the SSG procedure for immobilizing streptavidin, which cannot be easily fabricated using in situ anodization of an Al layer evaporated on the substrate.
 |
| Fig. 1 Schematic illustration of the surface sol–gel (SSG) process to bond a through-hole and free-standing PAA film to an Au substrate using the formed SiO2 layer. The details of the procedure can be found in the Experimental section. | |
Experiment section
Materials
A K9 square glass slide (22 × 22 × 0.5 mm3) was purchased from Dongguan City Hong Cheng Optical Co., Ltd. (China). Sulfosuccinimidyl-6′-[biotinamido]-6-hexanamido-hexanoate (sulfo-NHS-LC-LC-biotin) was obtained from Pierce, Inc. (Rockford, IL). (3-Mercaptopropyl)trimethoxysilane (3-MPS) and 3-aminopropyltriethoxysilane (APTES) were purchased from Alfa Aesar (China). Streptavidin was purchased from Beijing Biosynthesis Biotechnology Co., Ltd. (China). All other organic solvents and chemical reagents were purchased from Shenzhen Tianxiang Huabo Co., Ltd. (China) and Xiya reagents (Sichuan, China) and were used as received without further purification. Milli-Q water (Millipore Corp., Bedford, MA) was used throughout the experiments.
Preparation of SiO2 layer coated PAA films
Through-hole and free-standing PAA films were fabricated using classic two-step anodization28 of a highly pure aluminum foil (99.999%). Briefly, aluminum foil (30 × 10 × 0.5 mm3) was first electrochemically polished in a mixture of ethanol and perchloric acid (4
:
1) at 20 V for 7 min at 15 °C after having been sonicated in acetone and methanol to give a smooth surface. Then, the first anodization was performed in a 0.3 M oxalic acid solution at 40 V for 12 h at 15 °C using an Al plate as a counter-electrode and the solution was vigorously stirred using a magnetic stirrer. After removing the PAA film with irregular pores using a mixture of 1.8 wt% chromic acid/6 wt% phosphoric acid, the second anodization was performed using the same conditions as the first anodization (except for the anodization time). Then, the resulting PAA film was washed thoroughly with Milli-Q water and dried under flowing N2 gas. After anodization, the pore diameters and the porosity of the PAA film were adjusted by immersing it in a 5 wt% phosphoric acid. The remaining aluminum of the aluminum foil was selectively detached in a saturated HgCl2 solution, and the barrier layer of the PAA film was removed by floating it in a 5 wt% phosphoric acid solution at 30 °C for 35 min using nail polish as the protective layer. Finally, the through-hole and free-standing PAA film was carefully transferred to a K9 glass slide (n = 1.515@632.8 nm), which was previously magnetically sputtered with 45 nm Au and a 1 nm Cr adhesion layer. Prior to the transfer, the Au substrate was immediately immersed in a solution of 20 mM 3-mercaptopropyltrimethoxysilane (3-MPS) for 3 h after magnetic sputtering. Then, the 3-MPS immobilized on the Au substrate was hydrolyzed in a 0.1 M HCl solution for 1 h to produce hydroxyl groups. Finally, the substrate was annealed at 120 °C for 20 min under vacuum.
Coating of the silica layer was performed using the surface sol–gel (SSG) method.34,35 The Au substrate with the through-hole PAA film was first immersed in an 85% SiCl4 solution for 2 min. After subsequently immersing in hexane to remove the unbound molecules from the surface for 5 min, the substrate was then soaked in hexane/methanol (1
:
1 v/v) for 3 min and pure ethanol for 5 min to remove hexane and methanol. These soaks were followed by washing with ethanol and drying in a N2 stream. Next, the SiCl4 molecules adsorbed on the surface of PAA were hydrolyzed for 5 min by soaking the substrate in water to form SiO2. These steps constitute one SSG cycle, and this process was repeated until the desired number of cycles was completed. After deposition of silica using the SSG method, the substrate was put in an oven at 120 °C for 20 min under vacuum.
Optical waveguide spectroscopy using the SiO2 layer-coated PAA film
OWS experiments were performed using the Kretschmann coupling scheme37 shown in Fig. 2, and the reflection spectra of the samples (PAA films attached to the Au substrates with or without the SSG procedure) were measured as a function of the incident angle in the range of 60 to 70 degrees with an angular resolution of 0.02°. A He–Ne laser light (λ = 632.8 nm) served as the incident light at the back of the sample, which was attached to a K9 equilateral prism via index matching fluid (n = 1.515), after passing through a polarizer and a beam splitter. The incident light can be adjusted to s- (transverse electric) or p- (transverse magnetic) polarized light using a polarizer. The intensity of the reflected light from the sample, defined as the sample signal, was collected by a photodiode detector after its polarization was set to match the incident light using an analyzer. The intensity of the light path vertically after the beam splitter (50
:
50, non-polarized), defined as the reference signal, was detected using another photodiode detector to monitor the intensity changes of the laser. The reflected intensity is defined as the ratio between the sample signal and the reference signal. Then, the reflectivity of the sample in the angular spectrum was obtained by normalizing these results to similar measurements on a bare glass slide. A PDMS flow cell with a volume of 2 μL (16 mm × 1.3 mm × 100 μm) was mounted on the sample and was connected to homemade pump system and a polyfluoroalkyl vinyl ether (PFA) tube. The sample solutions were circulated at a flow rate of 50 μL min−1.
 |
| Fig. 2 Schematic illustration of the set up based on Kretschmann configuration for the optical waveguide spectroscopy (OWS) measurement. | |
Stability tests of the SiO2 layer coated PAA film
Aqueous stability tests of the SiO2-coated PAA film with five SSG cycles were examined by the OWS experiments. In brief, buffer solutions in the pH range of 2.4 to 8.2 were injected into the PDMS flow cell, and the time-dependent intensity of the reflection light was monitored simultaneously for each buffer solution. The baseline was acquired by rinsing the cell with Milli-Q water after each buffer solution was injected sequentially. The flow rate for the buffer solutions was 50 μL min−1. The stability tests were performed at room temperature.
SiO2 layer coated PAA film for the immunosensor experiment
For the immunosensor experiment, adsorption of 500 nM bovine serum albumin (BSA) in a phosphoric buffer solution (5 mM, pH 5.1) and the biotin–streptavidin affinity measurements were monitored using the PAA film with 5 SSG cycles. To establish a steady baseline, buffer solution was first rinsed through the flow cell for a certain of period time. Then, 500 nM BSA solution was injected into the flow cell, followed by rinsing with pure buffer. It is well known that BSA adsorbs onto metal oxides to form a monolayer. Near the isoelectric point (I. E. P) of BSA (pH 5), the largest amount of BSA molecules can absorb onto the metal oxide surfaces regardless of the I. E. P of the metal oxide surfaces.38 For the biotin–streptavidin experiment, the sample was first activated in a mixture of 0.1 M KH2PO4/0.1 M K2HPO4 solution for 30 min and kept in the oven at 60 °C for 2 h. Then, it was immersed in a 5 wt% APTES solution (in dry methanol) for 24 h under the protection of N2. Finally, after thoroughly rinsing with methanol and drying in a stream of N2, the treated sample was heated at 120 °C for 2 h under vacuum to achieve covalent linking of the silane groups to the surface of the silica. For the immobilization of biotin, a solution of 0.5 mM sulfo-NHS-LC-LC-biotin (in a 10 mM phosphate buffer containing 100 mM NaCl, pH 7.4) was passed through the amine-modified surface for 40 min. The reagent was then replaced by a buffer solution to remove the weakly bound and unreacted biotin molecules followed by injection of 100 nM streptavidin into the flow cell. For each immobilization step, angular reflection spectra and time-dependent reflectivity were monitored based on OWS.
Results and discussion
Characterization of the sample
PAA films fabricated via two-step anodization28,29 form well-ordered cylindrical pores that run continuously through the depth of the films. Fig. 3a and d show the typical top and cross-sectional scanning electron microscopy (SEM) images of the free standing PAA film without the barrier layer. The film was fabricated according to the procedures in the experimental section using a 10 min second anodization and a 12 min pore widening treatment in the 5 wt% phosphoric acid solution. The thickness (hpore), inter-pore distance (dinter-pore) and pore diameter (ϕpore) were 1030 ± 11 nm, 105 ± 3 nm and 74 ± 2 nm, respectively, which are in agreement with the growth and wet etching parameters. The porosity of the film was calculated as 30.6% from the structure parameters. After four and five SSG cycles, the effective diameter of the pores tended to be narrower, and the diameters of the pores decreased to 65 ± 3 nm and 61 ± 3 nm, respectively, as measured by the top and cross-sectional view of SEM images (Fig. 3). These measurements correspond to a SiO2 layer thickness of approximately 4.5 nm and 6.5 nm, respectively. From the cross-sectional SEM images of the PAA film after four and five SSG cycles, no noticeable gaps/voids between the film and the substrate were found, indicating that the PAA film was firmly attached to the Au substrate. The increased thickness of the SiO2 layer per SSG cycle exceeds the values reported in the literature32 in which a lower concentration of SiCl4 and PAA films with larger pores were used. The cross-sectional SEM images indicate that a uniform SiO2 layer is coated both inside and outside the PAA pores and on the Au substrate. This structure, made of the SiO2-coated PAA film and the Au substrate, can then be readily used as a planar optical waveguide biosensor for monitoring the binding of protein under the Kretschmann configuration (Fig. 2), which will be discussed in the following section.
 |
| Fig. 3 Top (upper panel) and cross-sectional (lower panel) SEM images of the free-standing PAA film (a and d) and the samples subjected to four (b and e) or five (c and f) SSG cycles. The diameters of the pores were narrowed to 65 ± 3 nm and 61 ± 3 nm with four and five SSG cycles, respectively. | |
Optical waveguide spectroscopy using the SiO2-coated PAA film
To prove the firm adhesion of the PAA film to the Au substrate after the SSG cycles, OWS experiments using two different samples were carried out. First, two free-standing PAA films were fabricated with a second anodization time of 10 min. Then, the pores of the resultant films were widened for 12 min, followed by detachment of the Al layer and removal of the barrier layer. Both of the PAA films were carefully transferred to Au substrates. In the OWS experiment, the two samples were tested in Milli-Q water: one sample (designated as sample A) was examined as-prepared, while the other one (designated as sample B) was first pre-treated with five SSG cycles. In the angular reflection spectrum based on OWS (Fig. 4a), a typical surface plasmon resonance (SPR) curve was observed under p-polarized light using film A. In the angle range of 60 to 70 degrees, the resonance angle of the SPR curve could not be observed due to the small RI of the prism used in the study. Moreover, no coupling dips were shown in the spectrum (Fig. 4a) under s-polarized light, indicating the failed excitation of the optical waveguide modes within film A. The resulting curves were in good agreement with the Fresnel calculations for a bare gold-coated K9 glass in contact with water (the SPR resonance angle θSPR = 71.89°, black line in Fig. 4a), and the structural parameters of the sample used for the Fresnel fitting are summarized in Table 1. The results strongly support the idea that the PAA film was loosely adhered to the Au substrate and could not support waveguide modes.
 |
| Fig. 4 OWS experiment with a sample in contact with water before (a) and after (b) five SSG cycles. The black solid lines and the black dotted lines are the theoretical simulations based on Fresnel calculations for p- and s-polarized light, respectively. | |
Table 1 Refractive indices and thicknesses used in Fresnel simulation for films A and B
|
Layer |
RI |
hpore (nm) |
ϕpore (nm) |
dinter-pore (nm) |
Sample A |
Cr |
3.5691 + i4.3625 |
0.5 |
|
|
Au |
0.184 + i3.48 |
47 |
|
|
Cr |
3.5691 + i4.3625 |
0.8 |
|
|
Sample B |
Au |
0.18278 + i3.095 |
48 |
|
|
PAA |
1.673 (TM3) |
1030 |
74 |
105 |
Matrix |
1.660 (TE3) |
When the sample was pre-treated with five SSG cycles, different behaviors of the angular reflection spectra were observed during the OWS experiment. As seen in Fig. 4b, typical waveguide modes are apparent in the angular reflection spectra under both p- and s-polarized light in film B. A sharp dip located at θOWG = 61.93° and corresponding to the excitation of the TM3 mode was observed under p-polarized light, while a resonance angle of θOWG = 63.96° was observed under s-polarized light corresponding to the TE3 mode (according to the Fresnel calculations). That is, light is able to be guided in the SiO2-coated PAA film as the optical waveguide modes after five SSG cycles. According to Fresnel calculations, the different angular positions of the reflection minima for the optical waveguide modes can be simulated by the effective RI of the waveguiding layer. The PAA film and the medium around it were considered to be one effective medium with an effective RI, which can be expressed within the Maxwell-Garnett theory:39,40
|
n∥2 = nal2(1 − fpore) + npore2fpore
| (1) |
|
 | (2) |
|
 | (3) |
where
n∥ and
n⊥ are the effective RIs of the waveguide layer (SiO
2 coated PAA film and the surrounding medium) in the direction parallel (transverse magnetic mode) and normal (transverse electric mode) to the film surface, respectively.
nal represents the RI of the alumina matrix, while
fpore is the volume fraction of the PAA film.
npore represents the RI of the PAA pore composed of the coating silica (approximately 6.5 nm) and the surrounding medium (water). By coating silica onto the outer and inner surface of the PAA film using the SSG method, water molecules are partially replaced by the relatively porous silica. The RI of the PAA pore can be described by using a Lorentz–Lorenz equation:
41 |
 | (4) |
where
nsilica and
nm are the RIs of the silica layer (
nsilica = 1.457 was used, which is equal to that of dense silica
42) and the medium (water,
nm = 1.333).
fsilica is the volume fraction of the packed silica layer in the PAA pores. By substituting
npore calculated from
eqn (4) into
eqn (1) and
(2), the effective RI of the waveguide layer can be obtained. As seen in
Fig. 4b, the positions of the experimentally obtained reflection minima were in good agreement with the Fresnel fitting. This result is due to the effective RI, the thickness of the waveguide layer and the structural parameters used in the Fresnel fitting (summarized in
Table 1). Compared to the calculated curves, the experimental results in the angular spectra show shallower and broader coupling dips, especially for the TE mode. The reason for this observation may be attributed to the surface roughness of the SiO
2 layer during the SSG procedures and the nonuniform distribution of the nanopores.
43 By comparing the experimental and calculated results for the two samples, the silica formed by the SSG procedure can indeed be used as the glue to firmly bond the PAA film to the Au substrate and fill the gaps in between. Furthermore, the bonded substrate was also demonstrated to be a planar optical waveguide biosensor.
Aqueous stability of the SiO2-coated PAA film
For the applications of label-free biosensors, the aqueous stability of the system against zero-point drift is an important factor. The aqueous stability of the SiO2 coated PAA film was then examined with respect to its OWS response after successively loading buffer solutions with different pHs (2.4–8.2) and Milli-Q water into the flow cell. The parameters of the sample used in aqueous stability test were kept identical to that of film B. In the OWS experiment, the incident angle of the light was fixed in the vicinity of θOWG of the TM3 mode, and the reflectivity was monitored over time under flow. Baseline was established when the Milli-Q water was introduced into the flow cell. Upon replacing the water with buffer solutions, an abrupt increase in reflectivity was induced because the RIs of the buffer solutions containing electrolytes were higher than that of water. As seen previously,32 the bare PAA film is stable at pH 8.0 and 8.5, while it dissolves in aqueous solution at pH < 7.0 and pH ≥ 9.8, resulting in a decrease in effective RI of the waveguiding layer and thus a blue-shift in θOWG. The reflectivity signal then gradually decreased. On the contrary, with the protective layer of silica, the sample was more stable, and no significant decrease in the reflectivity was found after loading of a series of buffer solutions ranging in pH from 2.4 to 7.3 (Fig. 5). In a buffer solution with a pH of 8.2, a gradual decrease of the reflectivity was observed for the sample, indicating the unfavorable degradation of the silica layer in basic solutions at pH > 7.3. This result is in agreement with the literature.18,33 However, the SiO2-coated PAA film can still function as a stable label-free biosensor because biosensing for protein and DNA is generally performed under acidic and physiological conditions.
 |
| Fig. 5 Time-dependent reflectivity signal of a SiO2-coated PAA film under alternating flows of buffer solutions in the pH range of 2.4 to 8.3 and in pure water. The flow cell was rinsed with pure water between each buffer. The red and black arrows indicate injection of the buffer solutions and water, respectively. | |
Immunosensor experiments using the SiO2-coated PAA film
We performed OWS experiments using the SiO2 coated PAA film as an immunosensor for the detection of bovine serum albumin (BSA) and for measurement of biotin–streptavidin affinity. Only the TM mode, which showed higher coupling efficiency, was used. The parameters of two samples used in the OWS experiment are identical to that of film B. The concentrations of BSA and streptavidin were 500 nM and 100 nM, respectively, because saturated adsorption is recognized for these two concentrations of the proteins in these samples (data not shown).
One sample was first tested by monitoring the adsorption of BSA molecules. BSA is a globular protein with dimensions of 4 × 4 × 14 nm3 and is well-known to adsorb onto metal oxide surfaces to form a monolayer.38 Compared to the sample with a pore diameter of approximately 61 nm, BSA is small enough to penetrate into the pores.9,11,44 We adjusted the pH of the BSA solutions to be near the I. E. P of BSA to maximize the adsorption of the BSA molecules onto the silica surfaces. At pH 5, bare PAA film would gradually dissolve in the solution, which makes it unsuitable for biosensing due to unfavorable drift of the baseline.32 Fig. 6a shows the angular reflection spectrum of the sample before and after loading of 500 nM BSA solution. Buffer solution was first introduced into the flow cell for a few minutes to saturate the pores and establish a baseline, and a clear waveguide coupling dip located at 61.78° can be seen. Then, 500 nM BSA (pH 5.1) in the buffer solution was introduced, followed by rinsing with pure buffer solution. An increase in the reflectivity signal of 0.12 was observed when monitoring the reflectivity at the angle of coupling dip (θOWG = 61.78°), which indicates the physical adsorption of the BSA molecules (Fig. 6b). During this period, the angle of the coupling dip increased 0.24° as compared to the angular reflection spectrum shown in Fig. 6a. BSA molecules adsorbed at the internal and external surfaces of the sample to form a homogenous monolayer with a thickness of 7 nm.9 According to the Fresnel calculations, the amount of BSA adsorbed is estimated to be 1.1 ng mm−2, considering the density of BSA (0.49 mg mm−3).44
 |
| Fig. 6 Angular reflection spectra of a SiO2-coated PAA film measured with (a) BSA solution and (c) biotin and streptavidin solutions. The spectra were recorded after the adsorption of molecules reached equilibrium, which was followed by rinsing with a buffer solution. Time-dependent reflectivity signals during adsorption of (b) BSA and (d) biotin and streptavidin to the surfaces of SiO2 coated PAA films. Black arrows indicate the injection of target solutions and rinsing buffer. | |
The feasibility of the sample as an immunosensor was also studied using a biotin–streptavidin affinity model. After loading the sulfo-NHS-LC-LC-biotin solution and rinsing with a pure buffer, an increase of approximately 0.01 in the reflectivity was identified by the covalent conjugation of the biotin units at the surface of the silica (Fig. 6d). The binding of the biotin to the sample can also be confirmed by the angular shift of the waveguide coupling dip (ΔθOWG = 0.06°) in Fig. 6c. Subsequently, the buffer solution was substituted for 100 nM streptavidin, which induced an increase in the reflectivity through strong biotin–streptavidin binding. After removing the weakly bonded streptavidin by loading the flow cell with pure buffer, no noticeable decrease in the reflectivity was observed. Along with the increase in the reflectivity, a total angular shift (0.32°) of the waveguide coupling dip was confirmed in the angular reflection spectrum, which was greater than that of coupling with sulfo-NHS-LC-LC-biotin.
Increasing the thickness of the waveguiding layer is an effective way to improve the sensitivity, which cannot be easily fabricated by direct anodization of the deposited Al film. The SSG method is applied to bond a free-standing PAA film with a larger film thickness (h = 2.65 μm) to an Au substrate (designated as sample C) with five SSG cycles, and the biotin–streptavidin affinity model was checked for comparison. Fig. 7a and b show the top and cross-sectional SEM images of sample C. In the OWS response, two coupling dips corresponding to the TM5 and TM6 modes were observed in the angular range of 60 to 70 degrees after successfully loading the buffer solution, suggesting the intimate adhesion of the waveguide layer and the Au substrate. Furthermore, the angular shifts of the waveguide coupling dips for the immobilization of both biotin and streptavidin molecules until saturation in the TM5 mode are 0.12° and 0.96°, respectively, which are two and three times larger than that of the sample performed with a 1.03 μm PAA film due to the increase in the thickness of the waveguiding layer (2.6 times). The angular shift for the adsorption of streptavidin is 2-fold larger than the one reported in the literature45 which using Au SPR for immobilization of 0.1 mg cm−3 streptavidin under optimal conditions, the performance of the current biosensor can still be improved further by increasing the thickness, pore density and porosity of PAA.11,24 For label-free biosensors, specificity is a critical factor. In this study, a control experiment was performed by loading 100 nM streptavidin onto the biotin-free SiO2-coated PAA film shown in Fig. 7d, and no noticeable change in the reflectivity was observed. The results show that the red-shift of the resonant angle in the OWS experiment was due to the specific binding between biotin and streptavidin. From the study, we demonstrate the utility of the intimate adhesion resulting from the SSG method and the applicability of SiO2-coated PAA film to highly sensitive and specific biodetection.
 |
| Fig. 7 (a) Top and (b) cross-sectional SEM images of the sample C. (c) Angular reflection spectra of the sample C measured with 0.5 mM biotin and 100 nM streptavidin solutions. The spectra were recorded after the adsorption of biotin and streptavidin reached equilibrium, which was followed by rinsing with buffer solution. (d) Time-dependent reflectivity signal (blue line) during adsorption of biotin and streptavidin to the surfaces of the sample C. The red line shows the time-dependent binding curve of a SiO2 coated PAA film without immobilization of biotin exposed to 100 nM streptavidin solution. Black arrows indicate the injection of biotin, streptavidin and rinsing buffer. | |
Conclusions
In summary, a surface sol–gel (SSG) method was used to bond a free-standing PAA film to a hydroxylated Au substrate. The SiO2 was formed on the internal and external surfaces of the PAA film and on the surface of the Au layer. This thin silica layer can be used to fill the voids/gaps between the free-standing PAA film and the Au substrate and as a glue to firmly bond these two substances. Typical optical waveguide modes were apparent in the OWS measurement when the PAA films were treated with five SSG cycles, while only the typical surface plasmon resonance curve can be observed in angular reflection spectrum under p-polarized light before the SSG procedure. This result confirmed the intimate adhesion. Moreover, the thin silica layer can also present as a protective layer against aqueous solutions, and the SiO2-coated PAA film treated with five cycles of SSG displayed greater aqueous stability in the pH range of 2.4 to 7.3. For the immunosensor experiments, adsorption of bovine serum albumin (BSA) and streptavidin were examined in real time using the SiO2-coated PAA film. The SSG method can also be applied to a thicker PAA film (h = 2.65 μm) for the OWS experiment, resulting in increased sensitivity. The results obtained in this study confirm that SiO2-coated PAA films are applicable to highly sensitive and specific biomolecular interaction detection.
Acknowledgements
This work was supported in part by the National Nature Science Foundation of China (grants no. 21273126).
References
- I. Vlassiouk, A. Krasnoslobodtsev, S. Smirnov and M. Germann, Langmuir, 2004, 20, 9913 CrossRef CAS PubMed.
- H. U. Osmanbeyoglu, T. B. Hur and H. K. J. Kim, J. Membr. Sci., 2009, 343, 1 CrossRef CAS PubMed.
- D. Losic and S. Simovic, Expert Opin. Drug Delivery, 2009, 6, 1363 CrossRef CAS PubMed.
- C. R. Martin and P. Kohli, Nat. Rev. Drug Discovery, 2003, 2, 29 CrossRef CAS PubMed.
- A. Wittstock, V. Zielasek, J. Biener, C. M. Friend and M. Bäumer, Science, 2010, 327, 319 CrossRef CAS PubMed.
- M. S. Sander and L. S. Tan, Adv. Funct. Mater., 2003, 13, 393 CrossRef CAS.
- I. Cabasso, S. D. Li, X. W. Wang and Y. X. Yuan, RSC Adv., 2012, 2, 4079 RSC.
- S. Akil-Jradi, S. Jradi, J. Plain, P.-M. Adam, J.-L. Bijeon, P. Royer and R. Bachelot, RSC Adv., 2012, 2, 7837 RSC.
- Y. Fan, K. Hotta, A. Yamaguchi and N. Teramae, Opt. Express, 2012, 20, 12850 CrossRef CAS PubMed.
- Y. Fan, K. Hotta, A. Yamaguchi, Y. Ding, Y. H. He, N. Teramae, S. Q. Sun and H. Ma, Appl. Phys. Lett., 2014, 105, 031103 CrossRef PubMed.
- K. Hotta, A. Yamaguchi and N. Teramae, ACS Nano, 2012, 6, 1541 CrossRef CAS PubMed.
- L. K. Tan, H. Gao, Y. Zong and W. Knoll, J. Phys. Chem. C, 2008, 112, 17576 CAS.
- A. G. Koutsioubas, N. Spiliopoulos, D. Anastassopoulos, A. A. Vradis and G. D. Priftis, J. Appl. Phys., 2008, 103, 094521 CrossRef PubMed.
- K. Länge, B. Rapp and M. Rapp, Anal. Bioanal. Chem., 2008, 391, 1509 CrossRef PubMed.
- D. Grieshaber, R. Mackenzie, J. Voros and E. Reimhult, Sensors, 2008, 8, 1400 CrossRef CAS PubMed.
- P. Bataillard, E. Steffgen, S. Haemmerli, A. Manz and H. M. Widmer, Biosens. Bioelectron., 1993, 8, 89 CrossRef CAS.
- G. Macias, L. P. Hernndez-Eguia, J. Ferr-Borrull, J. Pallares and L. F. Marsal, ACS Appl. Mater. Interfaces, 2013, 5, 8093 CAS.
- K. S. Mun, S. D. Alvarez, W. Y. Choi and M. J. Sailor, ACS Nano, 2010, 4, 2070 CrossRef CAS PubMed.
- C. K. Tsang, T. L. Kelly, M. J. Sailor and Y. Y. Li, ACS Nano, 2012, 6, 10546 CAS.
- C. D. Corso, A. Dickherber and W. D. Hunt, Biosens. Bioelectron., 2008, 24, 805 CrossRef CAS PubMed.
- Z. Y. Zeng, X. Z. Zhou, X. Huang, Z. J. Wang, Y. L. Yang, Q. C. Zhang, F. Boey and H. Zhang, Analyst, 2010, 135, 1726 RSC.
- Z. J. Wang, J. Zhang, P. Chen, X. Z. Zhou, Y. L. Yang, S. X. Wu, L. Niu, Y. Han, L. H. Wang, P. Chen, F. Boey, Q. C. Zhang, B. Liedberg and H. Zhang, Biosens. Bioelectron., 2011, 26, 3881 CrossRef CAS PubMed.
- Z. Y. Yin, Q. Y. He, X. Huang, J. Zhang, S. X. Wu, P. Chen, G. Lu, P. Chen, Q. C. Zhang, Q. Y. Yan and H. Zhang, Nanoscale, 2012, 4, 293 RSC.
- J. P. O'Sullivan and G. C. Wood, Proc. R. Soc. London, Ser. A, 1970, 317, 511 CrossRef.
- P. Mardilovich, A. N. Govyadinov, N. I. Mazurenko and R. Paterson, J. Membr. Sci., 1995, 98, 143 CrossRef CAS.
- A. M. M. Jani, E. J. Anglin, S. J. P. McInnes, D. Losic and J. G. Shapter, Chem. Commun., 2009, 3062 RSC.
- T. D. Lazzara, T.-T. Kliesch, A. Janshoff and C. Steinem, ACS Appl. Mater. Interfaces, 2011, 3, 1068 CAS.
- H. Masuda and K. Fukuda, Science, 1995, 268, 1466 CAS.
- S. K. Hwang, S. H. Jeong, H. Y. Hwang, O. J. Lee and K. H. Lee, J. Chem. Eng., 2002, 19, 467 CAS.
- J. A. Thornton, J. Vac. Sci. Technol., A, 1986, 4, 3059 CAS.
- T. D. Lazzara, K. H. A. Lau and W. Knoll, J. Nanosci. Nanotechnol., 2010, 10, 4293 CrossRef CAS PubMed.
- K. Hotta, A. Yamaguchi and N. Teramae, J. Phys. Chem. C, 2012, 116, 23533 CAS.
- J. Li and M. J. Sailor, Biosens. Bioelectron., 2014, 55, 372 CrossRef CAS PubMed.
- B. He, S. J. Son and S. B. Lee, Langmuir, 2006, 26, 8263 CrossRef PubMed.
- N. I. Kovtyukhova, T. E. Mallouk and T. S. Mayer, Adv. Mater., 2003, 10, 780 CrossRef.
- I. Ichinose, H. Senzu and T. A. Kunitake, Chem. Mater., 1997, 9, 1296 CrossRef CAS.
- Y. Fan, Y. Ding, H. Ma, N. Teramae, S. Q. Sun and Y. H. He, Biosens. Bioelectron., 2014 DOI:10.1016/j.bios.2014.08.021.
- S. Fukuzaki, H. Urano and K. Nagata, J. Ferment. Bioeng., 1996, 81, 163 CrossRef CAS.
- C. G. Granqvist and O. Hunderi, Phys. Rev. B: Condens. Matter Mater. Phys., 1978, 18, 2897–2906 CrossRef CAS.
- C. A. Foss, M. J. Tierney and C. R. Martin, J. Phys. Chem., 1992, 96, 9001 CrossRef CAS.
- D. E. Aspnes, Thin Solid Films, 1982, 89, 249 CrossRef CAS.
- C. J. Brinker and G. W. Scherer, Sol–gel science: the physics and chemistry of sol–gel processing, Academic Press, San Diego, 1990, ch. 3, p. 97 Search PubMed.
- D. H. Kim, K. H. A. Lau, J. W. F. Robertson, O. J. Lee, U. Jeong and J. I. Lee, Adv. Mater., 2005, 17, 2442 CrossRef CAS.
- M. Tencer, R. Charbonneau, N. Lahoud and P. Berini, Appl. Surf. Sci., 2007, 253, 9209 CrossRef CAS PubMed.
- N. Yang, X. Su, V. Tjong and W. Knoll, Biosens. Bioelectron., 2007, 22, 2700 CrossRef CAS PubMed.
|
This journal is © The Royal Society of Chemistry 2014 |
Click here to see how this site uses Cookies. View our privacy policy here.