Phosphorus-doped graphene-wrapped molybdenum disulfide hollow spheres as anode material for lithium-ion batteries
Wenda Qiua,
Jiqing Jiaob,
Jian Xiaa,
Haiming Zhonga and
Liuping Chen*a
aKLGHEI of Environment and Energy Chemistry, School of Chemistry and Chemical Engineering, Sun Yat-sen University, Guangzhou 510275, China. E-mail: cesclp@mail.sysu.edu.cn; Fax: +86 20 8411 2245; Tel: +86 20 8411 5559
bInstitute of Hybrid Materials, Growing Base for State Key Laboratory of New Fiber and Modern Textile, Qingdao University, Qingdao 266071, P.R. China
First published on 29th September 2014
Abstract
Molybdenum disulfide is a promising candidate for the anode material in lithium-ion batteries due to its high theoretical specific capacity. However, volume change during cycling causes poor cycling stability and rate performance, and improving cycle life is a major research challenge. Herein, we present a strategy by fabricating phosphorus-doped graphene-wrapped molybdenum disulfide hollow spheres to improve the electrochemical performance of molybdenum disulfide in lithium storage. It is demonstrated that the obtained composite shows excellent electrochemical performance as anode material for lithium-ion batteries. The composite exhibits the high specific capacity of ∼1097 mA h g−1 at a current of 100 mA g−1, as well as excellent cycling stability and high-rate capability. The unique hollow structure combined with phosphorus-doped graphene wrapping definitely contributes to this versatile electrochemical performance.
1. Introduction
Molybdenum disulfide (MoS2), another important transition metal sulfide with the same crystal structure as graphite,1 has been widely studied as an electrode material for supercapacitors2 and lithum-ion batteries (LIBs)3 due to its high theoretical reversible capacity of 670 mA h g−1, which much higher than that of the commercial graphitic carbon anodes (372 mA h g−1). However, the rapid capacity fading and poor rate performance significantly limit its practical applications. This problem mainly originates from the large volume change of electrode material accompanying Li+ insertion and extraction, which creates large internal stress, leading to the disintegration and pulverization of the electrode material. To alleviate the problem, one effective strategy is to design hollow or porous structures,4 where the void space provided in this type of material could buffer the volume change, leading to improved cycling retention and rate properties.5In addition to hollow or porous materials, MoS2–C composite is another type of unique structure that might be utilized to achieve the same goal. The idea of creating such a structure not only cushions the internal stress induced during the volume change, but also makes the composite more conductive.6 Graphene nanosheets (GNS), a monolayer of carbon atoms with a tight packing of honeycomb lattice, has become one of the rising stars in material science.7 Its intriguing properties, like high electrical conductivity and mechanical flexibility,8 make it very attractive for LIBs9,10 and supercapacitors.11,12 In our previous work, we reported a studies on MoS2 with amorphous carbon, which showed outstanding electrochemical performance as electrode material.13 So far, practical and theoretical investigations have explored that doping of heteroatoms (S, B, P, N, etc.) in the GNS could further boost its conductivity and electrochemical performance.14,15 The reason for the electrochemical performance boost is provoked by doped atoms with different electronegativity (e.g., N: 3.04, B: 2.04, S: 2.58) that can break the electroneutrality of GNS to create the charged sites which improve the discharge and charge capacity of GNS in LIBs.16,17 Since phosphorus has a lower electronegativity than carbon, higher electron-donating ability,18 it is of great significance to explore the unique properties of phosphorus-doped graphene (PG), which is rarely reported.
Compared to nitrogen- and boron-doped graphene, synthesis of PG for LIBs still remains a challenge because of the relatively large atomic radius of phosphorus; a general and effective synthetic strategy to produce pure PG-wrapped transition metal sulfide is thus highly desirable. Herein, we demonstrate the fabrication of PG-wrapped MoS2 hollow spheres (PG–MoS2) utilizing a simple hydrothermal route following the annealing. The PG coating facilitates the electronic transportation to reach the hollow spheres, and serves as a flexible structure strengthening agent for the hollow spheres, while the hollow sphere acts as high-capacity lithium storage host and provide hollow interior space to buffer their large volume variation during lithium uptake/release processes. The subsequent electrochemical measurement showed that the PG–MoS2 sample exhibits significantly enhanced lithium storage properties in terms of higher specific capacities and better cyclic capacity retention compared to the MoS2 hollow spheres and graphene-wrapped MoS2 hollow spheres (G-MoS2), evidently proving the positive effect of PG enwrap metal sulfide structures.
2. Experimental details
2.1 Synthesis of electrode material
2.2 Material characterization
The samples were characterized with X-ray diffraction (XRD, Thermo X'TRA X-ray diffractometer with Cu Kα source), field emission scanning electron nanoscopy (FESEM, JSM-6330F), transmission electron nanoscopy (TEM, FEI Tecnai G2 Spirit), Atomic force microscopy (AFM, SPM-9500J3), thermogravimetric analysis (TGA, TG 209 F3 Tarsus), Laser Raman spectroscopy (Renishaw inVia), X-ray photoelectron spectroscopy (XPS, ESCALAB 250), and the surface area of the product was calculated from nitrogen adsorption/desorption isotherms at 77 K that were conducted on an ASAP 2020 V3.03 H instrument.2.3 Electrochemical test
The electrochemical characterization was performed using 2032 coin-type cells. The working electrode was prepared by a slurry coating procedure. The slurry consisted of 80 wt% active material, 10 wt% acetylene black and 10 wt% polyvinylidene fluoride (PVDF) dissolved in N-methyl-2-pyrrolidinone, the obtained slurry was spread on a pure Cu foil which acted as current collector. The coated electrode was dried at 120 °C for 12 h in vacuum and then pressed to enhance the particle contact. The test cell was assembled in an argon-filled glove box, using a lithium sheet as the counter and reference electrode, a polypropylene film (Celgard-2400) as the separator, and 1.0 M LiPF6 solution in ethylene carbonate (EC) and dimethyl carbonate (DMC) (1![[thin space (1/6-em)]](https://www.rsc.org/images/entities/char_2009.gif) :
:![[thin space (1/6-em)]](https://www.rsc.org/images/entities/char_2009.gif) 1 in volume) as the electrolyte.
1 in volume) as the electrolyte.
Galvanostatic charge–discharge measurement of the cell was carried out on Neware battery tester between 0.01 ∼ 3.00 V at various current densities. Cyclic voltammetry of the cell was conducted using an electrochemical workstation (Zahner IM6ex) in the potential range of 0.01–3.00 V vs. Li/Li+ at a scan rate of 0.5 mV s−1. Electrochemical impedance spectral (EIS) measurements were performed on PARSTAT 2273 advanced electrochemical system by applying a sine wave with the excitation amplitude of 5.0 mV in the frequency range from 100 kHz to 0.01 Hz.
3. Results and discussion
The PG is synthesized through high temperature annealing a mixture of GO and TPP, which are employed as the carbon (C) and phosphorus (P) sources, respectively. As shown in Scheme 1, the as-obtained mixture of GO and TPP is annealed at 900 °C under high purity argon atmosphere to give phosphorus dope graphene nanosheets. During the thermal annealing process, the TPP breaks down into single P atoms, and then a subsequent reaction of the P atoms with graphene. The doped P atoms (P–C or P–O) are usually react with oxygen containing groups on the plan and edge of the GO sheets to join into the carbon framework,19 resulting in simultaneous phosphorus doping and reduction of graphene oxide. P–C bonds can be easier formed than P–O bonds at higher annealing temperature. It is attributed that P–O bonds are not thermally stable at higher annealing temperature, which is similar with previous report for the breakage of N–O bonds in N-doped graphene caused by overheating.20,21 The substitution of C atoms by P atoms in the graphene sheets is confirmed by the binding energies for the P2p peak in XPS that coincide with those previously reported.22,23 | ||
| Scheme 1 Schematic illustration of synthesis of PG through high temperature annealing of the GO and TPP mixture. | ||
Fig. 1 shows the morphology of the as-prepared MoS2 hollow spheres and PG–MoS2. It is clear from the Fig. 1a that the sample contains uniform hollow spheres, which are approximately ∼500 nm in diameter. The PG can be easily identified as the thin sheets that wrap around these particles and also bridge nearby particles together, which is shown in Fig. 1b. The hollow interior of these particles is clearly revealed from Fig. 1c, in which each particle presents a significant contrast between the edge and centre. Moreover, folding of the PG can be observed between connected particles, which proves that PG indeed wrap around the MoS2 hollow spheres. Fig. 1d shows a typical high-magnification TEM image of a single hollow sphere. The highly wrinkled surface on the shell indicates that the hollow sphere is probably composed of MoS2 nanosheets. They are folded, curved and assembled into the hierarchical hollow sphere. The hierarchical surface and hollow structure would offer a huge specific surface area for electrochemical reactions, which is shown in Fig. 2. The nitrogen adsorption and desorption isotherms of these samples coincide with a type IV isotherm. The derived specific surface area for the PG–MoS2 (245 m2 g−1) is superior to the MoS2 hollow spheres (143 m2 g−1), and G-MoS2 (213 m2 g−1). The AFM image is collected at the edge of the PG, as shown in Fig. 1e. The thickness of the PG coating on MoS2 particles measure by AFM is about 0.96 nm.
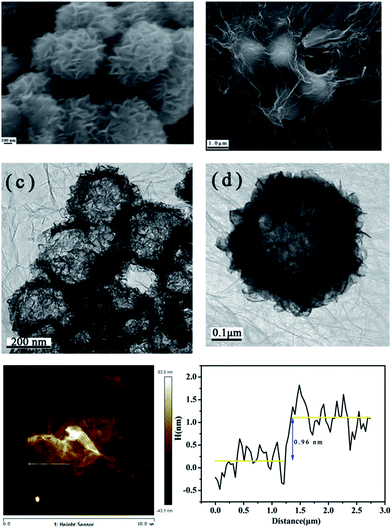 | ||
| Fig. 1 SEM images of MoS2 hollow spheres (a) and PG–MoS2 (b). TEM images of PG–MoS2 (c) and single PG–MoS2 (d). AFM images of PG–MoS2 (e). | ||
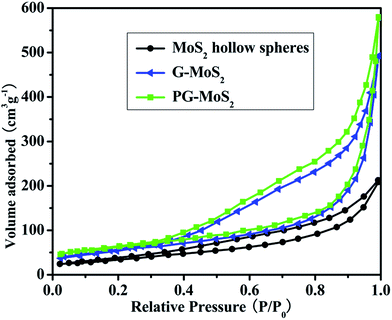 | ||
| Fig. 2 Nitrogen adsorption and desorption isotherms of the MoS2 hollow spheres, G-MoS2, and PG–MoS2. | ||
The chemical compositions of these samples are studied by XRD, as shown in Fig. 3a. A single diffraction peak is observed in pattern I at ∼11°, indicating that GO has been successfully obtained via the chemical oxidation of graphite powder. This characteristic GO peak completely disappears after the annealing process (pattern II in Fig. 3a), accompany by the appearance of a new peak at ∼25.53° which is due to the (002) diffraction of PG. This proves that the GO has been fully transformed to PG using the current annealing process.24 For PG–MoS2 (pattern III), G-MoS2 (pattern IV), and MoS2 hollow spheres (pattern V), all the identified peaks can be assigned to the standard hexagonal 2H–MoS2 structure (JPCDS 37-1492), underlining the phase purity of the as-prepared product. The intensity of (002) peaks of PG–MoS2 and G-MoS2 are relatively lower compared with MoS2 hollow spheres, suggesting the incorporation of PG or GNS could inhibit the (002) plane growth of MoS2 crystals in the composite. The absences of the PG peak and GNS peak show that they uniformly disperse and wrap around the MoS2 hollow spheres. TGA is employed to determine the amount of PG present in the PG–MoS2 (Fig. 3b). MoS2 hollow spheres start to lose weight at approximately 425 °C due to the oxidation of MoS2 to MoO3. The PG–MoS2 exhibits two weight losses. The first one appears at approximately 250 °C, which can probably be attributed to the removal of oxygen-containing groups. The second is a large continuous weight loss in the range of approximately 373–580 °C. This thermal behavior might be caused by the decomposition of the PG, and oxidation of MoS2 in the composite. The weight fraction of the PG in the composite is measured to be ∼11%.
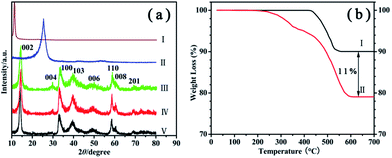 | ||
| Fig. 3 (a) XRD patterns of GO (I), PG (II), PG–MoS2 (III), G-MoS2 (IV), and MoS2 hollow spheres (V). (b) TGA of MoS2 hollow spheres (I), and PG–MoS2 (II). | ||
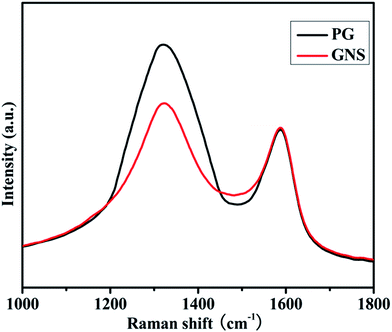
As shown in Fig. 4, it can be known that the D band, observed at approximately 1323 cm−1, is disorder induced. It is attributed to structural defect sites on the GNS plane. The G band observed at approximately 1587 cm−1, is commonly observed for all graphitic structures and attributed to the E2g vibrational mode present in the sp2 bonded graphitic carbons. The intensity ratio of the D peak to G peak (ID/IG), provides the gauge for the amount of structural defects. It is obvious that PG has a relatively increased ID/IG of 1.52 relative to 1.15 in GNS because of the incorporated phosphorus atoms,25,26 which allows MoS2 particles to be more effectively and uniformly dispersed on its surface.
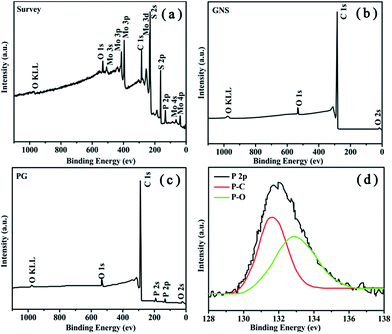
As shown in Fig. 5a, the existence of O, C, P, Mo and S elements assure the purity of products. Additionally, a small quantity of O comes from a few parts of PG that are not completely reduced during the annealing process. We can see the P2p characteristic peak (132 eV) exists at the XPS survey spectrum of PG. The amount of phosphorus doped into the PG is 1.86 at.% by XPS elemental analysis, as shown in Table 1. The XPS survey spectrum of GNS (Fig. 5b) are similar with PG in all other ways except that there is no phosphorus in GNS. Furthermore, high-resolution of P2p spectrum presented in Fig. 5d also contains the P–C (131.5 eV) and P–O (132.9 eV) bonding.27 This result strongly supports that phosphorus atoms are successfully incorporated into the GNS structure through a thermal annealing process.
| Samples | C (at.%) | O (at.%) | P (at.%) |
|---|---|---|---|
| GNS | 97.01 | 2.91 | 0 |
| P-GNS | 95.05 | 3.09 | 1.86 |
Fig. 6 shows the representative cyclic voltammograms (CV) of these samples, and these CV behaviors are generally consistent with that reported previously.28,29 Two cathodic peaks at about 0.96 V and 0.48 V in the first cycle can be assigned to the phase transformation from 2H to 1T of LixMoS2 and the reduction of Mo4+ to Mo nanoparticles,30 respectively. In the second cycle, a new reduction peak at about 1.86 V appears, suggesting the generation of the gel-like polymeric layer.31 During the first charge process, small and large board peaks at 1.73 V and 2.33 V can be ascribed to the conversion reaction of Mo and Li2S to MoS2.32 The reversible reaction based on the equation: MoS2 + 4Li ↔ Mo + 2Li2S, is accompanied by the redox of Mo nanoparticles and the reversible growth of the gel-like layer.33 In comparison with MoS2 hollow spheres, the redox peaks for PG–MoS2 and G-MoS2 are not decrease during the cycling, indicating PG and GNS can stabilize the electrode structure.
 | ||
| Fig. 6 Representative CVs of the PG–MoS2 (a), G-MoS2 (b), and MoS2 hollow spheres (c) at a scan rate of 0.5 mV s−1 between 1 mV and 3.0 V. | ||
Fig. 7 shows the charge–discharge voltage profiles of these samples for the 1st, 2nd, 5th, 10th, 50th, and 100th cycles. As shown in Fig. 7a, in agreement with the above CV behavior, two potential plateaus at ∼1.15 and 0.6 V can be identified in the discharge process of the first cycle, and it gives a very high discharge capacity of 1281 mA h g−1. Note that the specific capacity is based on the total mass of the PG–MoS2 in the context. In the following discharge processes, two potential plateaus at 2.1 and 1.3 V are observed, and the plateau at 0.6 V disappears, which may correspond to the redox reaction of Li2S/S in a deeply discharged MoS2/Li cell according to Wang's reports.34 During the charging process, two potential plateaus at 1.7 and 2.2 V are visible, in agreement with the reported lithiation and delithiation profiles of MoS2.35,36 Fig. 7b and c shows that the initial discharge capacities of the G-MoS2 and MoS2 hollow spheres electrode are 1147 and 1056 mA h g−1. Among these samples, PG–MoS2 exhibits the highest charge and discharge capacities. The irreversible capacity loss in the 1st cycle can be mainly attributed to the irreversible processes including the electrolyte decomposition and inevitable formation of the solid-electrolyte interface (SEI) layer.37
 | ||
| Fig. 7 Charge–discharge voltage profiles of the PG–MoS2 (a), G-MoS2 (b), and MoS2 hollow spheres (c) for the 1st, 2nd, 5th, 10th, 50th and 100th cycles at a current density of 100 mA g−1. | ||
As shown in Fig. 8a, the initial charge and discharge capacities of the PG–MoS2 are 1097 and 1281 mA h g−1, respectively, corresponding to a Coulombic efficiency (CE) of 85.6%. The CE increases to larger than 99% after the 4th cycle. After 100 charge–discharge cycles, a high reversible charge capacity of 1072 mA h g−1 can be delivered by the PG–MoS2. For comparison, we test MoS2 hollow spheres, and G-MoS2 as anode materials, both of which exhibit higher capacity fade than that of PG–MoS2. After 100 cycles, the charge capacities of MoS2 hollow spheres and G-MoS2 are 770 and 889 mA h g−1, respectively. Interestingly, the discharge capacities of the PG–MoS2 increases during the cycle and can reach 1110 mA h g−1 after 45 cycles. This result is exemplary compared to other previous reports,38,39 which may be caused by defect sites and vacancies in PG. It is thus evident that the as prepared PG–MoS2 exhibits higher storage capability and enhanced cyclic capacity retention compared to the MoS2 hollow spheres and G-MoS2, and could serve as promising anode material for high-performance LIBs.
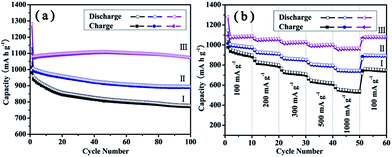 | ||
| Fig. 8 Cycling performance (a) and rate capability (b) of MoS2 hollow spheres (I), G-MoS2 (II), and the PG–MoS2 (III). | ||
The PG–MoS2 also demonstrates superior rate capabilities. Fig. 8b shows the rate cycling behavior of these composites. When the current densities increase from 100 to 200, 300, 500, and 1000 mA g−1, the specific capacities of the PG–MoS2 electrode change from 1087 to 1060, 1030, 1002, and 969 mA h g−1, respectively. It can be seen that the specific capacity of the PG–MoS2 is 969 mA h g−1, much higher than that of graphite, even at a current density of 1000 mA g−1. Moreover, after the high rate cycling, the discharge capacity of the PG–MoS2 can almost completely recover the initial capacity at a current density of 100 mA g−1, suggesting an excellent rate-cycling stability for the anodes. Although the MoS2 hollow spheres and G-MoS2 also exhibit a high rate performance, their capacities are significantly lower than the PG–MoS2. Even at a current density of 1000 mA g−1, the specific capacity of the PG–MoS2 is higher than the specific capacity of MoS2 hollow spheres and G-MoS2 at a current density of 100 mA g−1.
It is well known that volume expansion accompanies Li-insertion for electrode materials, so the structure integrity is important to ensure the cycleability of as-prepared products. In order to explore the alteration in morphology of the electrode materials during reaction with Li, SEM images of the PG–MoS2, G-MoS2 and MoS2 before and after cycling are recorded. As shown in Fig. 9, it is obvious that even after 40 cycles, the PG–MoS2 and G-MoS2 remain intact, no aggregation or broken sphere is observed with the help of the flexible PG or G sheets. By contrast, most of the completely MoS2 hollow spheres collapse and aggregate with each other. These results further demonstrate that the introduction of PG or G sheets can effectively buffer the strain and stress of the volume change and prevent the agglomeration of MoS2 spheres during cycling, contributing to its excellent cycling stability.
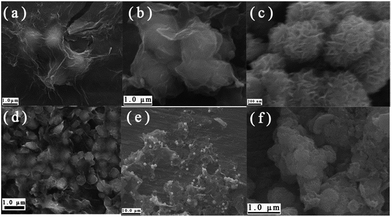 | ||
| Fig. 9 SEM images of (a) PG–MoS2, (b) G-MoS2, (c) MoS2 before cycle; (d) PG–MoS2, (e) G-MoS2, and (f) MoS2 after 40 cycles at a current density of 100 mA g−1. | ||
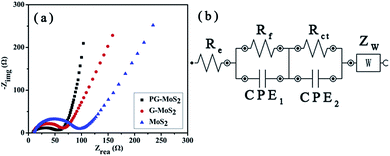
The superior Li storage properties of the PG–MoS2 as compared to that of G-MoS2 and MoS2 is supported by the EIS measurements on these samples after 10 discharge–charge cycles, which is shown in Fig. 10a. Re represents the internal resistance of the test battery, Rf and CPE1 are associated with the resistance and constant phase element of the SEI film, Rct and CPE2 are related with the charge-transfer resistance and constant phase element of the electrode/electrolyte interface, and ZW is determined by the Warburg impedance corresponding to the lithium-diffusion process. As shown in Fig. 10a, the high-frequency semicircle corresponds to the resistance Rf and CPE1 of the SEI film, and the semicircle in the medium-frequency region is assigned to the charge-transfer resistance Rct and CPE2 of the electrode/electrolyte interface. The inclined line corresponds to the lithium-diffusion process within the bulk of the electrode material. The kinetic differences of samples are further investigated by modeling AC impendence spectra based on the modified equivalent circuit (Fig. 10b).40 As seen from Fig. 10a, the PG–MoS2 shows a smaller radius of semi-circle in the Nyquist plots, suggesting a lower contact and charge-transfer resistances in the PG–MoS2 composite electrode. According to EIS equivalent circuit in Fig. 10b, Rf and Rct are 8.69 Ω, and 53.94 Ω, respectively, for the PG–MoS2, which are less than these of G-MoS2 (Rf = 9.81 Ω and Rct = 65.07 Ω) and MoS2 hollow spheres (Rf = 12.31 Ω and Rct = 90.98 Ω). This fact confirms that the PG have more effect on reduce contact resistance and charge transfer resistance during the electrochemical lithium insertion/extraction reaction, resulting in significant improvement in the electrochemical performance.
The excellent electrochemical performance of the PG–MoS2 could be attributed to the following factors. First, the PG wrapping could greatly enhance the electronic conductivity of the composite by bridging adjacent MoS2 hollow spheres together. Second, the uninterrupted electron supply from PG could improve the electrochemical ability of MoS2 hollow spheres, resulting in enhanced reversible storage capacity of MoS2 hollow speres for Li+. Third, the flexible PG and hollow interior of the MoS2 particles could effectively buffer volume variation and store large quantity lithium ions during the charge–discharge process. Last but not less, the synergistic interaction between PG and MoS2 hollow spheres is believed as main reason for the superior performances of PG–MoS2 for reversible Li+ storage.
4. Conclusions
In summary, a novel composite of PG–MoS2 is successfully synthesized through facile hydrothermal and annealing method. The MoS2 hollow speres are encapsulated by flexible PG to overcome the issues of structural change and aggregation of MoS2 particle during reversible storage process of Li+. Moreover, this unique composite is capable to efficiently utilize the high conductivity, large surface area, good mechanical flexibility, and excellent electrochemical performance of PG as well as the large electrode-electrolyte contact area, short diffusion path of Li+, and extraordinary stability for MoS2 hollow speres. As a result, the PG–MoS2 exhibits exceptional high capacity, superior cyclic stability and high-rate capability, highlighting the advantages of hollow structure of MoS2 and utilization of PG encapsulation to achieve the maximum performance for LIBs. The same strategy could be applied to other hollow nanomaterials toward robust structures and enhanced lithium storage properties for lithium-ion batteries.Acknowledgements
We gratefully acknowledge the financial support from the National Natural Science Foundation of China (no. J1103305).Notes and references
- X. Huang, Z. Y. Zeng and H. Zhang, Chem. Soc. Rev., 2013, 42, 1934 RSC.
- E. G. da Silveira Firmiano, A. C. Rabelo, C. J. Dalmaschio, A. N. Pinheiro, E. C. Pereira, W. H. Schreiner and E. R. Leite, Adv. Energy Mater., 2014, 4, 1301380 Search PubMed.
- J. Xiao, X. Wang, X. Q. Yang, S. D. Xun, G. Liu, P. K. Koech, J. Liu and J. P. Lemmon, Adv. Funct. Mater., 2011, 21, 2840 CrossRef CAS.
- J. Liu, G. Z. Cao, Z. G. Yang, D. H. Wang, D. Dubois, X. D. Zhou, G. L. Graff, L. R. Pederson and J. G. Zhang, ChemSusChem, 2008, 1, 676 CrossRef CAS PubMed.
- S. Ding, J. S. Chen, G. Qi, X. Duan, Z. Wang, E. P. Giannelis, L. A. Archer and X. W. Lou, J. Am. Chem. Soc., 2010, 133, 21 CrossRef PubMed.
- X. S. Zhou, Y. X. Yin, L. J. Wan and Y. G. Guo, J. Mater. Chem., 2012, 22, 17456 RSC.
- C. Rao, A. Sood, K. Subrahmanyam and A. Govindaraj, Angew. Chem., Int. Ed., 2009, 48, 7752 CrossRef CAS PubMed.
- H. Chen, M. B. Muller, K. J. Gilmore, G. G. Wallace and D. Li, Adv. Mater., 2008, 20, 3557 CrossRef CAS.
- H. L. Wang, L. F. Cui, Y. A. Yang, H. S. Casalongue, J. T. Robinson, Y. Y. Liang, Y. Cui and H. J. Dai, J. Am. Chem. Soc., 2010, 132, 13978 CrossRef CAS PubMed.
- S. J. Ding, J. S. Chen, D. Y. Luan, F. Y. C. Boey, S. Madhavi and X. W. Lou, Chem. Commun., 2011, 47, 5780 RSC.
- M. Pumera, Energy Environ. Sci., 2011, 4, 668 CAS.
- H. L. Wang, H. S. Casalongue, Y. Y. Liang and H. J. Dai, J. Am. Chem. Soc., 2010, 132, 7472 CrossRef CAS PubMed.
- W. D. Qiu, J. Xia, S. X. He, H. J. Xu, H. M. Zhong and L. P. Chen, Electrochim. Acta, 2014, 117, 145 CrossRef CAS PubMed.
- S. Some, J. Kim, K. Lee, A. Kulkarni, Y. Yoon, S. Lee, T. Kim and H. Lee, Adv. Mater., 2012, 24, 5481 CrossRef CAS PubMed.
- C. Zhang, N. Mahmood, H. Yin, F. Liu and Y. Hou, Adv. Mater., 2013, 25, 4932 CrossRef CAS PubMed.
- H. Wang, C. Zhang, Z. Liu, L. Wang, P. Han, H. Xu, K. Zhang, S. Dong, J. Yao and G. Cui, J. Mater. Chem., 2011, 21, 5430 RSC.
- L. Dai, D. W. Chang, J. B. Baek and W. Lu, Small, 2012, 8, 1130 CrossRef CAS PubMed.
- D. S. Yang, D. Bhattacharjya, S. Inamdar, J. Park and J. S. Yu, J. Am. Chem. Soc., 2012, 134, 16127 CrossRef CAS PubMed.
- Y. Zhang, T. Mori, J. Ye and M. Antonietti, J. Am. Chem. Soc., 2010, 132, 6294 CrossRef CAS PubMed.
- X. L. Li, H. L. Wang, J. T. Robinson, H. Sanchez, G. Diankov and H. J. Dai, J. Am. Chem. Soc., 2009, 131, 15939 CrossRef CAS PubMed.
- T. V. Khai, H. G. Na, D. S. Kwak, Y. J. Kwon, H. Ham, K. B. Shim and H. W. Kim, J. Mater. Chem., 2012, 221, 7992 Search PubMed.
- Z. W. Liu, F. Peng, H. J. Wang, H. Yu, W. X. Zheng and J. Yang, Angew. Chem., 2011, 123, 3315 CrossRef.
- M. Latorre-Sánchez, A. Primo and H. García, Angew. Chem., Int. Ed., 2013, 52, 11813 CrossRef PubMed.
- D. Long, W. Li, L. Ling, J. Miyawaki, I. Mochida and S. H. Yoon, Langmuir, 2010, 26, 16096 CrossRef CAS PubMed.
- D. S. Geng, Y. Chen, Y. G. Chen, Y. L. Li, R. Y. Li, X. L. Sun, S. Y. Ye and S. Knights, Energy Environ. Sci., 2011, 4, 760 CAS.
- Y. L. Li, J. J. Wang, X. F. Li, D. S. Geng, R. Y. Li and X. L. Sun, Chem. Commun., 2011, 47, 9438 RSC.
- Z. W. Liu, F. Peng, H. J. Wang, H. Yu, W. X. Zheng and J. Yang, Angew. Chem., Int. Ed., 2011, 50, 3257 CrossRef PubMed.
- H. Liu, D. W. Su, R. F. Zhou, B. Sun, G. X. Wang and S. Z. Qiao, Adv. Energy Mater., 2012, 2, 970 CrossRef CAS.
- Y. T. Liu, X. D. Zhu, Z. Q. Duan and X. M. Xie, Chem. Commun., 2013, 49, 10305 RSC.
- G. Du, Z. Guo, S. Wang, R. Zeng, Z. Chen and H. Liu, Chem. Commun., 2010, 46, 1106 RSC.
- Q. Wang and J. Li, J. Phys. Chem. C, 2007, 111, 1675 CAS.
- H. Hwang, H. Kim and J. Cho, Nano Lett., 2011, 11, 4826 CrossRef CAS PubMed.
- C. F. Zhang, Z. Y. Wang, Z. P. Guo and X. W. Lou, ACS Appl. Mater. Interfaces, 2012, 4, 3765 CAS.
- X. P. Fang, X. W. Guo, Y. Mao, C. X. Hua, L. Y. Shen, Y. S. Hu, Z. X. Wang, F. Wu and L. Q. Chen, Chem.–Asian J., 2012, 7, 1013 CrossRef CAS PubMed.
- C. Q. Feng, J. Ma, H. Li, R. Zeng, Z. P. Guo and H. K. Liu, Mater. Res. Bull., 2009, 44, 1811 CrossRef CAS PubMed.
- K. Chang and W. X. Chen, ACS Nano, 2011, 5, 4720 CrossRef CAS PubMed.
- W. H. Shi, J. X. Zhu, X. H. Rui, X. H. Cao, C. Chen, H. Zhang, H. H. Hng and Q. Y. Yan, ACS Appl. Mater. Interfaces, 2012, 4, 2999 CAS.
- Z. S. Wu, W. C. Ren, L. Wen, L. B. Gao, J. P. Zhao, Z. P. Chen, G. M. Zhou, F. Li and H. M. Cheng, ACS Nano, 2010, 4, 3187 CrossRef CAS PubMed.
- Y. M. Sun, X. L. Hu, W. Luo and Y. H. Huang, ACS Nano, 2011, 57, 100 Search PubMed.
- S. B. Yang, X. L. Feng, L. J. Zhi, Q. A. Cao, J. Maier and K. Mullen, Adv. Mater., 2010, 22, 838 CrossRef CAS PubMed.
| This journal is © The Royal Society of Chemistry 2014 |

