Augmentation of properties on sparingly loaded nanocomposites via functionalized single-walled carbon nanotubes using a covalent approach

Adhigan Murali, Senthil A. Gurusamy-Thangavelu*, Sellamuthu N. Jaisankar* and Asit Baran Mandal*
Polymer Division, Council of Scientific and Industrial Research (CSIR)-CLRI, Adyar, Chennai-600 020, Tamil Nadu, India. E-mail: senthil@clri.res.in; snjsankar@clri.res.in; abmandal@hotmail.com; Fax: +91-44-24911589; Fax: +91-44-24912150; Tel: +91-44-24422059 Tel: +91-44-24910846

Received 25th July 2014 , Accepted 5th November 2014

First published on 5th November 2014


Abstract

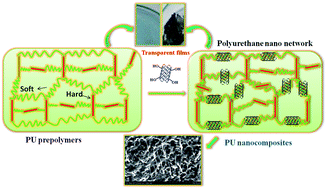
Polymer nanocomposites are developed, for the first time, as transparent films by the covalent addition of polyurethane (PU) prepolymers to trace amounts of functionalized carbon nanotubes, [OH]n–SWCNTs, via an efficient route using mild reagents. These PU nanocomposites, which were uniformly distributed with SWCNTs via covalent bonding between SWCNTs and the polyurethane network show enhanced mechanical, thermal and conductivity (10−4 S cm−1) properties.

Polymer nanocomposites1 using carbon nanotubes,2 multi-walled carbon nanotubes and single-walled carbon nanotubes3–5 have been developed by diverse methods, such as solution and melt mixing, non-covalent method, grafting, and in situ polymerization, for various applications.6–8 Song and Hesheng co-workers reported the synthesis of PU nanocomposites using SWCNTs by two step in situ polymerization.9,10 In our previous report, pristine SWCNTs were used to develop PU nanocomposites by a non-covalent method11 and a report on castor oil based PU/silica nanocomposites was recently published.12 As SWCNTs have extraordinary thermal, electrical and mechanical properties, their dispersion into a PU network can provide a new approach to promote their properties for use in electronics and automotives.5 Currently, PU nanocomposites are synthesized by a reaction between PU prepolymers and [OH]n–SWCNTs via a covalent approach. The SWCNTs, which are attached by a covalent bond, can transmit their unique properties to the PU networks. To facilitate the reaction between the isocyanates group on prepolymers and SWCNTs, a facile method has been developed for the first time to obtain [OH]n–SWCNTs from p-SWCNTs by modifying the synthetic route used for the conversion of fullerenes into fullerenols.13 In step I, p-SWCNTs were converted to [NO2]n–SWCNTs by the radical addition of gaseous nitro radicals generated from a mixture of sodium nitrite and conc. HNO3, followed by an aqueous alkaline treatment of [NO2]n–SWCNTs to afford [OH]n–SWCNTs in good yield, as shown in Scheme 1 (Experimental procedure and Fig. S2 are given in ESI).
image file: c4ra07636b-s1.tif
Scheme 1 Functionalization of the p-SWCNTs into [OH]n–SWCNTs followed by a reaction with the PU prepolymers to afford the PU nanocomposites.

In previous studies, polymer nanocomposites revealed enhancement in conductivity, as well as in mechanical and thermal properties mainly due to the incorporation of carbon nanotubes6 into the polymer matrix in the range from 0.5 to 10 wt% and ultrasmall loadings of SWCNTs, which were used to study mechanical properties.14 Herein, mildly functionalized [OH]n–SWCNTs were covalently added in trace amounts (0.01, 0.05, 0.1 and 0.3 wt%) to prepolymers without compromising their unique properties, as shown in Fig. 1. To develop such PU nanocomposites, the [OH]n–SWCNTs were added in situ to the PU prepolymers, which were formulated from poly(propylene glycol) [PPG] and 2,4′-toluene diisocyanate (TDI) in the presence of catalysts, Cu(I)Br and N,N,N′,N′′,N′′-pentamethyldiethylenetriamine (PMDETA) in THF with stirring at 65 °C, as shown in ESI (Fig. S1). The compositions of the PU control and PU nanocomposites were cast into stiff and transparent films, and characterized by ATR-IR, UV-vis DRS (Fig. S15), confocal Raman, solid state 13C NMR, DSC, TGA, optical microscopy, SEM as well as tensile strength. In these films, [OH]n–SWCNTs are covalently bonded uniformly to the PU network, which excludes the agglomeration of SWCNTs. In fact, the thermal, mechanical and conductivity studies, as well as non-trivial magnetic characterization were conducted to examine the anomalous behaviour in magnetic properties of the PU-nanocomposites by a vibrating sample magnetometer (VSM).


image file: c4ra07636b-f1.tif
Fig. 1 (a) Enhancement of the conductivity due to the increase in SWCNTs loading, and (b) decrease in resistivity with increasing SWCNTs loading.

To explore the conductivity, impedance spectroscopy (Hewlett Packard 4284A precision LCR meter) and two-probe resistance (Keithley 2400 source meter) were used to measure the conductivity and resistivity of the control and PU nanocomposites. Conductivity data was collected for PU nanocomposites films of thickness 1.5 mm to determine the real (Z′) and imaginary (Z′′) values from impedance spectroscopy, as shown in Fig. 1a.

PU nanocomposites films (0.3 and 0.1 wt% of [OH]n–SWCNTs) exhibit enhanced conductivity (0.3 wt%: σ = 6.35 × 10⁻⁴ S cm−1 and 0.1 wt%: σ = 2.37 × 10⁻⁵ S cm−1), compared to the conductivity of the control PU film (σ = 2.98 × 10⁻⁶ S cm−1). The conductivity of the three samples, control and PU nanocomposites (0.1 and 0.3 wt% loadings), gradually increased by one order of magnitude. The conductivity values reported in current work are higher than the PU nanocomposites containing 2 wt% of SWCNTs as per a previous report.15

The decrease in resistivity in this study is reported as a plot of [OH]n–SWCNTs (wt%) vs. resistivity, as shown in Fig. 1b, according to the increase in [OH]n–SWCNTs. Even if the least quantity (0.01 and 0.05 wt% of [OH]n–SWCNTs) of SWCNTs are covalently linked into the polymer network, the resistivity was reduced from 10−7 to 10−8 Ω, and this reduced further from 10−8 to 10−9 Ω in the PU nanocomposites films containing 0.1 and 0.3 wt% of the SWCNTs. Both conductivity and resistivity increase and decrease, respectively, with increasing [OH]n–SWCNTs loading.16

The magnetic study was performed on the basis of an anomalous feature noticed during solid state NMR sample preparation, for which films were cut into petite pieces and found to attract a magnet. This feature was observed without the encapsulation of ferromagnetic metals (Fe, Co or Ni), which prompted us to study the magnetic properties of these samples by VSM. In this context, the observed profile in Fig. 2a clearly shows the typical diamagnetic property of SWCNTs.17 Identical types of curves were noticed for both the samples, irrespective of the SWCNTs loading, i.e., from 0.1 to 0.3 wt%. However, the off-centre displacement of the magnetization curve was observed, which indicates the interaction of electrons of the PU nanocomposites with the applied field. Conventionally, metals generate flux when subjected to an applied magnetic field.18 Presumably, the emergence of flux in these materials occurs due to the presence of a trace proportion of metallic carbon nanotubes embedded into the polymer matrix, which may be due to the exposure of interfacial layers between the PU matrix and SWCNTs.


image file: c4ra07636b-f2.tif
Fig. 2 (a) VSM depicts the diamagnetism of PU nanocomposites (0.1 and 0.3 wt%), (b) confocal image probe focused on PU nanocomposites (0.3 wt%) and (c) Raman spectra correspond to three spots on confocal region.

The narrow region of the PU nanocomposites film was examined by confocal Raman spectroscopy to view the distribution of SWCNTs under colour contrast, in which the Raman spectra were randomly obtained at three different spots to probe the interaction of SWCNTs with the PU network,19 as shown in Fig. 2b. The Raman bands shown in Fig. 2c appear broader and were shifted to upfield frequencies, the G band was observed around 1594 cm−1 and D band was observed around 1459 cm−1, whereas amides I, II and III bands were observed at 1778, 1539 and 1535 cm−1, respectively. The shift in frequencies was due to the proper dispersion of SWCNTs and their π–π interaction with the PU network.15 The Raman frequencies observed in the confocal regions and spectra obtained for the control and PU nanocomposites were also similar, as given in ESI (Fig. S12). The D and G band were observed at 1454 cm−1 and 1589 cm−1, respectively, whereas the N–H stretching vibration of amide I (1776 cm−1), amide II (weak, 1538 cm−1) and amide III (strong, 1323 cm−1) with respect to the amide link of urethane and the aromatic moiety of TDI was observed at 1619 cm−1.

The ATR-IR spectra of the control and PU nanocomposites samples support the existence of a urethane link.10 An axial stretching vibration of –NH was noticed at 3352 cm−1 and the peak for C[double bond, length as m-dash]O was observed at 1710 cm−1. The C–H symmetric stretching vibrations of the methyl group was observed at 2968 cm−1 and the strong absorption at 1190 cm−1 was assigned to the C–O–C bonds of PPG. The aromatic ring stretching vibration was at 1592 cm−1 and the aromatic out of plane bend frequency was observed at 772 cm−1, as shown in Fig. 3a.


image file: c4ra07636b-f3.tif
Fig. 3 (a) ATR-IR spectra of the control and PU-nanocomposites films, (b) solid state 13C NMR spectra of the control and PU-nanocomposites (0.05 and 0.1 wt%).

The solid state 13C NMR spectra of these samples were collected from a Bruker 400 MHz, as shown in Fig. 3b. The control and PU nanocomposites were inferred from the broad signals of the urethane bonds20 due to the addition of isocyanate to a hydroxyl group between 159–148 ppm. The peaks in the range of 136–121 ppm were assigned to the aromatic carbons of TDI. The signal around 76–71 ppm was attributed to the carbon moiety of the PPG backbone and the upfield chemical shift, 21–16 ppm, was due to the methyl groups of TDI, as well as PPG. These spectra exhibit identical pattern of peaks except the minor peak at 121 ppm, which was not visible in the control film, this corroborates the presence of the sp2 hybridized carbon centres of [OH]n–SWCNTs bonded to the polymer nanocomposites.21 The chemical structure deduced from the 13C NMR data matches the interpretation from the ATR-IR and Raman spectra.

SEM images of the cured film (0.3 wt%) sputtered with gold were recorded at acceleration voltage of 15 kV to observe the morphology. Both low and high magnification SEM images are shown in Fig. 4. The dark contrast region represents the polymer network, in which the SWCNTs are uniformly entangled. The bright contrast corresponds to the SWCNTs that appear intact and free of agglomeration. The interface between the PU matrix and SWCNTs is visible around the entire region on the PU nanocomposites.


image file: c4ra07636b-f4.tif
Fig. 4 SEM images of cross-linked view on PU matrix tethered with SWCNTs (a) high magnification (6 K) and (b) low magnification (1.10 K).

Thermal characterization by TGA and DSC provides information on improvement of the thermal property due to the addition of SWCNTs. The TGA plot shows the onset degradation temperature above 270 °C and the peak temperature above 420 °C with respect to the degradation of polymeric samples. Even a trace loading of SWCNTs in the PU matrix enhanced their thermal stability, compared to the peak temperature of the control sample (420 °C). The peak temperature of PU nanocomposites samples (0.01 wt%: 436 °C, 0.05 wt%: 443 °C, 0.1 wt%: 448 °C and 0.3 wt%: 451 °C) exhibited a shift in the degradation temperature, as shown in Fig. 5a.


image file: c4ra07636b-f5.tif
Fig. 5 (a) TGA thermograms obtained for different wt% of SWCNTs, and (b) DSC for the control and PU nanocomposites (0.1 and 0.3 wt%).

DSC thermograms obtained for the samples, control and PU nanocomposites with 0.1 and 0.3 wt% loadings are compared in Fig. 5b. The Tg of the control film was 76 °C, whereas the sample containing 0.3 wt% of SWCNTs is noted at 77 °C and the sample containing 0.1 wt% of SWCNTs does not show much variation from the control sample.22 The DSC profile did not showed no melting peak with any of these samples up to 250 °C. The thermal properties showed an improvement in the thermal conductivity due to the facilitation of heat transport by SWCNTs, which incorporates the thermal stability on the nanocomposites film because there is a homogeneous dispersion of SWCNTs in the polymer matrix.10

The tensile strength was tested23 for these uniform thickness film samples to investigate their mechanical properties, as shown in Table 1. Compared to the tensile strength of the control sample in entry 1, the PU nanocomposites in entries 2, 3 and 4 show gradational improvement in tensile strength with increasing SWCNTs loading.9 The highest Young's modulus was observed for entry 4 (0.3 wt% of SWCNTs). The samples in entries 3 and 4 showed improved plastic behavior because the stress–strain curve passes through the strain hardening region, which is above the steady state and critical stress, as shown in ESI (Fig. S13).

Table 1 Tensile strength of the control and PU nanocomposites
S.no. Wt% of SWCNTs Tensile strength (MPa) Young's modulus (MPa) Elongation at break (%) Tensile strain (mm/mm) Tensile stress (MPa)
1. Control 8.5 6.3 136.8 1.36 8.5
2. 0.05 8.9 4.9 182.3 1.82 8.9
3. 0.1 9.3 5.0 184.8 1.83 9.2
4. 0.3 10.4 9.8 104.3 1.06 10.4


In summary, we have developed a facile synthetic route to transform p-SWCNTs into [OH]n–SWCNTs in good yield. PU nanocomposites were formed as films by a unique approach, which is the in situ addition of [OH]n–SWCNTs in trace quantities to PU prepolymers with an isocyanate group. Covalently attached [OH]n–SWCNTs on the PU prepolymers showed improvements in their desired properties due to the uniform dispersion without agglomeration. The upfield shift in the Raman spectra revealed the dispersion and π–π interaction among the PU and SWCNTs. Even the sparingly added [OH]n–SWCNTs contributed to enhance the conductivity of the control sample and reduced its resistivity. VSM redefined the diamagnetic property of [OH]n–SWCNTs with a mild magnetic flux arising from the ultrafine fraction of metallic SWCNTs. DSC and TGA exhibited improvements in the thermal stability of polyurethane. The tensile strength increased with increasing SWCNTs loading, and the tensile profile revealed plastic behaviour.

Acknowledgements

The first author (AM) is grateful to the Council of Scientific and Industrial Research (CSIR), India, grant no: 31/6(389)/2013-EMR-I for the fellowship. We thank Dr M. Sugunalakshmi, Industrial Chemistry, CSIR-CLRI for the TGA data and Dr N. Haridharan, NIT, Trichy, for the valuable discussion.

Notes and references

  1. P. M. Ajayan, L. S. Schadler, C. Giannaris and A. Rubio, Adv. Mater., 2000, 12, 750 CrossRef CAS.
  2. P. M. Ajayan, Chem. Rev., 1999, 99, 1787 CrossRef CAS PubMed.
  3. D. Samanta, R. M. Sankar, S. N. Jaisankar, M. S. Alam and A. B. Mandal, Chem. Commun., 2011, 47, 11975 RSC.
  4. R. H. Baughman, A. A. Zakhidov and W. A. de Heer, Science, 2002, 297, 787 CrossRef CAS PubMed.
  5. C. Sanchez, P. Belleville, M. Popall and L. Nicole, Chem. Soc. Rev., 2011, 40, 696 RSC.
  6. G. Sakellariou, D. Priftis and D. Baskaran, Chem. Soc. Rev., 2013, 42, 677 RSC.
  7. E. Badamshina, Y. Estrin and M. Gafurova, J. Mater. Chem. A, 2013, 1, 6509 CAS.
  8. Z. Spitalsky, D. Tasis, K. Papagelis and C. Galiotis, Prog. Polym. Sci., 2010, 35, 357 CrossRef CAS PubMed.
  9. X. Hesheng and M. Song, Soft Matter, 2005, 1, 386 RSC.
  10. X. Hesheng and M. Song, J. Mater. Chem., 2006, 16, 1843 RSC.
  11. R. M. Sankar, K. M. S. Meera, A. B. Mandal and S. N. Jaisankar, High Perform. Polym., 2013, 25, 135 CrossRef PubMed.
  12. K. M. S. Meera, R. M. Sankar, J. Paul, S. N. Jaisankar and A. B. Mandal, Phys. Chem. Chem. Phys., 2014, 16, 9276 RSC.
  13. Y. L. Chiang, J. B. Bhonsle, L. Wang, S. F. Shu, T. M. Chang and J. R. Hwu, Tetrahedron, 1996, 52, 4963 CrossRef.
  14. Y. Estrin, E. R. Badamshina, A. A. Grishchuk, G. S. Kulagina, V. A. Lesnichaya, Y. A. Ol'khov, A. G. Ryabenko and S. N. Sul’yanov, Polym. Sci., Ser. A, 2012, 54, 290 CrossRef CAS.
  15. A. Naumenko, V. Yashchuk, V. Bliznyuk and S. Singamaneni, Eur. Phys. J. B, 2012, 85, 1 CrossRef.
  16. W. Bauhofer and J. Z. Kovacs, Compos. Sci. Technol., 2009, 69, 1486 CrossRef CAS PubMed.
  17. Y. Kim, O. N. Torrens, J. M. Kikkawa, E. Abou-Hamad, C. Goze-Bac and D. E. Luzzi, Chem. Mater., 2007, 19, 2982 CrossRef CAS.
  18. Y. Li, T. Kaneko, T. Ogawa, M. Takahashi and R. Hatakeyama, Chem. Commun., 2007, 254 RSC.
  19. I. López-Lorente, B. M. Simonet and M. Valcárcel, Analyst, 2014, 139, 290 RSC.
  20. A. Prabhakar, D. K. Chattopadhyay, B. Jagadeesh and K. V. S. N. Raju, J. Polym. Sci., Part A: Polym. Chem., 2005, 43, 1196 CrossRef CAS.
  21. A. Kitaygorodskiy, W. Wang, X. Su-Yuan, Y. Lin, K. A. S. Fernando, X. Wang, L. Qu, B. Chen and S. Ya-Ping, J. Am. Chem. Soc., 2005, 127, 7517 CrossRef CAS PubMed.
  22. L. V. Karabanova, L. M. Sergeeva, A. V. Svyatyna, P. N. Yakushev, L. M. Egorova, V. A. Ryzhov and V. A. Bershtein, J. Polym. Sci., Part B: Polym. Phys., 2007, 45, 963–975 CrossRef CAS.
  23. S. A. Gurusamy-Thangavelu, S. J. Emond, A. Kulshrestha, M. A. Hillmyer, C. W. Macosko, W. B. Tolman and T. R. Hoye, Polym. Chem., 2012, 3, 2941 RSC.

Footnote

Electronic supplementary information (ESI) available: Materials, synthesis and characterization of [OH]n–SWCNTs, control PU and nanocomposites films. FTIR, Raman, TGA and DSC of [OH]n–SWCNTs. TG/DTG, UV-vis DRS, photographs, optical images and tensile profiles of control and PU nanocomposites. See DOI: 10.1039/c4ra07636b

This journal is © The Royal Society of Chemistry 2014