Non-aqueous sol–gel synthesis through a low-temperature solvothermal process of anatase showing visible-light photocatalytic activity

Mohamed Karmaoui*a, David M. Tobaldib, Andrijana Sever Skapinc, Robert C. Pullarbd, Maria P. Seabrab, João A. Labrinchab and Vitor. S. Amarala
aDepartment of Physics and CICECO, University of Aveiro, Campus Universitário de Santiago, 3810-193 Aveiro, Portugal. E-mail: karmaoui@ua.pt; Fax: +351 234 401 470; Tel: +351 234 370 200
bDepartment of Materials and Ceramic Engineering/CICECO, University of Aveiro, Campus Universitário de Santiago, 3810-193 Aveiro, Portugal
cSlovenian National Building and Civil Engineering Institute, Dimičeva 12, SI-1000 Ljubljana, Slovenia
dDepartment of Materials, Imperial College London, London, SW7 2AZ, UK

Received 17th July 2014 , Accepted 5th September 2014

First published on 8th September 2014


Abstract

A novel, facile method based on a non-aqueous sol–gel solvothermal process has been developed to synthesise spherical TiO2 nanoparticles (NPs) in one pot. The reaction between titanium(IV) tert-butoxide (Ti[OC(CH3)3]4) and benzyl alcohol was a simple process, which resulted in the formation of highly crystalline titania NPs with a small size of only 6 nm, and with a correspondingly high surface area. The chemical formation mechanism of the metal oxide NPs has been proposed, and the degree of surface hydroxyls (–OH groups) has been examined. The products of the synthesis were characterised by X-ray powder diffraction (XRPD) using the advanced whole powder pattern modelling (WPPM) method, high-resolution transmission electron microscopy (HR-TEM), thermo-gravimetric analysis (TGA), UV-visible diffuse reflectance spectroscopy (DRS), Fourier transform infrared spectroscopy (FT-IR), and nuclear magnetic resonance (NMR) spectroscopy. The photocatalytic activity (PCA) was evaluated in both the liquid–solid phase, by monitoring the degradation of an organic dye (methylene blue (MB)) under UV-light irradiation, and in the gas–solid phase, by following the degradation of 2-propanol under UV- and visible-light exposures. The synthesized titania powders not only exhibited excellent photocatalysis in the liquid–solid phase (under UV irradiation), but also possessed a superior PCA in the gas–solid phase under a visible-light exposure. The effects on the PCA of the very small crystalline domain size, surface composition and the presence of organic molecules due to the synthesis process of the TiO2 NPs were shown to account for this behaviour.

Introduction

After the discovery of the “Honda–Fujishima effect” in titania in 1972, semiconductor photocatalysis has continuously attracted a growing interest. This effect was first observed for photo-electrochemical water splitting using a single-crystal titania electrode and a Pt counter-electrode.1 Semiconductor photocatalysis are currently applied in anti-pollution and self-cleaning materials, hydrogen generation, solar energy conversion, sensors, photochromic devices and antibacterial agents.2–5 The photocatalytic reactions occur via the action of light of a suitable wavelength.6,7 When a semiconductor is irradiated with photons having energies higher than, or equal to, its energy band gap (Eg), an electron (e) is able to migrate from the valence band to the conduction band, leaving a hole (h+) behind. This photogenerated couple (e–h+) is able to reduce and/or oxidise a pollutant that is adsorbed on the photocatalyst surface.6 Amongst semiconductors, titanium dioxide (titania, TiO2) is the most widely used photocatalyst for several reasons: the reactions take place at mild operating conditions (i.e. at a low level of solar or artificial illumination, room temperature (RT) and atmospheric pressure); chemical additives are not necessary; it has a high chemical stability; the possible intermediates of the reactions are not dangerous, or they are less dangerous than the original pollutant;8 and very persistent pollutants also can be degraded.9 In addition, TiO2 is a relatively low-cost, commercially available and non-toxic product.

Crystallised TiO2 have large number of polymorphs. The most common, in order of abundance, are the rutile, anatase and brookite phases;10 however, other TiO2 polymorphs also exist, including the high-pressure columbite-like,11 baddeleyite-like,12 and cotunnite-like (c-TiO2) structures.13 Among these polymorphs, anatase and rutile are the most utilised ones in photocatalytic applications, although anatase is believed to be more photocatalytically active than the rutile because of its stronger reducing power and better hole-trapping ability.14 There are a wide range of potential environmental heterogeneous photocatalytic applications for TiO2. These include not only the decontamination and disinfection of polluted waters,15 but also interior (indoors) and exterior (outdoor) air treatments. Interior air treatments are attracting increasing interest in order to reduce the contaminants that cause sick building syndrome (SBS), which is attributed to the presence of volatile organic compounds (VOCs) that are often present in modern indoor environments.16–18 Moreover, titania also has a high antibacterial activity. If the TiO2 photocatalysts are irradiated by a light exceeding the band-gap wavelength, they can also be used to inactivate/kill the bacteria that are present on the photocatalyst surface, making those surfaces self-sterilising. These reactions are based on the strong oxidising power of TiO2, which are usually under UV irradiation. TiO2 is unlike the usual chemical antibacterial reagents that inactivate the cell viability but continue to release pyrogenic and toxic ingredients (such as endotoxins) even after the bacteria have been killed. The photocatalytic self-sterilising surfaces operate in a passive mode that is without needing any electrical power or chemical reagents; only light and oxygen are required. Moreover, they do not release toxic compounds.19,20 Titanium dioxide nanoparticles have been synthesized using several methods, which are summarised and well documented in the literature.21,22 Depending on the method of synthesis, different properties can be tailored, and can be easily changed. Amongst the reported processes, the most common are the hydrothermal and solvothermal methods, which involve the precipitation of precursor in water, organic solvents or ionic liquids, and the precipitate is crystallised by thermal treatment.23,24 The solvothermal route is one of the most extensively applied methods for the synthesis of NPs. Buonsanti et al. developed a novel method to prepare unique TiO2 NPs with branched nanocrystal structures by mixing titanium carboxylate complexes with mixtures of oleic acid and oleyl amine at 240–320 °C.25 One of the major advantages of the non-aqueous sol–gel (NASG) route is that it provides a practical route to prepare crystalline inorganic oxide nanoparticles in water-free systems, and it has been used to prepare a large variety of metal oxide nanoparticles.26

Here, we use a novel “benzyl alcohol route” with the aim of producing nanosized titania particles. The as-synthesized undoped TiO2 NPs were designed to be a photocatalyst that gets activated under the visible-light. Their photocatalytic activity (PCA) was assessed in both the liquid–solid and gas–solid phase by monitoring the degradation of an organic dye and 2-propanol, respectively. The enhanced visible-light PCA of the synthesized NPs is discussed in detail. The photocatalytic properties of the nanoparticles were tested under optimised experimental conditions, and we compared the PCA of the as-prepared TiO2 NPs via the NASG route with that of the commercial Evonik Aeroxide P25 (P25) titania photocatalyst. The NASG synthesized NPs showed a good efficiency compared to the commercially used P25.

Results and discussion

Synthesis and structural and morphological characterisation

The solvothermal method is one of the most robust procedure for the fabrication of various metal oxide nanostructures.27 Here, the TiO2 NPs have been synthesized via a non-aqueous sol–gel route by the condensation of a titanium precursor with alcohol. In a simple one-pot reaction process, highly crystalline anatase TiO2 NPs are obtained by the condensation of titanium(IV) tert-butoxide and benzyl alcohol at 180 °C.

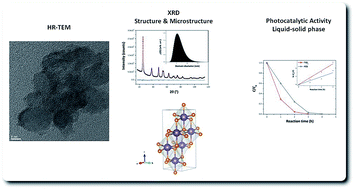
The X-ray powder diffraction (XRPD) pattern is shown in Fig. 1 (XRPD results of the commercial reference are reported in Fig. S1). All the diffraction peaks for the synthesized TiO2 NPs can be readily indexed to be of tetragonal TiO2 anatase phase (ICDD PDF-2 card no. 21-1272), and no impurity phases are detected, confirming the high purity of the obtained product. The pattern matches the space group I41/amd (D194h), and the unit cell parameters were found to be a = b = 3.7865 ± 1 × 10⁻⁴ Å, and c = 9.4999 ± 1 × 10⁻⁴ Å. The average crystalline domain size – obtained by the whole powder pattern modelling (WPPM) method28–30 – was estimated to be 6.4 ± 0.1 nm, with a little dispersion around the tail. The mode of the lognormal size distribution was found to be 5.3 ± 0.1 nm (Fig. 1). In regards to the dislocation density, this synthesis method obtained an anatase with approximately same number of edge and screw dislocations, with values of ρe = 1.1 ± 0.1 × 10¹⁵ m2 and ρs = 1.0 ± 0.1 × 10¹⁵ m2, respectively.


image file: c4ra07214f-f1.tif
Fig. 1 XRPD pattern and output of the WPPM (the black open squares represent the observed data, the red continuous line is the calculated data and the blue continuous line at the bottom is the residual curve). The inset shows the crystalline domain size distribution from the WPPM. The agreement factors of the WPPM are as follows: Rwp = 2.85%, Rexp = 2.01%, χ2 = 1.42.

These values are comparable with those reported by the authors for an unmodified anatase that has been thermally treated at 450 and 600 °C.31 However, these are lower than the dislocation values reported by Ghosh et al. for an anatase made via flame combustion chemical vapour condensation and annealed at 400 °C.32 Moreover, the titania prepared with this NASG method gave a screw dislocation number that is approximately 15 fold lower than that of the P25 reference sample (1.0 versus 15.7, respectively).33

Transmission electron microscopy (TEM), and high resolution TEM (HR-TEM) were used to study the morphology of the TiO2 NPs (the size, shape and arrangement of the particles) to obtain crystallographic information, which are shown in Fig. 2. An illustrative TEM micrograph of the TiO2 nanoparticles is depicted in Fig. 2a. The HR-TEM observations (presented in Fig. 2b–d) reveal that the as-obtained TiO2 NPs have a single crystalline structure.


image file: c4ra07214f-f2.tif
Fig. 2 TEM image of the TiO2 NPs synthesized at 180 °C (a). HR-TEM images of the assemblies of TiO2 NPs (b–d). The parallel red lines in (d) show a d-spacing of 3.6 Å for the (101) lattice plane.

Some of the NPs are almost spherical (Fig. 2b), whereas others are faceted and more elongated (Fig. 2c). The TEM image indicates size of approximately 6 nm, confirming the results obtained via the WPPM method. In Fig. 2d, the HR-TEM image shows well defined lattice fringes with a d-spacing of ∼3.6 Å, corresponding to the (101) lattice plane of the anatase TiO2 crystal structure.

In order to identify the functional groups that are present on the surface of the prepared TiO2 NPs after the reaction, Fourier transform infrared spectroscopy (FT-IR) and liquid nuclear magnetic resonance (NMR, 13C) analyses were performed.

In the FT-IR spectra (Fig. 3), a broad adsorption can be noted at 3426 cm−1 corresponding to the vibrational frequencies of OH groups that are terminated on the TiO2 surface. A series of small sharp bands in the regions of 1400, 1408, 1451, and 1635 cm−1 can be attributed to the C[double bond, length as m-dash]O stretching vibration and bending vibrations of OH groups.34


image file: c4ra07214f-f3.tif
Fig. 3 FT-IR spectra of the as synthesized titanium dioxide NPs (fresh and after 24 h of UV irradiation), and the commercial P25 TiO2.

The obtained FT-IR spectra of both the freshly synthesized TiO2 and the as-synthesized TiO2 after 24 h of UV irradiation are very similar. The bands observed at 1635 cm−1 and 1451 cm−1 can be attributed to the asymmetric (νas) and symmetric (νs) stretching frequencies of carboxylate groups, respectively. The frequency separation of these bands (Δν ≈ 184 cm−1) suggests a bridging bidentate coordination, showing that only benzoate (C6H5COO) species are adsorbed on the surface of these TiO2 NPs.35 The low wavenumber region mainly shows a broad band at 1000 cm−1 and below that corresponds to the metal–oxygen–metal (Ti–O–Ti) stretching and bending vibrational modes. For the commercial TiO2 samples, the same bands were observed as those for the synthesized titania at around 3420 and 1635 cm−1, corresponding to the surface-adsorbed water and hydroxyl groups, and to the bending vibrations of OH, respectively. These bands are stronger for the commercial sample than for the synthesized titania, suggesting that the commercial P25 photocatalyst has more hydroxyl groups adsorbed on its surface. The Ti–O–Ti stretching modes are in the 400–600 cm−1 wavelength range.

In order to thoroughly understand the procedure of the crystal growth, the following mechanism was developed that explains the chemical formation process of the TiO2 NPs. It is expected that the condensation between R–OH and Ti–OR will lead to the formation of Ti–O–Ti bridges with ether elimination.

In order to assess the nature of the reaction mixture and the species that are observed after the reaction, 13C NMR studies were performed on the sample (after removal of the TiO2 NPs by centrifugation), which are shown in Fig. S2. In addition to benzyl alcohol, significant amounts of other organic solvents, such as tert-butyl alcohol, di-tert-butyl ether and benzyl ether, were found.

Interestingly, alcohol and dibenzyl ether are the only species that are observed to be dominant organic compounds on the surface. A similar mechanism was proposed by Garnweitner et al. to describe the synthesis of HfO2 nanocrystals.36 Based on the HfO2 mechanism, the mechanism of TiO2 formation was expected to consist of two steps: the first step is the initial attack of phenyl methanol group on the Ti metal centre, leading to the formation of (benzyloxy)tri-tert-butoxytitanium intermediate (titanium alkoxide complex); this is followed by the production of butanol (alcoholysis, Scheme 1 in Fig. 4). The second step is the condensation of two titanium complexes leading to an elimination of ether ((oxybis(methylene))dibenzene) (condensation, Scheme 2 in Fig. 4).


image file: c4ra07214f-f4.tif
Fig. 4 Proposed reaction mechanism occurring during the non-aqueous synthesis of TiO2 oxide nanoparticles in benzyl alcohol.

The product of this reaction is the eliminated ether; similar products have been already observed for various metal oxides synthesized in benzyl alcohol.

With the aim of defining the thermal stability of the NPs, the thermal behaviour of the sample was investigated by TGA measurement from RT to 800 °C, which is shown in Fig. S3. The TG curve, obtained under air, shows that there is a three-step weight loss process. A first sharp weight loss occurred in the temperature range between room temperature and 100 °C, indicating the loss of water molecules (2 wt% loss), and then the more gradual removal of the excess solvent and other organic species up to 350 °C (benzyl alcohol is known to start desorbing at around 150 °C)37 accounted for the loss of further 3 wt%.

The third step occurred in the temperature range ∼400–600 °C, involving a 6% weight loss that can be attributed to the decomposition of the remaining organic species, such as benzoate molecules, which were observed to be present at room temperature in the FT-IR spectra. There is no obvious weight loss when the temperature is higher than 630 °C, indicating that the product is thermally stable between 630–800 °C.

The transformed reflectance spectra as a function of the photon energy are depicted in Fig. 5. The resulting optical band gap of the sample was found to be equal to 3.24 eV (382 nm) (cf. Table 1), which is in well accordance with the expected Eg value of anatase of 3.22 eV (385 nm).38


image file: c4ra07214f-f5.tif
Fig. 5 Kubelka–Munk elaboration versus energy for the titania powder (as-synthesized and after 24 h of UV irradiation) the reference commercial sample, P25. The short-dashed black line represents the x-axis intercept of the line that is tangent to the inflection point of the curve for synthesized anatase (apparent optical Eg) calculated using the Tauc procedure.
Table 1 Photocatalytic activities under UV-light exposure – in the liquid– and gas–solid phases and under visible-light exposure – in the gas–solid phase, specific surface areas (SSA) and optical energy band gaps (Eg), calculated using the Tauc procedure of the tested titania samples
Sample Activity under UV-light irradiation Activity under visible-light irradiation Eg (eV)
Liquid–solid phase Gas–solid phase Gas–solid phase
ξ (%) kapp (h−1) R2 Acetone formation (ppm h−1) Acetone formation (ppm h−1) SSABET (m2 g−1)
a The total reaction time was 3 h.b The total reaction time was 4 h.c From ref. 44.
TiO2 100 1.71 ± 0.11a 0.98 102 30 95.0 3.24 ± 0.01
P25 100 1.17 ± 0.12b 0.95 533 23c 52.5 3.10 ± 0.02
TiO2 24 h UV 193 23


Moreover, the results of the FT-IR analysis in Fig. 3 and DRS analysis in Fig. 5 show that the phenyl rings of the benzoate complex attached to the surface of TiO2 NPs are responsible for the enhanced absorption in the visible region, as shown in Fig. 5.

Photocatalytic activity (PCA) results

The PCA results for the powders are depicted in Table 1 (all data) and Fig. 6 (liquid–solid phase only). The results in both the liquid–solid and gas–solid phase showed a good reproducibility; however, they are not directly comparable because they involve different target pollutants that are in different phases and different initial concentrations, and involve the different initial amounts of photocatalyst. Moreover, different lamps and reactors were used. Therefore, they will be separately discussed.
image file: c4ra07214f-f6.tif
Fig. 6 Photocatalytic activity of the synthesized titania nanopowder, and of the reference commercial sample, P25, tested in the liquid–solid phase under UV-light irradiation. In the inset is reported the ln (C0/C) versus reaction time.

In the liquid–solid phase, under UV-light exposure, the prepared titania completely degraded an organic compound (methylene blue, MB) after 3 h of irradiation time (ξ = 100%, with a calculated averaged rate constant of 1.71 h−1). Fig. S5 shows the three individual results of the PCA, highlighting the significant reproducibility of this photocatalyst without the need of any oxygen supply. It is well known that under these conditions MB undergoes mineralisation forming final products such as CO2, SO42−, NH4+ and NO3.39 However, the reference commercial sample required 4 h of irradiation time to achieve a photocatalytic efficiency value of ξ equal to 100, and the rate constant was only 1.17 h−1. It is also clear that the TiO2 NPs prepared via the NASG route were considerably more efficient in removing MB after 1 and 2 hours of irradiation. Photocatalytic activity is affected by several factors, such as the phase composition, size of the photocatalyst, level of crystallinity, and surface properties (i.e. SSA, and/or surface hydroxyl groups).40–43 The P25 sample had a lower but comparable PCA and it degraded the model pollutant in 4 h of irradiation time versus 3 h for the as-prepared TiO2 NPs. P25, which is a mixture of anatase, rutile and amorphous phases, has an anatase mean crystalline domain size of 15.5 nm, whereas that of the rutile is 19.3 nm.33 This is considerably larger than the as-prepared TiO2 NPs of 6 nm. Moreover, P25 also has a lower SSA that is approximately half of our TiO2. These above mentioned parameters along with the larger hydrodynamic diameter of P25 (cf. Fig. S4) should explain its lower activity in the liquid–solid phase compared to our NASG-derived TiO2 NPs.

In the gas–solid phase under UV-light exposure, the reference commercial titania sample had a higher PCA compared to the synthesized anatase, which can be attributed to the greater number of surface hydroxyl groups adsorbed on the photocatalyst surface, as detected by FT-IR analysis. Moreover, in the gas–solid phase, the experimental conditions were different than those in the liquid–solid phase: the powders were not stirred in a liquid medium, but they were constrained in the form of a thin layer (cf. the section: Evaluation of photocatalytic activity).

However, under the visible-light irradiation, an opposite behaviour was observed. The synthesized titania was observed to have a slightly greater PCA compared to the control P25 powder in the studied system, with an acetone formation rate of 30 ppm h−1 against 23 ppm h−1, respectively. P25 is known to be responsive in the visible-light because of the presence of small rutile domains among the anatase. The points of contact between the anatase and rutile crystals allow a rapid electron transfer from rutile to anatase, and thus the rutile acts as an “antenna” that is able to extend the PCA in visible wavelengths.45

Although the Eg of the prepared powder – 3.24 eV (382 nm) – is consistent with that expected for anatase, the presence of benzoate that was detected by the FT-IR and DRS analyses clearly extended the absorption edge into the visible region. This enables TiO2 to absorb photons in the visible-light range, thus making it photocatalytically active under visible-light irradiation.

Moreover, with the aim of verifying the stability of the prepared photocatalyst (i.e. the degradation of the attached phenyl rings of the benzoate complex because of photocatalysis under UV-light exposure), the prepared sample was subjected to UV-light irradiation for consecutive 24 hours (the light intensity reaching the samples was equal to 22 W m−2). Subsequently, the PCA in the gas–solid phase under visible light irradiation was measured again using the same experimental procedure as that for the as-prepared TiO2 sample. As depicted in Fig. 3, the phenyl rings of the benzoate complex attached to the surface of the TiO2 NPs are still present. In addition, 24 h of UV-light irradiation led to a decrease in the adsorption of OH groups on the surface of the photocatalyst, making the adsorption band at around 3426 cm−1 less intense. Furthermore, as observed in Fig. 5, after 24 h of UV-light exposure our TiO2 sample maintained the same visible absorption (though it was a bit less intense compared to the as-synthesized sample), confirming that most of those phenyl rings are still attached to the TiO2 surface despite the 24 h UV exposure. In addition, this is also confirmed by the PCA results, as shown in Table 1. Even after 24 h of UV irradiation, TiO2 synthesized via the NASG method still had an appreciable PCA, which was considerably similar to the commercial P25 sample.

Thus, it can be concluded that the presence of the phenyl rings of the benzoate complex that are attached to the surfaces of TiO2 NPs plays an important role in the visible range of the synthesized TiO2 compared to the commercial sample, as seen in the FT-IR and DRS spectra of the powder (cf. Fig. 3 and 5). This gives the anatase nanopowder produced by the sol–gel route a superior PCA under the visible-light irradiation.

Conclusions

Monophasic anatase nanocrystals were obtained by a non-aqueous sol–gel chemical route. The solvothermal reaction in alcohol, at a low temperature of 180 °C, provides a suitable non-aqueous process to achieve highly nanocrystalline TiO2 with a uniform shape with an average crystalline domain size of ∼6 nm. The chemical formation mechanism of these TiO2 NPs involves the condensation of metal alkoxides, leading to the formation of Ti–O–Ti bridges.

The non-aqueous sol–gel route played a significant role in tuning the visible light photocatalytic properties of the TiO2 NPs. Benzoate molecules attached to the surface of the TiO2 NPs, as observed by FT-IR analysis, greatly enhanced the photocatalytic properties of the TiO2 particles under visible-light exposure in the gas–solid phase, without the use of doping agents and without compromising the natural PCA of the titania under UV-light irradiation in both the gas– and liquid–solid phases.

Experimental

Chemicals and materials

Titanium(IV) tert-butoxide Ti[OC(CH3)3]4 (97%) and anhydrous benzyl alcohol (99%) from Aldrich were used.

Synthesis of TiO2 nanoparticles

The synthesis was carried out in a glove box (O2 and H2O < 1 ppm). In a typical procedure, 1 mmol (0.34032 g) of titanium tert-butoxide(IV) Ti[OC(CH3)3]4 was added to 20 mL of anhydrous benzyl alcohol. Subsequently, the reaction mixture was transferred into a stainless steel autoclave and carefully sealed.

The autoclave was taken out from the glove box and heated in a furnace at 180 °C for 1 day. The resulting milky suspensions were centrifuged, and the precipitates were thoroughly washed with ethanol and dichloromethane, and dried in air at 60 °C.

Characterisation of TiO2 nanoparticles

With the aim of detecting any agglomerations in the liquid-phase of the synthesized and commercial titania samples, their size distributions were measured via photon correlation spectroscopy (PCS), also known as dynamic light scattering (DLS), using Zetasizer Nano ZS (Malvern Instruments, UK). A small amount of the powder was added into a cuvette filled with distilled and filtered water, which was ultrasonically dispersed for 10 min, and measurements were performed at RT after allowing it to stabilise for 10 min. The scattering was measured at an angle of 173°, using a 633 nm laser and under the assuming that the refractive indexes of water and the TiO2 particles are 1.33 and 2.50, respectively.

XRPD measurements for the crystalline domain size evaluation were performed at room temperature on the dried nanopowders using a PANalytical X'Pert-MPD θ/2θ diffractometer equipped with a fast RTMS detector using monochromated CuKα radiation in the 2θ range of 20–115° with a virtual step scan of 0.013°, and a virtual integration time of 1300 s per step. The incident beam optics included a 0.04 rad Soller slit, a 10 mm fixed mask, a 0.5° fixed divergence slit and a 1° anti-scatter slit. The diffracted beam optics included a 0.04 rad Soller slit and a 6.6 mm anti-scatter slit. The WPPM method28–30 was employed using the PM2K software46 for the microstructural analysis of the powders. The diffraction peak profile results from a convolution of instrumental and sample-related physical effects, and thus WPPM allows one to extract microstructural information from a diffraction pattern in order to fit the experimental peaks without the use of arbitrary analytical functions (i.e. Gaussian, Lorentzian, or Voigtian).

In this way, the analysis is made directly in terms of the physical models of the microstructure and/or the lattice defects.27,31,41 The instrumental contribution was obtained by modelling a large set of peak profiles from the NIST SRM 660b standard (LaB6) according to the relationship proposed by Caglioti et al.47 The background (modelled using a 4th-order of the shifted Chebyshev polynomial function), peak intensities, specimen displacement and anatase lattice parameters were then refined. Crystalline domains were assumed to be spherical (as detected by TEM/HR-TEM observations), and distributed according to a lognormal size distribution. We also assumed that dislocations were the principal source of anisotropy, and thus they were the major defect present in titania. Therefore, the presence of both edge and screw dislocations (with densities of ρe and ρs, respectively) have been presumed in this work in the 〈10[1 with combining macron]〉{101} slip system (Burgers vector being equal to (a02 + c02)1/2, with a0 and c0 as the lattice parameters).31,48

Transmission electron microscopy (TEM) was performed using a Jeol-2000 FXII microscope, with point-to-point and line-to-line resolutions of 0.28 nm and 0.14 nm, respectively. High resolution TEM (HR-TEM) was performed using a JEOL 2200FS microscope with a field emission gun operated at 200 kV. Samples for TEM/HR-TEM observations were prepared by dispersing the nanoparticles in ethanol and evaporating the suspension drops on carbon-coated copper grids.

Fourier transform infrared spectroscopy (FT-IR, Mattson 5000) was carried out in the range of 4000–450 cm−1 in transmission mode. The pellets were prepared by the addition of 1–2 mg of the nanopowder to 100 mg of KBr. The mixture was then carefully mixed and compressed at a pressure of 10 kPa to form transparent pellets.

To evaluate the formation mechanism, the reaction solution obtained by the centrifugation of the solid material was subjected to nuclear magnetic resonance (NMR) spectroscopy analysis. NMR was performed on a Bruker instrument at 300 MHz using CDCl3 as the solvent.

The thermal behaviour of the nanopowders was investigated with a thermoanalyser (Netzsch Sta 409C/CD). The sample was recorded at a scan rate of 10 °C min−1 from RT to 800 °C under the air atmosphere.

Optical spectra of the samples, followed by their Eg values, were acquired on a Shimadzu UV 3100 spectrometer in the UV-vis range (250–700 nm) with a step-size of 0.2 nm using BaSO4 as the reference. The Kubelka–Munk function was applied with the aim of converting the diffuse reflectance into the absorption coefficient α as follows:

 
image file: c4ra07214f-t1.tif(1)
where K and S are the absorption and scattering coefficients and the reflectance R is equal to Rsample/Rstandard.49

The Eg of the samples was calculated using a Tauc plot. The method assumes that the absorption coefficient α (eqn (1)) of a semiconductor can be expressed as follows:

 
(αhν)γ = A(Eg) (2)
where A is a material constant, h is the Planck's constant, ν is the frequency of the light, Eg is the energy band gap of the allowed transitions, and γ is the power coefficient characteristic for the type of transition. For nanoscale semiconductor materials, the value of γ is accepted to be equal to 1/2 because for such materials, the transition is assumed to be indirectly allowed.50 Therefore, by plotting [F(R)]0.5 against , the energy band gap of the semiconductor material from the x-axis (α = 0) intercept of the line that is tangent to the inflection point of the curve can be obtained. This was found by fitting the transformed Kubelka–Munk equation [F(R)]0.5 versus the photon energy () with a sigmoidal Boltzmann function. The Eg value was subsequently obtained from the x-axis intercept of the line that is tangent to the inflection point of that curve.

The specific surface area (SSA) of the prepared samples was evaluated by the Brunauer–Emmett–Teller (BET) method (Micromeritics Gemini 2380, US) using N2 as the adsorbate gas.

Evaluation of photocatalytic activity (PCA)

The PCA of the prepared TiO2 was evaluated under both UV-light and visible-light irradiation. Both liquid–solid and gas–solid tests were performed in triplicate, and the reported results are the averaged values.

The experiments under the exposure of UV-light were carried out in both the liquid–solid and gas–solid phases by monitoring the degradation rates of an organic dye (methylene blue, MB) and 2-propanol, respectively. The tests using the visible-light irradiation were carried out in only the gas–solid phase by monitoring the degradation of 2-propanol. This was employed as the model pollutant because its degradation rate is more reliable than the degradation rates of the organic dyes that were used in the tests to evaluate the PCA in the visible light region. In fact, dyes can be excited by visible-light irradiation, which can consequently act to be a sensitizer with electron injection from the photo-excited dye to the photocatalyst.51,52 Thus, this electron transfer may destroy the regular distribution of conjugated bonds within the dye molecule, and cause its decolourisation, but not its mineralisation.53,54

The photocatalytic tests in the liquid–solid phase were assessed by monitoring the degradation of MB (Aldrich) using a spectrometer (Shimadzu UV 3100, JP).

The tests were performed at RT in a cylindrical photocatalytic reactor (100 mm in diameter) containing an aqueous solution of the dye (1 L) at an initial concentration of 5 mg L−1.

The concentration of the photocatalyst in the slurry was 0.25 g L−1. To thoroughly mix the solution, the slurry was magnetically stirred throughout the reaction, and the reactor was covered with a watch-glass in order to avoid the evaporation of the solution.

The reacting system was illuminated by placing two lamps on the either side of the reactor; the distance between the lamps and the reactor was 5 cm. The UV-light source was a germicidal lamp (Philips PL-S 9W, NL) having an irradiance of approximately 13 W m−2 in the UVA range. In the experiments, the photocatalytic degradation of MB was monitored by sampling about 4 mL of the slurry from the reactor at regular time intervals.

Before switching on the lamps, the suspension was stirred in the dark for 30 min to allow the adsorption/desorption of MB onto the powder. The powder in the samples was separated by centrifugation, and the MB concentration in the liquid was then determined using the Lambert–Beer law. The absorbance was measured by a spectrometer at a wavelength of 665 nm using distilled water as the reference. The extent of MB photocatalytic degradation ξ was evaluated by the following equation:

 
image file: c4ra07214f-t2.tif(3)
where C0 is the initial MB concentration and CS is the concentration after a certain UV irradiation time. Control experiments to detect the photolysis of the MB dye under direct UV-light irradiation were performed prior to the testing of the PCA of the prepared samples.

The MB photolysis was considered to be negligible, with a ξ value equal to ∼3% after 7 h of UVA irradiation time (datum not reported in the graph of Fig. 5).

The device employed for the gas–solid phase tests was a cylindrical reactor (1.4 L in volume) covered by quartz glass and connected by Teflon tubes to the FT-IR spectrometer, and the whole system was hermetically sealed. A more detailed description of the method has been presented elsewhere.55,56

The light source was a 300 W Xenon lamp (Newport Oriel Instruments, US), having a light intensity of approximately 30 W m−2 in the λ range of 300–400 nm, and 300 W m−2 in the λ range of 400–800 nm. Visible light irradiation was achieved using a filter at 400 nm. The light intensity was approximately zero in the λ range of 300–400 nm and 160 W m−2 in the λ range of 400–800 nm. The samples were prepared in the form of a thin layer of powder, with a constant mass (about 50 mg) and thus with an approximately constant thickness, in a Petri dish with a diameter of 6 cm. The working distance between the Petri dish and the lamp was 6 cm. The relative humidity in the reacting system was kept constant in the range of 25–30% using an air flow through molecular sieves until a pre-defined humidity was attained.

Each experiment was performed by injecting 5 μL of 2-propanol (∼1100 ppm in the gas phase), which was used as a model VOC species, into the reacting system through a septum. The total reaction time was set at 20 h, and the lamp was turned on after a certain period of time of the 2-propanol injection to allow an equilibration of 2-propanol adsorption/desorption onto the powder.

The 2-propanol degradation and the acetone formation–degradation processes were followed by monitoring the calculated area of their characteristic peaks at 951 cm−1 and 1207 cm−1, respectively, using a FT-IR spectrometer (Perkin Elmer Spectrum BX, US). The PCA was evaluated using the rate constant of the initial acetone formation because at RT the photocatalytic oxidation of 2-propanol to form acetone is fast, whereas the subsequent oxidation of acetone to CO2 and H2O is slower. Thus, the degradation path of 2-propanol can be given as 2-propanol → acetone → CO2 + H2O.57 Therefore, the formation of acetone characteristic and can be distinguished from the subsequent photo-oxidation.58 The accuracy of the employed method was estimated to be 0.5 ppm h−1.

The commercial photocatalytic powder Evonik Aeroxide P25, which is a mixture of anatase (76.3 wt%; average crystalline domain diameter of 15.5 nm), rutile (10.6 wt%; 19.3 nm), and amorphous phases (13.0 wt%)33 with a specific surface area of 52.5 m2 g−1, was used for comparison in all the PCA tests.

Acknowledgements

Mohamed Karmaoui thanks N. J. O. Silva and Prof. A. M. S. Silva (University of Aveiro, Portugal), the former for the contribution to the study of the TiO2 NPs, the latter for the NMR measurements and his fruitful discussions. D. M. Tobaldi is grateful to the ECO-SEE project (funding from the European Union's Seventh Framework Programme for research, technological development and demonstration under grant agreement no. 609234. Note: the views expressed are purely those of the authors and may not in any circumstances be regarded as stating an official position of the European Commission). The authors would also like to acknowledge M. Ferro for microscopy analysis, which was supported by RNME-Pole University of Aveiro FCT Project REDE/1509/RME/2005. PEst-C/CTM/LA0011/2013 programme is also acknowledged. M. P. Seabra and R. C. Pullar wish to thank the FCT Ciência 2008 programme for supporting this work.

Notes and references

  1. A. Fujishima and K. Honda, Nature, 1972, 238, 37–38 CrossRef CAS.
  2. B. O'Regan and M. Grätzel, Nature, 1991, 353, 737–740 CrossRef.
  3. M. R. Hoffmann, S. T. Martin, W. Choi and D. W. Bahnemann, Chem. Rev., 1995, 95, 69–96 CrossRef CAS.
  4. Y. Ohko, T. Tatsuma, T. Fujii, K. Naoi, C. Niwa, Y. Kubota and A. Fujishima, Nat. Mater., 2002, 2, 29–31 CrossRef PubMed.
  5. X. Chen, S. Shen, L. Guo and S. S. Mao, Chem. Rev., 2010, 110, 6503–6570 CrossRef CAS PubMed.
  6. A. Fujishima, T. N. Rao and D. A. Tryk, J. Photochem. Photobiol., C, 2000, 1, 1–21 CrossRef CAS.
  7. A. Fujishima, X. Zhang and D. Tryk, Surf. Sci. Rep., 2008, 63, 515–582 CrossRef CAS PubMed.
  8. F. Arsac, D. Bianchi, J. M. Chovelon, P. Conchon, C. Ferronato, A. Lair and M. Sleiman, Mater. Sci. Eng., C, 2008, 28, 722–725 CrossRef CAS PubMed.
  9. J.-M. Herrmann, C. Duchamp, M. Karkmaz, B. T. Hoai, H. Lachheb, E. Puzenat and C. Guillard, J. Hazard. Mater., 2007, 146, 624–629 CrossRef CAS PubMed.
  10. J. Muscat, V. Swamy and N. Harrison, Phys. Rev. B: Condens. Matter Mater. Phys., 2002, 65, 224112 CrossRef.
  11. J. Haines and J. M. Léger, Phys. B, 1993, 192, 233–237 CrossRef CAS.
  12. H. Sato, S. Endo, M. Sugiyama, T. Kikegawa, O. Shimomura and K. Kusaba, Science, 1991, 251, 786–788 CAS.
  13. L. S. Dubrovinsky, N. A. Dubrovinskaia, V. Swamy, J. Muscat, N. M. Harrison, R. Ahuja, B. Holm and B. Johansson, Nature, 2001, 410, 653–654 CrossRef CAS PubMed.
  14. J. Augustynski, Electrochim. Acta, 1993, 38, 43–46 CrossRef CAS.
  15. S. Malato, P. Fernández-Ibáñez, M. I. Maldonado, J. Blanco and W. Gernjak, Catal. Today, 2009, 147, 1–59 CrossRef CAS PubMed.
  16. T. N. Obee and R. T. Brown, Environ. Sci. Technol., 1995, 29, 1223–1231 CrossRef CAS PubMed.
  17. A. G. Agrios and P. Pichat, J. Appl. Electrochem., 2005, 35, 655–663 CrossRef CAS PubMed.
  18. J. Chen and C. Poon, Build. Sci., 2009, 44, 1899–1906 Search PubMed.
  19. K. Sunada, Y. Kikuchi, K. Hashimoto and A. Fujishima, Environ. Sci. Technol., 1998, 32, 726–728 CrossRef CAS.
  20. K. Sunada, T. Watanabe and K. Hashimoto, J. Photochem. Photobiol., C, 2003, 156, 227–233 CrossRef CAS.
  21. X. Chen and S. S. Mao, Chem. Rev., 2007, 107, 2891–2959 CrossRef CAS PubMed.
  22. T. Fröschl, U. Hörmann, P. Kubiak, G. Kučerová, M. Pfanzelt, C. K. Weiss, R. J. Behm, N. Hüsing, U. Kaiser, K. Landfester and M. Wohlfahrt-Mehrens, Chem. Soc. Rev., 2012, 41, 5313 RSC.
  23. L. Chen, K. Rahme, J. D. Holmes, M. A. Morris and N. K. Slater, Nanoscale Res. Lett., 2012, 7, 297 CrossRef PubMed.
  24. K. Sabyrov, N. D. Burrows and R. L. Penn, Chem. Mater., 2013, 25, 1408–1415 CrossRef CAS.
  25. R. Buonsanti, E. Carlino, C. Giannini, D. Altamura, L. De Marco, R. Giannuzzi, M. Manca, G. Gigli and P. D. Cozzoli, J. Am. Chem. Soc., 2011, 133, 19216–19239 CrossRef CAS PubMed.
  26. M. Niederberger and G. Garnweitner, Chem.–Eur. J., 2006, 12, 7282–7302 CrossRef CAS PubMed.
  27. N. Pinna and M. Niederberger, Angew. Chem., Int. Ed., 2008, 47, 5292–5304 CrossRef CAS PubMed.
  28. P. Scardi and M. Leoni, Acta Crystallogr., Sect. A: Found. Crystallogr., 2002, 58, 190–200 CrossRef CAS PubMed.
  29. P. Scardi, M. Leoni and M. D’Incau, Z. Kristallogr., 2007, 222, 129–135 CrossRef CAS PubMed.
  30. P. Scardi and M. Leoni, in Diffraction Analysis of the Microstructure of Materials, ed. E. J. Mittemeijer and P. Scardi, Springer-Verlag., Berlin, 2004, pp. 51–92 Search PubMed.
  31. D. M. Tobaldi, R. C. Pullar, M. Leoni, M. P. Seabra and J. A. Labrincha, Appl. Surf. Sci., 2013, 287, 276–281 CrossRef CAS PubMed.
  32. T. B. Ghosh, S. Dhabal and A. K. Datta, J. Appl. Phys., 2003, 94, 4577 CrossRef CAS PubMed.
  33. D. M. Tobaldi, R. C. Pullar, M. P. Seabra and J. A. Labrincha, Mater. Lett., 2014, 122, 345–347 CrossRef CAS PubMed.
  34. K. D. Dobson and A. J. McQuillan, Spectrochim. Acta, Part A, 2000, 56, 557–565 CrossRef CAS.
  35. G. Deacon, Coord. Chem. Rev., 1980, 33, 227–250 CrossRef CAS.
  36. G. Garnweitner, L. M. Goldenberg, O. V. Sakhno, M. Antonietti, M. Niederberger and J. Stumpe, Small, 2007, 3, 1626–1632 CrossRef CAS PubMed.
  37. M. Niederberger, M. H. Bartl and G. D. Stucky, Chem. Mater., 2002, 14, 4364–4370 CrossRef CAS.
  38. S.-D. Mo and W. Y. Ching, Phys. Rev. B: Condens. Matter Mater. Phys., 1995, 51, 13023–13032 CrossRef CAS.
  39. A. Houas, H. Lachheb, M. Ksibi, E. Elaloui, C. Guillard and J.-M. Herrmann, Appl. Catal., B, 2001, 31, 145–157 CrossRef CAS.
  40. Z. Zhang, C.-C. Wang, R. Zakaria and J. Y. Ying, J. Phys. Chem. B, 1998, 102, 10871–10878 CrossRef CAS.
  41. G. Balasubramanian, D. Dionysiou, M. Suidan, I. Baudin and J. Laine, Appl. Catal., B, 2004, 47, 73–84 CrossRef CAS PubMed.
  42. A. R. Liu, S. M. Wang, Y. R. Zhao and Z. Zheng, Mater. Chem. Phys., 2006, 99, 131–134 CrossRef CAS PubMed.
  43. A. G. Agrios and P. Pichat, J. Photochem. Photobiol., C, 2006, 180, 130–135 CrossRef CAS PubMed.
  44. D. M. Tobaldi, R. C. Pullar, A. S. Škapin, M. P. Seabra and J. A. Labrincha, Mater. Res. Bull., 2014, 50, 183–190 CrossRef CAS PubMed.
  45. D. C. Hurum, A. G. Agrios, K. A. Gray, T. Rajh and M. C. Thurnauer, J. Phys. Chem. B, 2003, 107, 4545–4549 CrossRef CAS.
  46. M. Leoni, T. Confente and P. Scardi, Z. Kristallogr. Supp., 2006, 23, 249–254 CrossRef.
  47. G. Caglioti, A. Paoletti and F. P. Ricci, Nucl. Instrum. Methods, 1960, 9, 195–198 CrossRef CAS.
  48. H. Li and R. C. Bradt, J. Am. Ceram. Soc., 1990, 73, 1360–1364 CrossRef CAS PubMed.
  49. A. S. Marfunin, Physics of Minerals and Inorganic Materials: An Introduction, Springer-Verlag, 1979 Search PubMed.
  50. N. Serpone, D. Lawless and R. Khairutdinov, J. Phys. Chem., 1995, 99, 16646–16654 CrossRef CAS.
  51. M. Vautier, C. Guillard and J.-M. Herrmann, J. Catal., 2001, 201, 46–59 CrossRef CAS.
  52. X. Yan, T. Ohno, K. Nishijima, R. Abe and B. Ohtani, Chem. Phys. Lett., 2006, 429, 606–610 CrossRef CAS PubMed.
  53. J.-M. Herrmann, Appl. Catal., B, 2010, 99, 461–468 CrossRef CAS PubMed.
  54. J.-M. Herrmann, J. Photochem. Photobiol., C, 2010, 216, 85–93 CrossRef CAS PubMed.
  55. D. M. Tobaldi, A. Tucci, A. S. Škapin and L. Esposito, J. Eur. Ceram. Soc., 2010, 30, 2481–2490 CrossRef CAS PubMed.
  56. M. Tasbihi, U. L. Štangar, A. S. Škapin, A. Ristić, V. Kaučič and N. N. Tušar, J. Photochem. Photobiol., C, 2010, 216, 167–178 CrossRef CAS PubMed.
  57. S. Larson, J. A. Widegren and J. L. Falconer, J. Catal., 1995, 157, 611–625 CrossRef CAS.
  58. Y. Ohko, A. Fujishima and K. Hashimoto, J. Phys. Chem. B, 1998, 102, 1724–1729 CrossRef CAS.

Footnote

Electronic supplementary information (ESI) available: XRD of the reference TiO2, NMR spectrum, PCS data, thermal data, bond lengths, distortion indexes and structural parameters of the synthesized anatase (Table). See DOI: 10.1039/c4ra07214f

This journal is © The Royal Society of Chemistry 2014
Click here to see how this site uses Cookies. View our privacy policy here.