
 Open Access Article
 This Open Access Article is licensed under a Creative Commons Attribution-Non Commercial 3.0 Unported Licence
Synthesis of monocarboxylic acid-modified CeO2 nanoparticles using supercritical water†
Minori
Taguchi
*a,
Naomi
Yamamoto
a,
Daisuke
Hojo
b,
Seiichi
Takami
c,
Tadafumi
Adschiri
bc,
Toshitaka
Funazukuri
a and
Takashi
Naka
d
aDepartment of Applied Chemistry, Faculty of Science and Engineering, Chuo University, 1-13-27 Kasuga, Bunkyo-ku, Tokyo 112-8551, Japan. E-mail: mtaguchi@chuo-u.ac.jp
bWPI, Advanced Institute for Materials Research, Tohoku University, 2-1-1 Katahira, Aoba-ku, Sendai 980-8577, Japan
cInstitute of Multidisciplinary Research for Advanced Materials, Tohoku University, 2-1-1 Katahira, Aoba-ku, Sendai 980-8577, Japan
dNational Institute for Materials Science, 1-2-1 Sengen, Tsukuba 305-0047, Japan
First published on 29th September 2014
Abstract
This study reports a simple, rapid synthesis technique for the preparation of monocarboxylic acid-modified CeO2 nanoparticles. The nanoparticle products were prepared under hydrothermal conditions using supercritical water and Ce(OH)4 as a precursor in the presence of monocarboxylic acids with different alkyl chain lengths (C6–18) acting as surface modifiers. The precursor and surface modifiers were heat-treated in a batch-type reactor at 400 °C for 30 min. The carboxylic acids attached to the surface of the products by coordination bonds between the carboxylate (–COO−) and Ce ions. The amount of attached surface modifiers tended to increase with increasing alkyl chain length. The products exhibited a cubic morphology and particle sizes of approximately 10 nm, controlled by the surface modifiers. Surface modification also controlled the band gap of the products, suggesting the possibility of tuning their electronic and optical properties by using organic surface modifiers.
Introduction
Hybrid organic–inorganic nanoparticles have attracted considerable interest for various applications because they combine the merits of organic molecules, such as wide tunability and structural flexibility, with the physical properties of inorganic nanoparticles including magnetic, electronic, catalytic, and optical properties.1–15 During the formation of hybrid nanoparticles, interactions at the interface between the organic molecules and the crystallite surface of the inorganic nanoparticles control the particle size and morphology of the resulting inorganic structures,1–15 thus affecting their physical properties. In fact, in the case of metal oxides, surface modification enables to control the valence state of metal ions (and the amount of oxygen vacancies, ionic distributions, etc.) in the nanoparticles.13,14 Therefore, the physical properties can be tuned not only by controlling the particle size and morphology but also by surface modification. Additionally, since nanoparticles generally tend to aggregate because of their high surface energy, hybridized organic modifiers can improve their monodispersibility to solvent, thus inhibiting aggregation.15We recently developed a technique for the simple, rapid synthesis of metal oxides and their corresponding nanoparticles though a hydrothermal method using sub- or supercritical water.7–15 This method enables us to prepare not only simple but also surface-modified metal oxides with nanocrystalline structures. The density and dielectric constant of water dramatically change when the conditions are varied between ambient temperature and pressure, and the critical point (374 °C, 22.1 MPa).16,17 Close to the critical point, the dielectric constant of water becomes low, resulting in faster nucleation and crystallization of metal oxides because of the oversaturated metal ions present in the aqueous solution of the precursors.7–15,17 Additionally, sub- or supercritical water behaves like an organic solvent because of its low dielectric constant, which leads to a greater miscibility with organic molecules. Therefore, in the presence of both metal oxide precursors and organic molecules as surface modifiers, the crystallization and surface-modification processes occur sequentially under these conditions. Surprisingly, after this intricate process, the particle size and morphology of the metal oxides are controlled by interactions between the crystallite surface and the organic molecules.
During our studies, we have tried several organic modifiers including hydrophilic polymers.7–10,12–15 Organic modifiers containing a carboxyl group (–COOH) attached to the surface of inorganic nanoparticles by coordination bonds between the carboxylate anion (–COO−) and the metal cation. There are many organic modifiers with a carboxyl group, and they almost do not cause stainless-steel vessels to corrode. Given these advantages, carboxylic acids can be regarded as suitable, stable surface modifiers for fine inorganic particles, especially metal oxides. In our previous studies, dicarboxylic acid- or hydrophilic polyacrylic acid-modified CeO2 nanoparticles were synthesized to prepare water-dispersible nanoparticles.9,10 Interestingly, the morphology and particle size of the CeO2 nanoparticles depended on the amount of surface modifier. Consequently, to systematically investigate the influence of surface modifiers on the crystal growth of CeO2 under hydrothermal conditions using supercritical water, we selected monoalkyl carboxylic acids as surface modifiers because they have a simple structure and systematically varying alkyl chain length. Having a fluorite structure (Fm![[3 with combining macron]](https://www.rsc.org/images/entities/char_0033_0304.gif) m),18 CeO2 is known to be a suitable material for acquiring fundamental information on the nucleation and crystallization of metal-oxide nanoparticles in the presence of surface modifiers under hydrothermal conditions using sub- or supercritical water.7–10,13–15 However, monocarboxylic acid-modified CeO2 nanoparticles with systematically varying alkyl chain length have not been synthesized under the hydrothermal conditions yet.
m),18 CeO2 is known to be a suitable material for acquiring fundamental information on the nucleation and crystallization of metal-oxide nanoparticles in the presence of surface modifiers under hydrothermal conditions using sub- or supercritical water.7–10,13–15 However, monocarboxylic acid-modified CeO2 nanoparticles with systematically varying alkyl chain length have not been synthesized under the hydrothermal conditions yet.
Bulk and nanoparticle CeO2 samples have been thoroughly investigated because they can be used as catalysts and catalyst supports13,19–23 as well as in solid oxide fuel cells,24–26 polishing agents,27–30 gas sensors,31 and UV-shielding materials.32–35 In this study, we systematically synthesized monocarboxylic acid-modified CeO2 nanoparticles and investigated the influence of surface modifiers on the growth of CeO2 nanoparticles under hydrothermal conditions and the bonding characteristics of the organic–inorganic interfaces of the products.
Experimental
Sample preparation
The cerium hydroxide (Ce(OH)4) precursor was purchased from Aldrich. Monocarboxylic acids (i.e., hexanoic (C6), octanoic (C8), decanoic (C10), dodecanoic (C12), tetradecanoic (C14), hexadecanoic (C16), octadecanoic (C18), and oleic (C18) acids) were purchased from Wako Chemicals and used as surface modifiers in the hydrothermal method.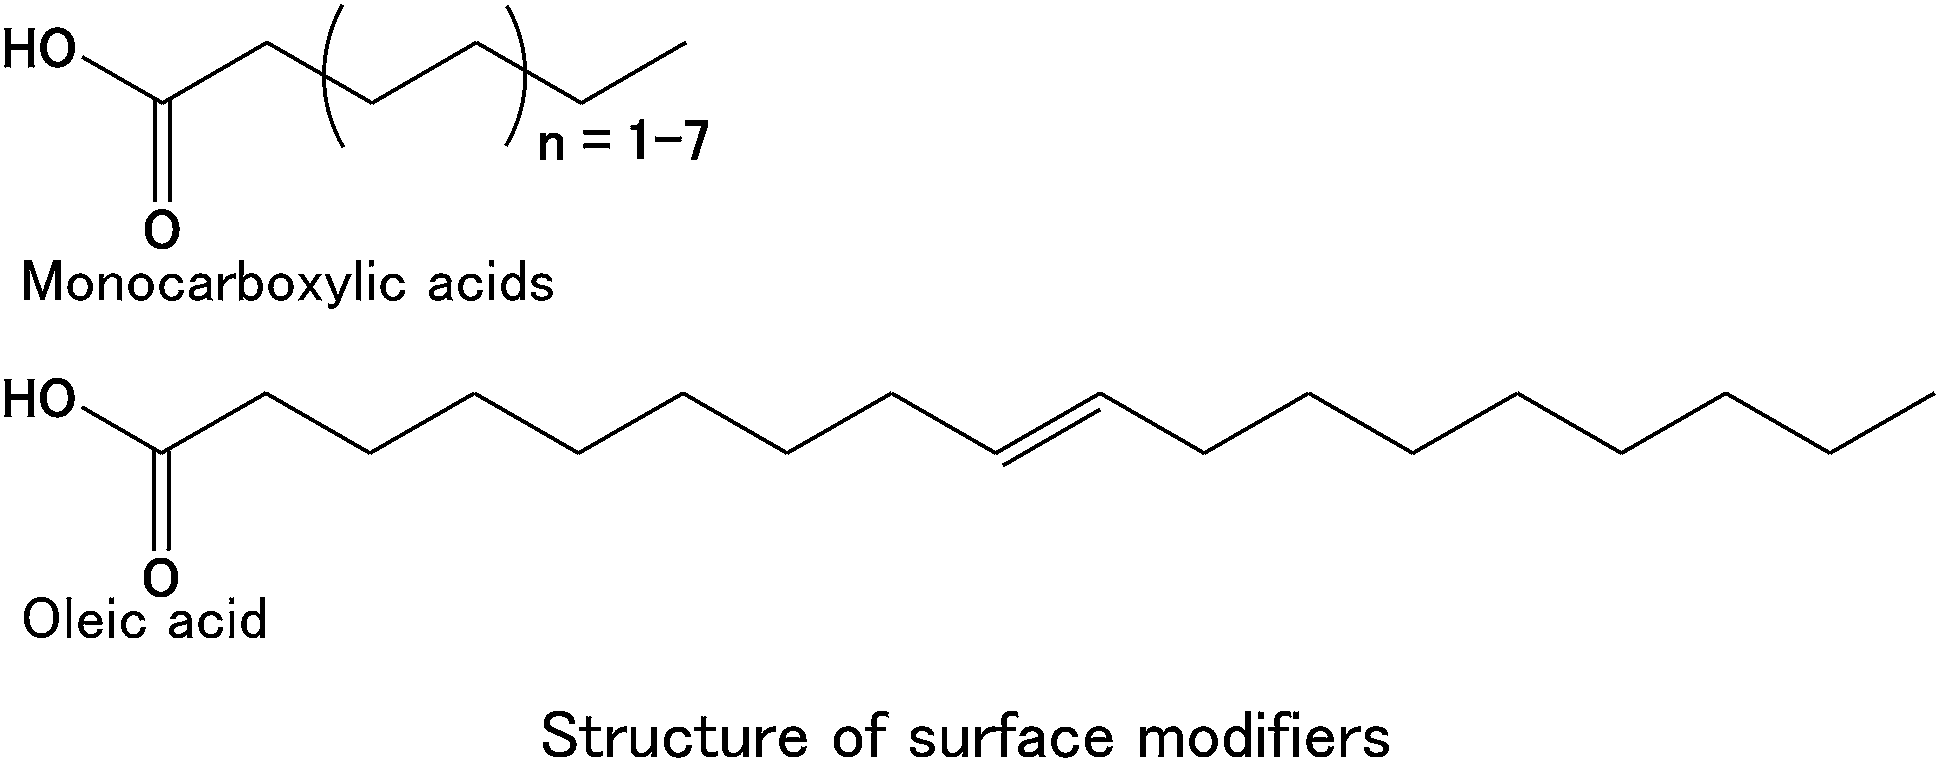
Ce(OH)4 (0.25 mmol), each monocarboxylic acid (0.25 mmol), and distilled water (5.0 mL) were placed in a pressure-resistant Hastelloy C vessel with an inner volume of 10 mL. Hydrothermal reactions were performed using an electric furnace at 400 °C and 38 MPa for 30 min. After the reactions, the vessel was cooled in a water bath at room temperature. The solid products were washed by repeated centrifugation and decantation using water and ethanol alternatively. The products, denoted as C6-CeO2 (hexanoic acid-modified CeO2), C8-CeO2 (octanoic acid-modified CeO2), C10-CeO2 (decanoic acid-modified CeO2), C12-CeO2 (dodecanoic acid-modified CeO2), C14-CeO2 (tetradecanoic acid-modified CeO2), C16-CeO2 (hexadecanoic acid-modified CeO2), C18-CeO2 (octadecanoic acid-modified CeO2), and OA-CeO2 (oleic acid-modified CeO2), were dried in air at room temperature. Unmodified CeO2 nanoparticles, denoted as um-CeO2, were also prepared under the same conditions (at 400 °C and 38 MPa for 30 min) without adding surface modifiers. For reference, the X-ray diffraction (XRD) pattern of a CeO2 crystal was simulated using the CrystalMaker and CrystalDiffract software (CrystalMaker Software Ltd.). The parameters used in the simulation were as follows: X-ray wavelength (λ) = 1.5416 Å, crystallite size = 100 nm, and lattice constant = 5.4112 Å.18
Characterization methods
XRD patterns of the products were recorded using an RINT-2500 diffractometer (Rigaku) equipped with a Cu Kα (λ = 1.5416 Å) radiation source and operated at a 2θ scan speed of 2° min−1. The lattice constants of the products were calculated from the XRD patterns using a unit-cell-parameter refinement program (Cell Calc).36 The Scherrer equation was used to determine the crystallite size of the products using the full width at half maximum (FWHM) of the typical peaks ((111), (200), (220), (311), (400), (331), (422), and (511)) and a shape factor of 0.9. The structural (lattice) defects of the products were verified through the analysis of the typical peaks in a Williamson–Hall plot.37 Note that the FWHM of the respective peaks (denoted hereafter as W) was used in this plot instead of the integral width of the peaks. Magnified images of the products were obtained by scanning transmission electron microscopy (STEM) using an S-5500 equipment (Hitachi). The particle sizes of the products were evaluated from the STEM images. Thermogravimetric analysis (TGA) was performed from room temperature to 800 °C at a ramp rate of 10 °C min−1 under an argon atmosphere using a DTG-60H instrument (Shimadzu). We estimated the amount of surface modifiers attached to the surface of the CeO2 nanoparticles from the TGA results, the estimated particle size (DSTEM), and the density of bulk CeO2 (7.2 g cm−3 (ref. 32)).9,10 We assumed that the entire particle surface was uniformly covered by modifiers and that the nanoparticles had a cubic structure. To confirm the surface coverage estimated from the TGA results, carbon analyses of the C6-, C8-, C10-, and C12-CeO2 products were performed on a Perkin-Elmer 2400 II CHN analyzer. Note that the amount of surface modifiers is qualitatively estimated because this analysis only provides the amount of carbon at the surface of the organic modifiers. Fourier-transform infrared (FT-IR) spectra were recorded on an FT/IR-6200 Plus spectrometer (JASCO), and the samples were compacted into KBr pellets. UV-vis powder diffuse-reflectance spectra were recorded using a V-650 spectrometer (JASCO). The obtained spectra were converted to absorption spectra using the Kubelka–Munk calculation.38,39Results and discussion
Crystallographic parameters of the products
XRD patterns of the products clearly indicate a cubic structure (space group Fmm) for CeO2 (Fig. 1). The peak widths in the XRD patterns of the products were broader than those in the simulated XRD pattern (crystallite size = 100 nm), indicating that the products have small crystallite sizes. The XRD peaks of the products slightly shifted to lower angles compared with the simulated values, which suggests an increasing crystal lattice of the products. The lattice constants and crystallite sizes of the products are provided in Table 1. The sizes of the nanoparticles were approximately 10 nm, with the um-CeO2 crystallite exhibiting the smallest size among all products.
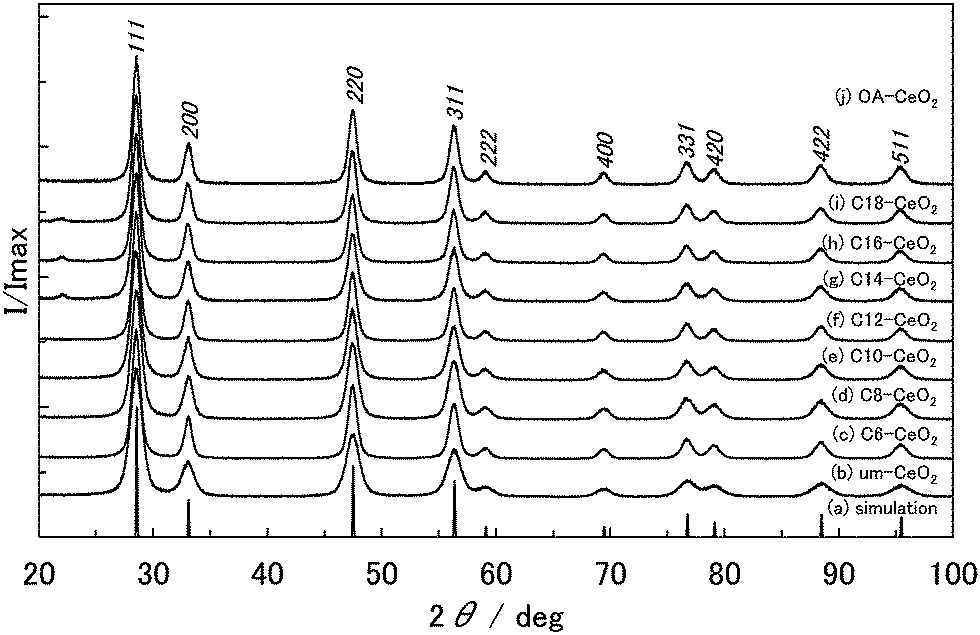 | ||
| Fig. 1 XRD patterns of the products: (a) simulated pattern, (b) um-, (c) C6-, (d) C8-, (e) C10-, (f) C12-, (g) C14-, (h) C16-, (i) C18-, and (j) OA-CeO2. | ||
| Products | Lattice constant (a)/Å | D XRD/nm | D STEM/nm | Intensity ratio of (111) to (200) |
|---|---|---|---|---|
| um-CeO2 | 5.415 | 6.2 | 5.3 | 3.81 |
| C6-CeO2 | 5.416 | 9.6 | 9.9 | 3.21 |
| C8-CeO2 | 5.416 | 7.6 | 9.5 | 3.08 |
| C10-CeO2 | 5.417 | 8.4 | 8.5 | 3.20 |
| C12-CeO2 | 5.417 | 9.3 | 9.0 | 3.16 |
| C14-CeO2 | 5.417 | 8.7 | 9.0 | 3.39 |
| C16-CeO2 | 5.418 | 9.9 | 9.9 | 3.36 |
| C18-CeO2 | 5.419 | 9.9 | 9.6 | 3.27 |
| OA-CeO2 | 5.419 | 10.1 | 10.7 | 3.28 |
| Simulation | 5.4112 | 100 | — | 3.70 |
The morphology and structure of the products were investigated in detail by STEM (Fig. 2). The dispersible nanoparticles without aggregation were observed in the STEM images of the products synthesized in the presence of surface modifiers, suggesting that the organic compounds attached to the surface of the nanostructures. This surface modification can inhibit the aggregation of nanoparticles with high surface energy.15 The products appeared to have square shapes, and therefore cubic structures.40–42 This result is similar to that obtained for CeO2 nanoparticles in our previous studies.9,10 No differences in morphological structure were observed among the products synthesized in the presence of surface modifiers. In contrast, an aggregation of um-CeO2 nanoparticles was observed in the STEM image (Fig. 2a), and the morphology of the um-CeO2 product was unclear. According to our previous studies, the product synthesized in the absence of surface modifiers shows a truncated octahedral structure.9,10 The particle sizes of the products synthesized in the presence of surface modifiers were approximately 10 nm, which is in close agreement with the sizes calculated from the XRD peak widths, whereas the particle size of the um-CeO2 product appeared to be approximately 6 nm. The size distributions of the products are shown in Fig. S1.† These appear to be broader in the case of the surface-modified samples compared with the um-CeO2 product. These results suggest that the crystallization of CeO2 products is greatly affected by interactions between the surface modifier and the crystalline surface of the CeO2 particles. Note that the Ce(OH)4 precursor concentration and reaction time are the same for all cases.
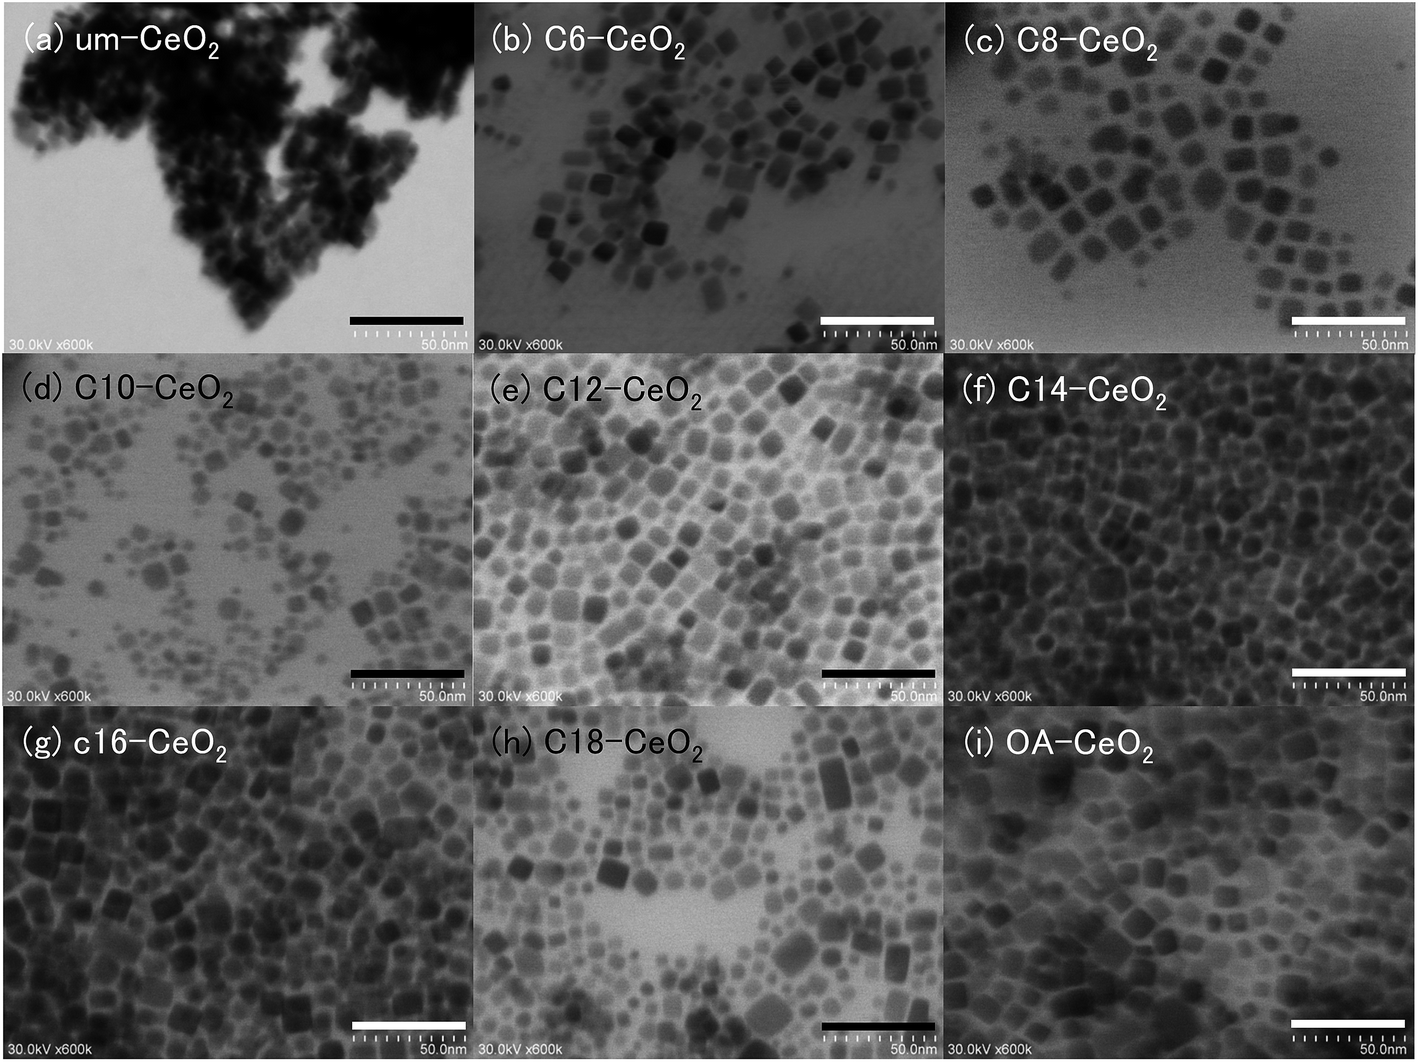 | ||
| Fig. 2 STEM images of the CeO2 nanoparticles: (a) um-, (b) C6-, (c) C8-, (d) C10-, (e) C12-, (f) C14-, (g) C16-, (h) C18-, and (i) OA-CeO2; scale bar = 50 nm. | ||
Inspection of crystallographic parameters suggests that changes in the lattice constants and crystallite (particle) sizes of the products are dependent on the characteristics of the surface modifiers. Both lattice constant and crystallite size generally increase with increasing alkyl chain length of the surface modifiers, although the crystallite size of the C6-CeO2 product largely deviates from this trend. Apparently, the alkyl chain length significantly affects the crystallization of CeO2 products. Comprehensive experimental studies on CeO2 nanoparticles showed that the lattice constant tends to increase upon reducing the particle size.32,43,44 This “lattice expansion” was also observed in our previous studies.9,10 The expanded lattice constant is believed to be caused by lattice defects, such as interstitial defects, oxygen vacancies, and valence variations, among the Ce ions in the nanostructured products. Thus, lattice defects are probably easily generated in the nanosized CeO2 structures crystallized in the presence of surface modifiers under hydrothermal conditions using supercritical water. Consequently, to evaluate the crystallographic distortion resulting from lattice defects in the products, an indexed Williamson–Hall plot was created using the crystallite sizes determined from the Scherrer equation (Fig. S2†). If the gradient in the plots is small, that is, if the plots can be approximated to a flat line, the local distortions are small.37 The plots of the studied products clearly showed positive gradients even though deviations from the linear square line are large, suggesting that there are anisotropic local distortions. When the particle size of the products is small, the anisotropic local distortions appear to be large.
Hydrothermal conditions using supercritical water in the presence of surface modifiers have a significant impact on crystallographic properties, such as crystallite size, lattice constant, morphology, and degree of local distortion, because of defects in the crystal structure of the products.
Analysis of interfacial properties
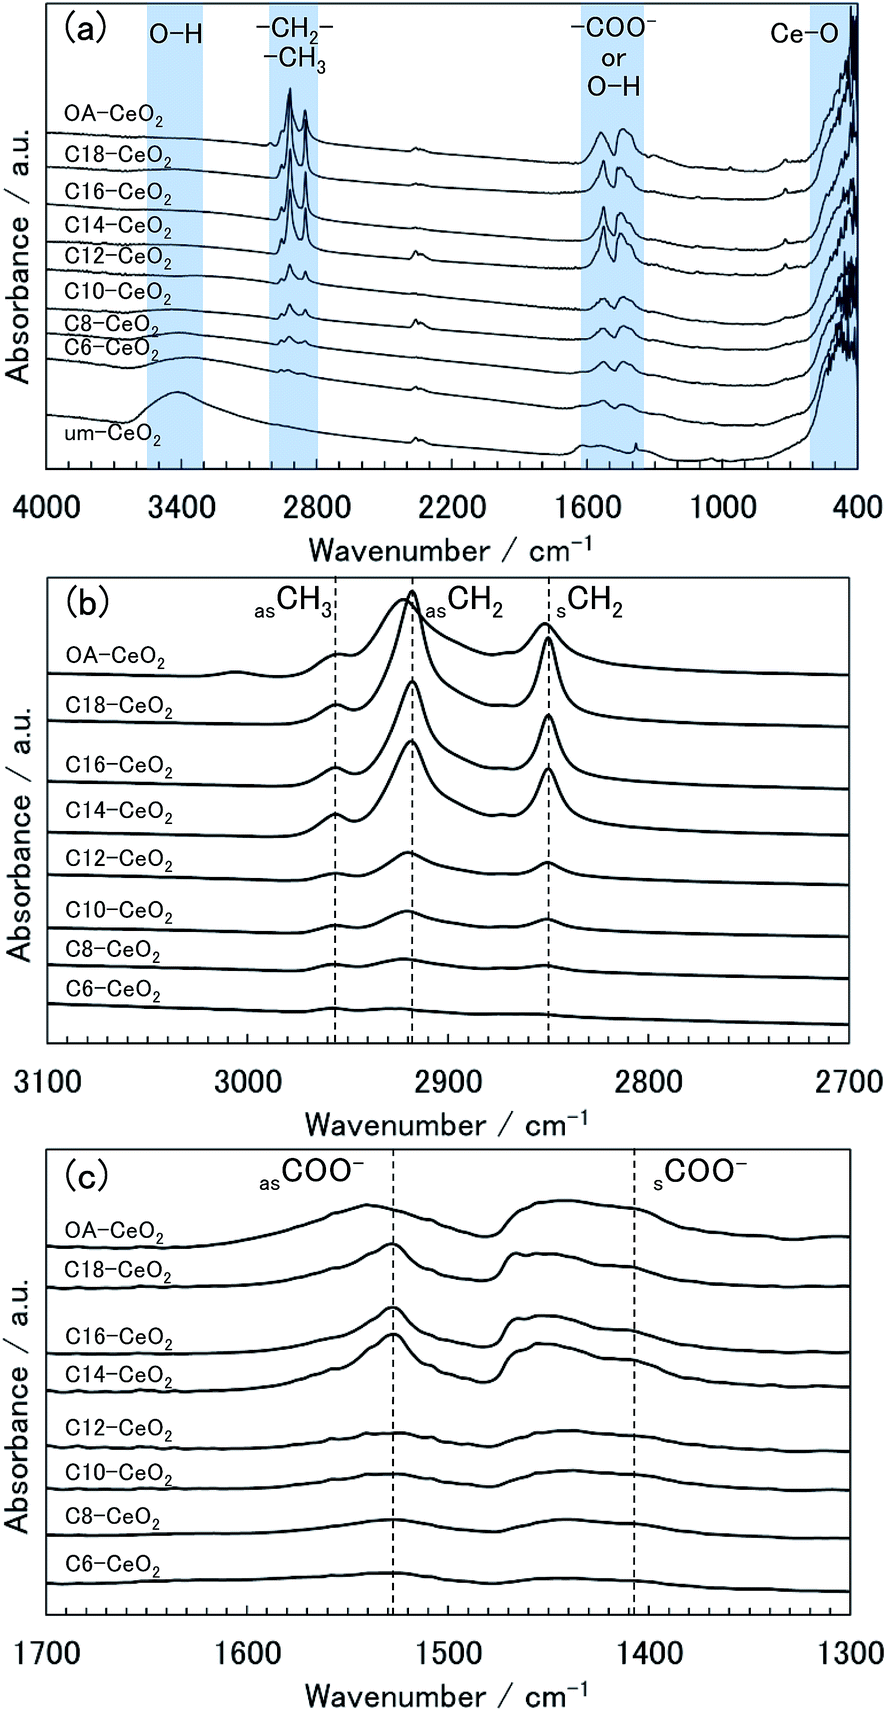 | ||
| Fig. 3 (a) FT-IR spectra of the CeO2 nanoparticle products and evolution of the spectra enlarged in the ranges: (b) 3100–2700 cm−1 and (c) 1700–1300 cm−1. | ||
The spectrum of the um-CeO2 product shows broad bands at approximately 3400 and 1600 cm−1, which can be assigned to the O–H modes of chemisorbed water and terminated hydroxides at the surface.38,39,46 The chemisorption of molecules on the um-CeO2 product is possibly attributable to the hydrothermal conditions and the use of the Ce(OH)4 precursor. Bands originating from the organic molecules are observed in the spectra of the products synthesized in the presence of surface modifiers. The spectrum of the C18-CeO2 product is shown as an example. A weak band appears at approximately 2960 cm−1, which is assigned to the asymmetric (νas) stretching mode of –CH3 in the alkyl chain of the C18 acid (Fig. 3b).46 The spectrum also shows some bands at approximately 2900 and 2850 cm−1, which are assigned to the asymmetric (νas) and symmetric (νs) stretching modes of –CH2– in the alkyl chain of the C18 acid (Fig. 3b). Further, bands observed at approximately 1530 and 1400 cm−1 can be assigned to the νas and νs modes of the carboxylate group (–COO−) of the C18 acid (Fig. 3c), respectively.9,10,12,46 Note that there is also a signal corresponding to the scissoring bending band of the –CH2– group in the alkyl chain, which appears at approximately 1450 cm−1.46 No bands related to the free carboxyl group (–COOH) of the original monocarboxylic acids (normally detected at about 1700 cm−1)46 were observed in the spectra of the products (Fig. S3†), indicating that unreacted surface modifiers were washed and removed from the products. The bands described above were also observed in the products synthesized in the presence of other monocarboxylic acid surface modifiers (Fig. S3†). Although the bands of the C6-CeO2 product were unclear, they could be found in the spectrum as weak bands (Fig. S3†). The presence of –COO− bands indicates that the carboxyl group of the surface modifiers attaches to the surface of the CeO2 nanoparticles through bidentate coordination bonds between –COO− and Ce ions.9,10,12,46–49 Chemisorbed water or hydroxide species are also believed to coordinate to the Ce ions.
In the spectra of the surface-modified products, the frequencies of the observed bands varied depending on the product. Based on the νas –CH2– band frequency in the spectrum of C18-CeO2, the bands of the C6-, C8-, C10-, C12-, and OA-CeO2 products shifted to higher wavenumbers (Fig. 3b). This band shift suggests a degree of disorder in the hydrocarbon (alkyl) chains of the surface modifier.50,51 In the spectra of the C14-, C16-, and C18-CeO2 products, the alkyl chains of the surface modifiers appear to primarily align in a trans-extending manner on the surface, that is, they show a homogeneous arrangement.50,51 In contrast, the alkyl chains of the surface modifiers in the C6-, C8-, C10-, C12-, and OA-CeO2 products tend to be found in a disordered manner on the surface. Notably, the arrangement of the oleic acid (OA) modifier on the surface appears to be more heterogeneous, as suggested by the large band shift to higher wavenumbers observed in the spectrum of OA-CeO2. The alkyl chains of OA hardly form trans-extended structures because of the double bond in the molecule. Next, before focusing on the –COO− bands (Fig. 3c), let us recall the well-known and previously discussed fact that the coordination structure between the carboxylate (–COO−) and metal ions is categorized by the wavenumber separation between the νas and νs bands in the spectrum.9,47–49 When carboxylic acids are used as surface modifiers for metal-oxide nanoparticles, the organic molecules normally coordinate to metal ions in a chelating and bridging bidentate bonding structure rather than a unidentate structure. This is because the former structure is more stable than the latter one, with wavenumber separations of <190 cm−1 and 200–320 cm−1, respectively. Since the chelating bidentate bonding structure is the most stable one, its wavenumber separation (<110 cm−1) is smaller than that of the bridging structure (140–190 cm−1).47–49 Therefore, the coordination structures can be categorized as bidentate bonding structures from the wavenumber separations of bands in the spectra of the studied products (Fig. 3c). The carboxylic acids (as surface modifiers) coordinate to the Ce ions of the CeO2 product not only by chelating but also by bridging bidentate bonding. However, the νas –COO− band frequency in the spectrum of the OA-CeO2 product shifts to higher wavenumbers, suggesting that the number of bridging bonding states is greater in this case than in the other surface-modified products. Additionally, the coordination states of the OA modifier may lead to the arrangement of alkyl chains on the surface.
Note that a band was observed at approximately 3400 cm−1 in the spectra of the C6- and C8-CeO2 products (with short alkyl chain), indicating that water and hydroxides may chemisorb on their surface instead of the organic modifiers' surface. This suggests that the surface coverage on the aforementioned products is lower than that observed on other products synthesized in the presence of surface modifiers having long alkyl chains. Moreover, the band intensities qualitatively reflect the amount of chemisorbed molecules,46 and the bands of the products with long alkyl chains appear to be stronger. Thus, the amount of attached surface modifiers appears to increase with increasing alkyl chain length. These results also support the fact that the particle size and morphology of the products correlate highly with the surface modification.
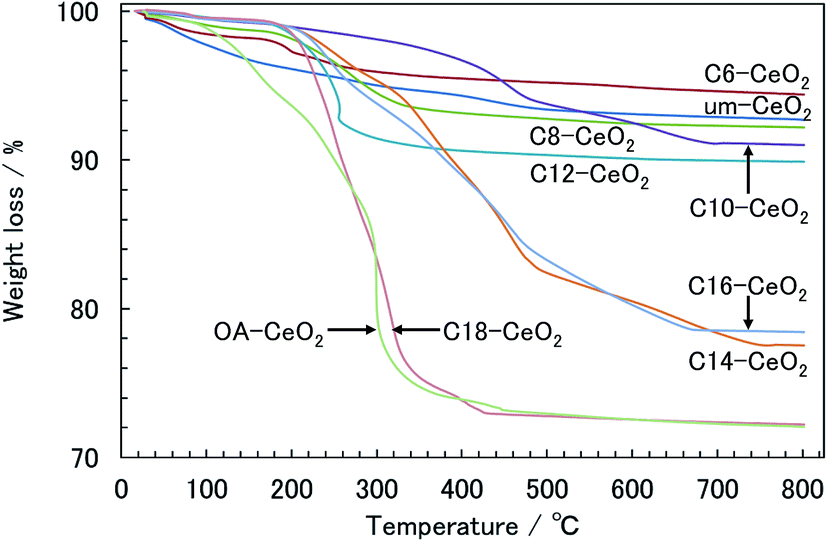 | ||
| Fig. 4 TGA curves of the CeO2 nanoparticle products. | ||
| Products | TGA | Elemental analysis | ||||
|---|---|---|---|---|---|---|
| Weight loss (%) | Coverage of modifier (molecule nm−2) | Surface coveragea (%) | Amount of carbonb (%) | Coverage of modifier (molecule nm−2) | Surface coverage (%) | |
| a The theoretical coverage of the surface modifier was calculated from the lattice constant (0.54112 nm) of CeO2 with fcc structure. The number of Ce ions per nm2 on the surface ({100} plane) of CeO2 was also estimated. The theoretical coverage was 6.84 molecule nm−2. The surface coverage of the products was calculated as the coverage of the surface modifiers divided by the theoretical number of Ce ions on the plane × 100 (%).9,10 b The amount of carbon (%) is given by the weight of C (carbon) divided by the weight of surface-modified products × 100 (%). | ||||||
| C6-CeO2 | 5.2 | 2.4 | 35 | 2.5 | 1.9 | 28 |
| C8-CeO2 | 7.8 | 2.9 | 43 | 4.1 | 2.3 | 33 |
| C10-CeO2 | 9.0 | 2.5 | 37 | 5.1 | 2.0 | 29 |
| C12-CeO2 | 10.1 | 3.0 | 44 | 7.5 | 3.1 | 45 |
| C14-CeO2 | 22.5 | 6.5 | 96 | — | — | — |
| C16-CeO2 | 21.6 | 6.4 | 93 | — | — | — |
| C18-CeO2 | 27.8 | 6.7 | 98 | — | — | — |
| OA-CeO2 | 27.9 | 8.3 | 122 | — | — | — |
The amount surface coverage among the products could be limited by intermolecular interactions between modifier species on the inorganic surfaces of the products under hydrothermal conditions. Surface modifiers having long alkyl chains can attach to the surface of the products through coordination bonds in an ordered manner under such conditions because the hydrophobic interactions between compounds with longer alkyl chains (e.g., the C18 acid) are generally stronger than those between compounds with shorter chains.52 In contrast, repulsive forces caused by the hydrophilic part of the –COO− ion during the surface-modification process under hydrothermal conditions appear to be dominant for the interaction among compounds having shorter alkyl chains (e.g., the C6 acid). We conclude that surface modifiers with long alkyl chains are more densely attached to the inorganic surface of the products compared with short-chain modifiers.
While the surface coverages of the C14-, C16-, and C18-CeO2 products were similar and close to the theoretical value, that of the OA-CeO2 product greatly exceeded the theoretical value, even though the particle sizes were similar in all cases. Additionally, since there is no free carboxylic group of the OA modifier in the product, unreacted OA in the product is negligible. Therefore, this surplus of OA-CeO2 product suggests that the coordination state of the OA molecules is different from those of the other acid modifiers. FT-IR results showed that the molecular arrangements and coordination states on the surface of the products are dependent on the thermodynamic properties and molecular structures of the surface modifiers. The alkyl chain of the OA modifier adopts a heterogeneous arrangement on the surface of the product because of its molecular structure. Furthermore, a variety of coordination structures between the carboxylate and Ce ions was observed, which appears to correlate with the surface coverage. Especially, by means of bridging bidentate bonding of the carboxylate ion, two or more molecules may coordinate to one Ce ion, which explains why the surface coverage of the OA-CeO2 product is above the theoretical value. Regarding the crystallographic parameters, the lattice constant increased with increasing alkyl chain length (see Table 1). The expansion of the lattice is caused by a significant number of lattice defects in the nanostructured products.32,43,44 Additionally, lattice defects can be induced in the CeO2 nanoparticles by surface modification.14 Therefore, the expanded lattice constant seems to depend on the amount of surface modifiers on the products.
Control of the morphology and particle size by surface modification
To investigate the crystal-growth mechanisms of the products, we monitored their morphologies by STEM. The morphology and structure of the products generally depends on the growth ratio of the crystalline planes.27,40–42 The generation ratio of the crystalline planes (displayed surface) correlates highly with the XRD peak-intensity ratio.27 Notably, the peaks of the (111) and (200) in the XRD pattern of CeO2 crystal correspond to the crystalline planes of the {111} and {100} of the crystal, respectively. To evaluate the morphology and structure of the products, we calculated the intensity ratios between the (111) and (200) peaks of their XRD patterns (Table 1). The ratios obtained for the surface-modified products were smaller than those determined for the um-CeO2 product (3.81) and calculated from simulations of a randomly oriented crystal (3.70). Although the morphology of the um-CeO2 product was unclear from the STEM images, all the surface-modified products showed square shapes and had cubic structures (see Fig. 2). A small intensity ratio means that the {100} plane is dominantly generated compared with the {111} plane. Therefore, the surface-modified products with cubic structures appear to display a {100} plane. In contrast, the morphology and structure of the um-CeO2 product seem to be truncated and cuboctahedral because the intensity of the (111) peak is large, and the {111} plane is displayed in the product.The stability of ionic crystals has been theoretically and experimentally investigated.53,54 In MO2-type (metal oxide) ionic crystals with fluorite structure (cubic system), the surface energy of the {100} plane is larger than that of the {111} plane. A dipole moment arises perpendicular to the {100} plane. This is also true for the CeO2 crystal with fluorite structure. The cubic structure in the surface-modified CeO2 products apparently displays a {100} plane, which results from the inhibited growth of this plane. It suggests that there are interactions between the carboxylate (–COO−) and Ce ions on the {100} plane of the products and that the growth rate of the {100} plane is suppressed as a result of surface modification by the monocarboxylic acids. The surface modifiers preferably bind to the {100} plane of the CeO2 crystal, which results in a reduction of the growth rate of the {100} plane. In the case of the um-CeO2 product, the crystallite planes possibly grow equivalently without controlling, that is, the growth of the {100} plane occurs with that of the {111} plane. A schematic of the crystallization and surface modification is shown in Fig. 5.
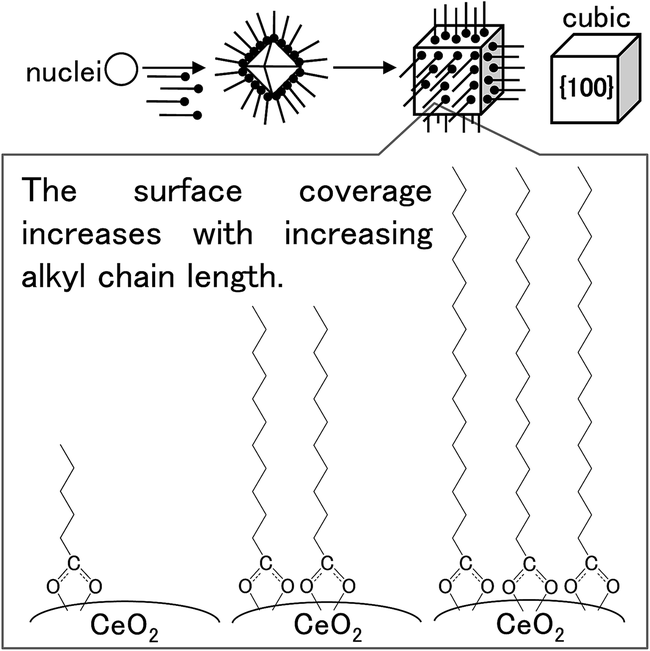 | ||
| Fig. 5 Schematic of morphology control and surface modification for the studied products. | ||
In the case of the um-CeO2 product, the particles were smaller and the size distribution was narrower compared with the surface-modified products. According to the LaMer crystallization mechanism, the particle size is dependent on monomer concentration and reaction time.55,56 As mentioned previously, the monomer (CeO2 precursor) concentration and reaction time were the same in all cases. However, the surface modifiers influenced the crystallization of the products, resulting in controlled crystallographic structures with particular lattice constant, morphology, and particle size. It suggests that the crystallization of the products progresses heterogeneously in the presence of surface modifiers. Especially, in situ reaction processes, such as crystallization of the precursor, dissolution of the organic surface modifiers, and surface modification, appeared concurrently in the reaction vessel under hydrothermal conditions using supercritical water. In fact, during the heat-up time to 400 °C for about 15 min in the furnace, although the crystallization of the Ce(OH)4 precursor was incomplete, the surface modifiers attached to the precursor and Ce ions by means of coordination bonds (Fig. S4†). This suggests the formation of intermediates consisting of Ce ions and surface modifiers under experimental conditions. The solubility of compounds, such as organic molecules, metal salts, and metal complexes, generally depends on both the nature of the compounds and temperature. Although the physical properties of saturated fatty acid (C6–C18 monocarboxylic acids) tend to be slightly different from those of unsaturated fatty acids (oleic acid), the solubility to water generally decreases with increasing alkyl chain length.57 The presence of intermediates should affect the crystallization of the products because their solubility and reaction conditions, depending on reaction temperature, are different. In the case of the surface modified products with short alkyl chain, since the solubility of the surface modifiers to water is larger than that of the surface modifiers with long alkyl chain, the heterogeneous crystallization process appears to be realized from low temperature and the process (reaction) time will be long compared with those of the surface modified products with long alkyl chain. Although there may be a time lag in the dissolution of surface modifiers with long alkyl chain on the water medium (sub- or supercritical water), the crystallization of products appears to be accelerated because of the interactions not only between the surface modifiers and the Ce(OH)4 precursor but also among the surface modifiers caused by the hydrophobic long alkyl chain. In contrast, the crystallization of the um-CeO2 product apparently occurs in a simple, homogeneous manner under experimental conditions. These differences in crystallization mechanisms of the products lead to different trends regarding particle size and distribution. Note that particle sizes of all the products studied herein were smaller than those of the samples investigated in our previous studies.9,10 This is possibly attributed to the longer heat-up times of the reaction vessel in the present study. The heat-up time affects the solubilities of the precursor and organic surface modifiers, resulting in controlled particle sizes.
Optical properties
The optical characteristics of the products were also investigated to verify the influence of the in situ surface-modification hydrothermal method on the properties of the nanostructured products. The UV-vis spectra of the products showed a steep absorption edge at approximately 3.1 eV (Fig. 6 and S5†), which apparently corresponds to the optical band gap of the charge-transfer (CT) transition between the O 2p and Ce 4f bands of the CeO2 crystal.32,58,59 The band gaps of the surface-modified products were slightly larger than that of the um-CeO2 product, and the band gaps of all the samples studied herein were smaller than those of the bulk CeO2 crystal (3.19 eV)32 and the products investigated in our previous studies.9,10 The reason for these differences with respect to our previous products is the fact that the conditions required for powder diffuse-reflectance and transmittance measurements in a water-dispersed solution are different. This possibly suggests an interaction between the products and water. Furthermore, the differences in crystallinity and surface modification also affect the optical band gaps reflected in the electronic state.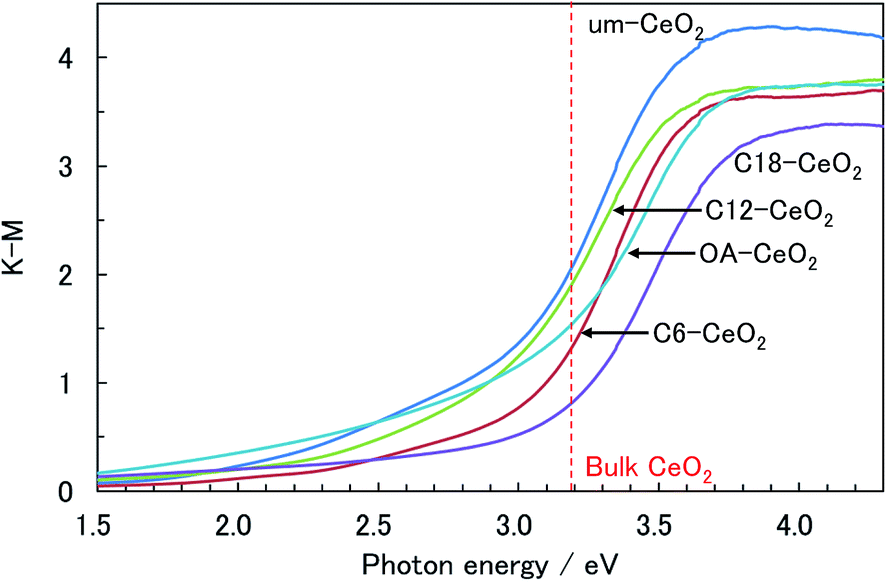 | ||
| Fig. 6 Typical UV-vis powder diffuse-reflectance spectra of the products. | ||
According to studies on the band gap of CeO2 nanoparticles, the blue shift of the absorption edge is caused by a valence change of the Ce ion rather than to quantum size effects.32,58,59 Valence variations of the Ce ion possibly affect the CT transition bands between O 2p and Ce 4f. This is because the electronic state of Ce 4f (conduction band) is changed by the valence change. The Ce valence changes from 4+ to 3+ because of oxygen defects, which tend to be induced by decreasing particle sizes.32,58,59 In fact, the greater the number of lattice defects, the higher the degree of the blue shift, that is, the blue shift provides information about the amount of Ce3+ ions present in the sample. Valence changes in the CeO2 nanoparticles are also caused by surface modification.14 Thus, the CT transition depends on particle size. Although the blue shift of the band gap for the CeO2 nanoparticles seems to depend on particle size, it is intrinsically induced by valence variations of the Ce ion (e.g., by lattice defects), but not by quantum confinement effects.
As mentioned previously, no significant differences between the band gaps of the studied products and that of a bulk crystal were observed. The lattice constants of the products were similar to that of a conventional crystal, and although the present samples are nanostructures, the amount of Ce3+ ions in the nanocrystal product is apparently small; hence the band gaps are similar. Herein, we focused on the absorptions of the products in the visible region. In general, CeO2 crystals are utilized as UV-shielding materials,32–35 and no absorption bands should be observed in the visible region. However, the spectra of the products showed absorption bands below 3.1 eV (>400 nm) in the visible region, which appears to originate from the nanostructure. Surface conditions, such as the coordination bonding of chemisorbed molecules, seem to particularly affect the optical properties of the products. Chemisorbed molecules can degrade or improve the crystallinity of the product at the surface of the crystallites because of the coordination between the chemisorbed molecules and Ce ions. The metamorphosed surface will substantially lead to absorptions below 3.1 eV. We could not find any systematic trend for the absorbance below 3.1 eV among the studied products. However, the absorption band in the spectrum of the um-CeO2 product was the largest, and since the particle size of um-CeO2 was the smallest, its surface-to-volume ratio was the largest. Contributions of the surface conditions are prominently observed in the spectra. Zhang et al. also indicated that the band gap of the CeO2 nanoparticles contributes to the surface conditions.14 Moreover, the electronic states of the inorganic nanoparticles are influenced by electrostatic interactions at the interface between the organic molecules and the crystallite surface.13,14 We conclude that surface modification affects the optical properties originating from the electronic states of the products.
Conclusion
We have succeeded in simply, easily, and rapidly synthesizing monocarboxylic acid-modified CeO2 nanoparticles in a batch-type reactor using supercritical water. The surface modifiers attached to the surface of the CeO2 nanoparticles through coordination bonds between the carboxylate and Ce ions. The presence of surface modifiers during the crystallization process affected both particle size and morphology. The particle sizes of the surface-modified-CeO2 products were approximately 8–10 nm, which increased with increasing alkyl chain length of the surface modifiers, and they conventionally had cubic structures. In contrast, the particle size of the um-CeO2 product was approximately 6 nm and had chemisorbed water and terminated hydroxides at the surface. Surface modifiers with long alkyl chains were more densely grafted on the surface of the CeO2 products, which is attributed to the stronger hydrophobic interactions between the alkyl chains present in longer modifiers compared with shorter ones. Interestingly, the alkyl chain of the oleic acid modifier adopted a heterogeneous arrangement on the surface of the product because of its molecular structure, and a variety of coordination structures between the carboxylate and Ce ions was observed. The surface modifiers preferably bind to the {100} plane of the CeO2 crystal, resulting in a reduction of the growth rate of the {100} plane, which led the cubic structure of the surface modified products. The optical band gaps of the products were approximately 3.1 eV. Significant differences between the band gaps of the products and that of a bulk crystal were not observed. However, optical absorption was observed in the visible region, which can be attributed to the surface modification.Acknowledgements
This work was partially supported by the Asahi Glass Foundation and a Grant-in-Aid for Scientific Research (A) (KAKENHI) (no. 25246013). It was performed under the Cooperative Research Program of “Network Joint Research Center for Materials and Devices.”References
- Z. Chen, H. Chen, H. Hu, M. Yu, F. Li, Q. Zhang, Z. Zhou, T. Yi and C. Huang, J. Am. Chem. Soc., 2008, 130, 3023–3029 CrossRef CAS PubMed.
- T. Zhang, J. Ge, Y. Hu and Y. Yin, Nano Lett., 2007, 7, 3203–3207 CrossRef CAS PubMed.
- A. Tanaka, H. Kamikubo, Y. Doi, Y. Hinatsu, M. Kataoka, T. Kawai and Y. Hasegawa, Chem. Mater., 2010, 22, 1776–1781 CrossRef CAS.
- F. Cao, C. Chen, Q. Wang and Q. Chen, Carbon, 2007, 45, 727–731 CrossRef CAS.
- D. Chen, H. Wen, H. Chen, H. Wang, R. Zhang, H. Xu, D. Yang and H. Lu, Mater. Chem. Phys., 2009, 116, 507–513 CrossRef CAS.
- Z. Shen, M. Yamada and M. Miyake, J. Am. Chem. Soc., 2007, 129, 14271–14280 CrossRef CAS PubMed.
- J. Zhang, S. Ohara, M. Umetsu, T. Naka, Y. Hatakeyama and T. Adschiri, Adv. Mater., 2007, 19, 203–206 CrossRef CAS.
- S. Takami, S. Ohara, T. Adschiri, Y. Wakayama and T. Chikyow, Dalton Trans., 2008, 5442–5446 RSC.
- M. Taguchi, S. Takami, T. Naka and T. Adschiri, Cryst. Growth Des., 2009, 9, 5297–5303 CAS.
- M. Taguchi, S. Takami, T. Adschiri, T. Nakane and T. Naka, CrystEngComm, 2011, 13, 2841–2848 RSC.
- M. Taguchi, S. Takami, T. Adschiri, T. Nakane and T. Naka, CrystEngComm, 2012, 14, 2117–2123 RSC.
- M. Taguchi, S. Takami, T. Adschiri, T. Nakane and T. Naka, CrystEngComm, 2012, 14, 2132–2138 RSC.
- J. Zhang, H. Kumagai, K. Yamamura, S. Ohara, S. Takami, A. Morikawa, H. Shinjoh, K. Kaneko, T. Adschiri and A. Suda, Nano Lett., 2011, 11, 361–364 CrossRef CAS PubMed.
- J. Zhang, T. Naka, S. Ohara, K. Kaneko, T. Trevethan, A. Shluger and T. Adschiri, Phys. Rev. B: Condens. Matter Mater. Phys., 2011, 84, 045411 CrossRef.
- T. Arita, J. Yoo and T. Adschiri, J. Phys. Chem. C, 2011, 115, 3899–3909 CAS.
- Y. Arai, T. Sako and Y. Takebayashi, Supercritical Fluids, Springer, Berlin, 2001 Search PubMed.
- Y.-P. Sun, Supercritical Fluid Technology in Materials Science and Engineering, Marcel Dekker, New York, 2002 Search PubMed.
- E. A. Kümmerle and G. Heger, J. Solid State Chem., 1999, 147, 485–500 CrossRef.
- A. Trovarelli, Catal. Rev., 1996, 38, 439–520 CAS.
- J. Beckers and G. Rothenberg, Green Chem., 2010, 12, 939–948 RSC.
- N. Ta, J. Liu, S. Chenna, P. A. Crozier, Y. Li, A. Chen and W. Shen, J. Am. Chem. Soc., 2012, 134, 20585–20588 CrossRef CAS PubMed.
- C. Santra, S. Rahman, S. Bojja, O. O. James, D. Sen, S. Maity, A. K. Mohanty, S. Mazumder and B. Chowdhury, Catal. Sci. Technol., 2013, 3, 360–370 CAS.
- C. T. Campbell and C. H. F. Peden, Science, 2005, 309, 713–714 CrossRef CAS PubMed.
- H. Inaba and H. Tagawa, Solid State Ionics, 1996, 83, 1–16 CrossRef CAS.
- M. Mogensen, N. M. Sammes and G. A. Tompsett, Solid State Ionics, 2000, 129, 63–94 CrossRef CAS.
- S. Basu, U. S. Devi and H. S. Maiti, J. Mater. Res., 2004, 19, 3162–3171 CrossRef CAS.
- N. B. Kirk and J. W. Wood, J. Mater. Sci., 1995, 30, 2171–2175 CrossRef CAS.
- T. Hoshino, Y. Kurata, Y. Terasaki and K. Susa, J. Non-Cryst. Solids, 2001, 283, 129–136 CrossRef CAS.
- S. H. Lee, Z. Lu, S. V. Babu and E. Matijević, J. Mater. Res., 2002, 17, 2744–2749 CrossRef CAS.
- X. Feng, D. C. Sayle, Z. L. Wang, M. S. Paras, B. Santora, A. C. Sutorik, T. X. Sayle, Y. Yang, Y. Ding, X. Wang and Y. S. Her, Science, 2006, 312, 1504–1508 CrossRef CAS PubMed.
- N. Izu, W. Shin, N. Murayama and S. Kanzaki, Sens. Actuators, B, 2002, 87, 95–98 CrossRef CAS.
- S. Tsunekawa, T. Fukuda and A. Kasuya, J. Appl. Phys., 2000, 87, 1318–1321 CrossRef CAS.
- S. Yabe and T. Sato, J. Solid State Chem., 2008, 171, 7–11 CrossRef.
- T. Sato, T. Katakura, S. Yin, T. Fujimoto and S. Yabe, Solid State Ionics, 2004, 172, 377–382 CrossRef CAS.
- Y. Minamidate, S. Yin and T. Sato, Mater. Chem. Phys., 2010, 123, 516–520 CrossRef CAS.
- H. Miura, J. Crystallogr. Soc. Jpn., 2003, 45, 145–147 CrossRef.
- G. K. Williamson and W. H. Hall, Acta Metall., 1953, 1, 22–31 CrossRef CAS.
- M. Taguchi, T. Nakane, K. Hashi, S. Ohki, T. Shimizu, Y. Sakka, A. Matsushita, H. Abe, T. Funazukuri and T. Naka, Dalton Trans., 2013, 42, 7167–7176 RSC.
- M. Taguchi, T. Nakane, A. Matsushita, Y. Sakka, T. Uchikoshi, T. Funazukuri and T. Naka, J. Supercrit. Fluids, 2014, 85, 57–61 CrossRef CAS.
- Z. L. Wang and X. Feng, J. Phys. Chem. B, 2003, 107, 13563–13566 CrossRef CAS.
- Z. L. Wang, J. Phys. Chem. B, 2000, 104, 1153–1175 CrossRef CAS.
- Y. Lin, Z. Wu, J. Wen, K. R. Poeppelmeier and L. D. Marks, Nano Lett., 2014, 14, 191–196 CrossRef CAS PubMed.
- X. D. Zhou and W. Huebner, Appl. Phys. Lett., 2001, 79, 3512–3514 CrossRef CAS.
- S. Tsunekawa, J. T. Wang and Y. Kawazoe, J. Alloys Compd., 2006, 408–412, 1145–1148 CrossRef CAS.
- C. Ho, J. C. Yu, T. Kwong, A. C. Mak and S. Lai, Chem. Mater., 2005, 17, 4514–4522 CrossRef CAS.
- K. Nakanishi, Infrared Absorption Spectroscopy: Practical, Holden-Day, San Francisco, 1962 Search PubMed.
- K. Nakamoto, Infrared and Raman Spectra of Inorganic and Coordination Compounds, Wiley-Interscience, New York, 1997 Search PubMed.
- Y. Ren, K. Iimura and T. Kato, Langmuir, 2001, 17, 2688–2693 CrossRef CAS.
- L. Zhang, R. He and H.-C. Gu, Appl. Surf. Sci., 2006, 253, 2611–2617 CrossRef CAS.
- G. Kane Jennings, J. C. Munro and P. E. Laibinis, Adv. Mater., 1999, 11, 1000–1003 CrossRef.
- P. E. Laibinis, R. G. Nuzzo and G. M. Whitesides, J. Phys. Chem., 1992, 96, 5097–5105 CrossRef CAS.
- J. N. Israelachivili, Intermolecular and Surface Forces, Academic Press, London, 1991 Search PubMed.
- P. W. Tasker, J. Phys. C: Solid State Phys., 1979, 12, 4977–4984 CrossRef CAS.
- M. Wang and Q. Chen, Chem.–Eur. J., 2010, 16, 12088–12090 CrossRef CAS PubMed.
- V. K. LaMer and R. H. Dinegar, J. Am. Chem. Soc., 1950, 72, 4847–4854 CrossRef CAS.
- F. Wang, V. N. Richards, S. P. Shields and W. E. Buhro, Chem. Mater., 2014, 26, 5–21 CrossRef CAS.
- R. T. Morrison and R. N. Boyd, Organic Chemistry, Prentice-Hall, Inc., 6th edn, 1992 Search PubMed.
- S. Tsunekawa, J. T. Wang, Y. Kawazoe and A. Kasuya, J. Appl. Phys., 2003, 94, 3654–3656 CrossRef CAS.
- S. Tsunekawa, R. Sahara, Y. Kawazoe and A. Kasuya, Mater. Trans. JIM, 2000, 41, 1104–1107 CrossRef CAS.
Footnote |
| † Electronic supplementary information (ESI) available: Arithmetic mean particle diameters and size distributions determined from the STEM images as well as Williamson–Hall plots, FT-IR, and UV-vis spectra of the products are shown in the ESI. See DOI: 10.1039/c4ra06936f |
| This journal is © The Royal Society of Chemistry 2014 |