Chiral sensing for electrochemical impedance spectroscopy recognition of lysine enantiomers based on a nanostructured composite
Yihan Huang,
Dongmei Guo,
Qing Zhang,
Liju Guo,
Ya Chen and
Yingzi Fu*
Key Laboratory on Luminescence and Real-Time Analysis, Key Laboratory on Luminescence and Real-Time Analysis, Ministry of Education, College of Chemistry and Chemical Engineering, Southwest University, Chongqing 400715, PR China. E-mail: fyzc@swu.edu.cn; Fax: +86-023-68253195; Tel: +86-023-68252360
First published on 24th July 2014
Abstract
A simple and reliable chiral sensing platform for enantioselective recognition of lysine (Lys) enantiomers based on a nanostructured composite (NC) via the electrochemical impedance spectroscopy (EIS) technique was described. The NC has been successfully synthesized through covalent linkage among the semiconductor 3,4,9,10-perylenetetracarboxylic acid (PTCA), thionine (Thi) and chiral selector L-N-tert-butoxycarbonyl-O-benzylserine (L-BBSer). The stepwise synthesis process of the NC was characterized by scanning electron microscopy (SEM), X-ray photoelectron spectroscopy (XPS) and EIS. The enantioselective interaction assay between NC modified glassy carbon electrode and lysine enantiomers relied on EIS technology. As a prototype example, good recognition results were obtained from the difference of electron transfer resistance (ΔRet), where ΔRetD was larger than ΔRetL and linear responses in ΔRet were found for Lys enantiomers ranging from 100 nM to 10 mM with a detection limit of 33 nM (S/N = 3). In addition, the results of analyzing another four amino acids revealed the specificity of the proposed sensor. The developed sensor with the advantages of simple preparation, long-term stability, good sensitivity and commendable selectivity, holds great potential application for the nanostructured composite adulterated with a chiral selector in chiral bio-electroanalysis.
Introduction
Chirality plays a crucial role in our living organisms.1 The majority of biologically active compounds in living organisms are involved in chiral interactions due to different stereochemical effects.2 L-amino acids are considered as foundational building blocks for protein synthesis in human or animals, nevertheless the D-configuration occurs in unicellular lower organisms and can be indicative of microbial contamination. Many studies have shown that one enantiomer is desirably physiologically active, while the other may be inactive or even cause toxicologic side effects.3,4 Thus, chiral discrimination has become a significant field in analytical chemistry. Currently, numerous methods have been used for chiral analysis of optically active compounds, such as high performance liquid chromatography,5–7 capillary electrophoresis,8–10 and electrochemical approach etc.11 This paper is focus on the electrochemical impedance spectroscopy (EIS) technology, which can effectively provide the interface information and monitor the interaction between adsorbed species and proposed sensor.123,4,9,10-Perylenetetracarboxylic acid (PTCA) derivatives, as an excellent organic semiconductor, have occupied the attention in the area of electronics materials and field-effect transistors.13,14 It displays electric conductivity ranging from 10−1 to 10−2 S cm−1,15 even fabricated PTCA-based materials have been used for chemical sensing and technological applications owing to its easy membrane-forming characteristic.16,17 Thionine (Thi) has been studied widely in electrochemical sensor field as a redox probe with the properties of high chemical stability and facile preparation.18 Among various reported methods on immobilizing Thi, such as adsorption,19encapsulation,20 cross-link,21 covalent binding22 and electrodeposition,23 covalent binding can avoid Thi leaking from the electrode interface and raise the stability of sensor. L-N-tert-butoxycarbonyl-O-benzylserine (L-BBSer), which bears bulky butoxy-carbonyl group and possesses physiochemical properties similar to the amino acids, could play as chiral selectors in the chiral discrimination of amino acids resulted from steric hindrance, hydrogen bonding and π–π interaction etc.24
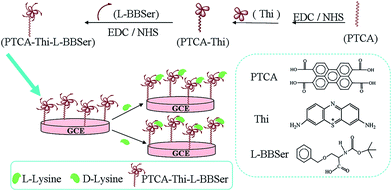
In this work, by using Thi as signal indicator to bind PTCA together through covalent binding with the aid of EDC and NHS, forming PTCA–Thi composite. And through the similar method the L-BBSer could be linked. Thus, the nanostructured composite (NC) (denoted as PTCA–Thi–L-BBSer) was successfully synthetized, which owned the homologous advantages of each component, such as superordinary electronic properties of PTCA, efficient redox-activity of Thi, and the selectivity capability of L-BBSer. It acts as a model system to explore the enantioselective interaction with lysine enantiomers via electrochemical impedance spectroscopy technique to acquire good results.
Experimental
Reagents and material
3,4,9,10-Perylenete-tracarboxylic dianhydride (C24H8O6, PTCDA) was purchased from Lian Gang Dyestuff Chemical Industry Co. Ltd (Liaoning, China). Thionine (Thi), L- and D-lysine (L-Lys and, D-Lys > 99%), L- and D-proline (>98%), L- and D-arginine (>98%), L- and D-alanine (>99%), L- and D-histidine (>99%), N-(3-dimethylaminopropyl)-N-ethylcarbodiimidehydrochloride (EDC) and N-hydroxy succinimide (NHS) were purchased from Sigma chemical Co. (St. Louis, MO, USA). N-(tert-butoxycarbonyl)-O-benzyl-L-serine (L-BBSer) was purchased from J&K technology Co. 5.0 mM [Fe(CN)6]4−/3− solution was prepared with K4Fe(CN)6/K3Fe(CN)6 containing 0.1 M KCl. 0.1 M phosphate buffer solution (PBS) was prepared with KH2PO4 and Na2HPO4 containing 0.1 M KCl.Equipment
Cyclic voltammetry (CV) and electrochemical impedance spectroscopy (EIS) measurements were carried with a CHI 660D electrochemistry workstation (Shanghai Chenhua Instruments Co., China). A conventional three-electrode system was employed, a modified glassy carbon electrode as working electrode, the saturated calomel electrode as reference, a platinum wire as an auxiliary electrode in all electrochemical experiments. The scanning electron micrographs were recorded on a digital S-4800 scanning electron microscope (SEM, Hitachi Instruments Co., Japanese), using an acceleration voltage of 20 kV. X-ray photoelectron spectroscopy (XPS) measurements using monochromatized Al Kα X-ray (1486.6 eV) as the light source were performed by a VG Scientific ESCALAB 250 spectrometer.Synthesis of the nanostructured composite (NC)
The 3,4,9,10-Perylenetetracarboxylic acid (PTCA) was obtained according to the literatures with a little modification.25,26 In the first, 8.5 mg PTCA was dispersed in 10 mL PBS (pH 7.0, containing NHS and EDC) and stirred for 6 hour to activated sufficiently, 10 mL Thi aqueous solution (1.15 mg mL−1) was added dropwise into the formed solution under continuous stirring for 12 hour at room temperature, the synthesized product (denoted as PTCA–Thi) was centrifuged and then washed with distilled water. Secondly, 10 mL L-BBSer aqueous (0.59 mg mL−1), which was also activated according to the previous operation, was added dropwise into the PTCA–Thi dispersed solution and stirred for 12 hour at room temperature. Thirdly, NC (PTCA–Thi–L-BBSer) was centrifugated and washed with distilled water for at least three times, finally stored at 4 °C for further use.The formation of chiral interface
To obtain mirror-like surface, GCE (Φ = 4 mm) was polished with 1.0, 0.3 and 0.05 μm alumina powder, respectively, and rinsed with double distilled water. Following that, GCE was successively sonicated in ethanol and redistilled water, then 6 μL of a homogeneous PTCA–Thi–L-BBSer dispersed solution was dropped on the pretreated GCE and then was dried in air. Thus, the PTCA–Thi–L-BBSer/GCE was constructed for measurement. Scheme 1 depicted the synthesis process of nanostructured composite and the schematic diagram of chiral recognition.Results and discussion
Characterization of NC by SEM, XPS and EIS
Electrochemical characterization
Chemical impedance spectroscopy (EIS) can not only provide useful the information about the modified electrode interface but also the electrolyte solution. A typical shape of a Faradic impedance spectrum, plotted as Nyquist diagrams, includes a semicircle portion observed at higher frequencies, which describes the electron transfer limited process, and a straight region obtained for lower frequency, which corresponds to the diffusion limited transport of the redox species in the electrolyte to the electrode interface. The semicircle diameter in the Nyquist diagrams is equal to the electron-transfer resistance (Ret). Fig. 1C illustrated the impedance spectroscopy of the stepwise synthesis process of PTCA–Thi–L-BBSer nanocomposite and PTCA–Thi–L-BBSer interaction with Lys enantiomers, which obtained in 5.0 mM [Fe(CN)6]4−/3− solution containing 0.1 M KCl with the frequency ranging from 105 to 10−1 Hz. The Ret value of the clean bare glass carbon electrode was estimated to be 35.30 Ω (curve a). When the electrode was coated with PTCA (PTCA/GCE), interfacial impedance increased (Ret = 400.0 Ω; curve b). However, an apparent decrease in Ret can be found on PTCA–Thi modified electrode (PTCA–Thi/GCE), the reason could be that Thi exhibited an excellent electrochemical activity and facilitated the electrons transfer (Ret = 261.2 Ω; curve c). Curve d displayed a further decrease in Ret, since PTCA–Thi–L-BBSer nanocomposite was synthetized, clarifying the excellent conductivity of the nanostructure of PTCA–Thi–L-BBSer film (Ret = 198.6 Ω).The interactions between different modified electrodes and lysine enantiomers have been investigated using EIS technology, and the results were shown in Fig. 2. Curve a were represented the different modified electrodes, where Fig. 2Aa was PTCA/GCE, Fig. 2Ba was PTCA–Thi/GCE, and Fig. 2Ca was PTCA–Thi–L-BBSer/GCE. Curve b and c were after the modified electrodes interacted with L-Lys and D-Lys, respectively. From Fig. 2A and B, similar Ret values were observed between lysine enantiomers. However, distinctive difference in the Ret values could be seen in Fig. 2C, where the resistance of PTCA–Thi–L-BBSer/GCE (curve a) was 198.6 Ω, the resistance of curve b and curve c decreased to 122.5 Ω (RetL) and 71.8 Ω (RetD), respectively. The differences of resistance ΔRetL (ΔRetL = Ret PTCA–Thi–L-BBSer − RetL) of L-Lys was 76.10 Ω, while ΔRetD (ΔRetD = Ret PTCA–Thi–L-BBSer − RetD) was 126.8 Ω, All the results hinted that PTCA/GCE and PTCA–Thi/GCE had no recognition of lysine enantiomers, while there were different interaction between PTCA–Thi–L-BBSer/GCE and Lys enantiomers, leading to the different drop in the Ret and larger drop was from D-Lys. The reason for the decrease in Ret was that lysine enantiomers were positive charge in the pH 7.0 solution, while lysine enantiomers were adsorbed on the modified electrode, which facilitated the approach of the redox species to the interface and resulted in the decrease in Ret. In addition, more D-Lys could be selectively bound to the nanostructured composite (PTCA–Thi–L-BBSer) than L-Lys, more positive charge could be existed on the modified electrode, making electron-transfer resistance smaller. Therefore, all the results indicated that the proposed sensor can be effectively applied to the enantioselective recognition of Lys enantiomers by EIS.
 | ||
| Fig. 2 EIS of different modified electrodes: (A) (a) PTCA/GCE, (B) (a) PTCA–Thi/GCE, (C) (a) PTCA–Thi–L-BBSer/GCE interacted with (b) L-Lys or (c) D-Lys. | ||
Electrochemical recognition of Lys enantiomers on PTCA–Thi–L-BBSer interface was investigated by CV (Fig. 3). Curve a and b represented the CVs of PTCA–Thi–L-BBSer modified electrodes, and the reduction current was 24.5 μA. Obvious distinctive amperometric responses were obtained after PTCA–Thi–L-BBSer/GCE immersed in 2 mM L- and D-Lys solution for 15 min, respectively. Larger current response was obtained from D-Lys solution (curve c, ID = 64.8 μA), which the difference of current response for D-Lys ΔID (ΔID = ID − I) was 40.3 μA. While minor increase of peak current was found from L-Lys solution (curve d, IL = 44.6 μA), and the difference of current response ΔIL (ΔIL = IL − I) was 20.1 μA. The conceivable reason for the enhanced current response was that Thi can get the better current response in the solution containing enough protons, and Lys is protonated under phosphate buffer solution (0.1 M, pH 7.0). More D-Lys was adsorbed to the electrodes to obtain larger current response. The recognition results from CV were consistent with the previous results from EIS, indicating that the proposed sensor provided a potential for practical application in chiral discrimination.
The optimization of experiment conditions
The effect of the incubation time on enantioselective discrimination was also investigated (Fig. 4). The ΔRet values increased with the incubation time rapidly up to 15 min, and after that time, the ΔRet inclined to be steady, suggesting adsorbed saturation of the Lys molecule. The ΔRet of modified electrode with D-Lys was always larger than with L-Lys. Furthermore, the largest difference between ΔRetD and ΔRetL was achieved at 15 min. Thus, 15 min was chosen as the optimal incubation time in the subsequent work.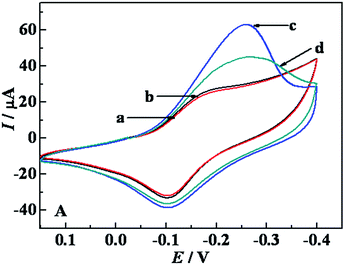 | ||
| Fig. 3 CVs of the modified electrodes: (a) and (b) PTCA–Thi–L-BBSer/GCE, after PTCA–Thi–L-BBSer/GCE interacted with (c) D-Lys or (d) L-Lys. | ||
Analytical performance
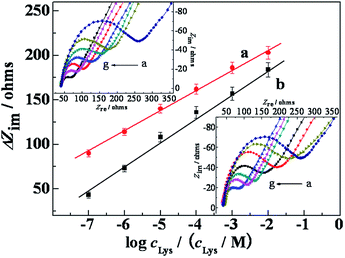
The calibration plots of Lys enantiomers under optimal experimental conditions were illustrated by EIS technology in Fig. 5a and b, which resulted from the analysis of at least eight standard solutions (D- or L-Lys) and three measurements performed at each concentration level. After the modified electrode was immersed in the D- or L-Lys solution, RetL and RetD were both decreased, and the difference of interfacial resistance ΔRetL and ΔRetD were proportional to the increment of D- and L-Lys concentration in the linear domain covered from 100 nM to 10 mM. The linear regression equation of D-Lys is y = 22.94x + 252.4 (R = 0.9984) with a detection limit of 33 nM (Fig. 5a), and the linear regression equation of L-Lys is y = 28.14 x + 241.5 (R = 0.9970) with a detection of 33 nM (Fig. 5b). These results showed wide dynamic measurement range and high sensitivity, indicated that the proposed sensor can have good chiral recognition for Lys enantiomers.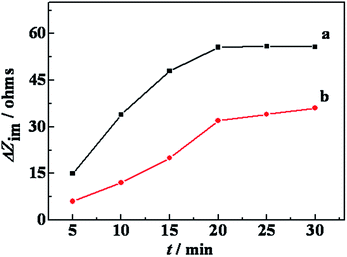 | ||
| Fig. 4 Influence of incubation time on difference of Ret when the modified electrode interacted with lysine enantiomers: (a) D-Lys, (b) L-Lys. | ||
Selectivity
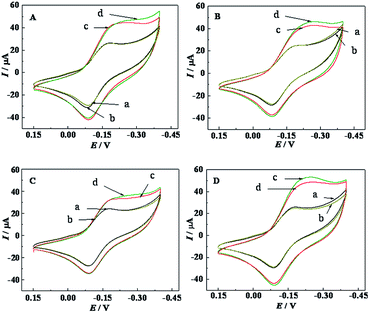
In order to investigate the selectivity of the developed sensor, several amino acids containing L- and D-proline (Fig. 6A), L- and D-arginine (Fig. 6B), L- and D-alanine (Fig. 6C) and L- and D-histidine (Fig. 6D) were used to evaluate the selectivity of the developed sensor by CV technology. After the modified electrode was separately incubated in these amino acids solution for 15 min, compared with the CVs between Fig. 6A–D, little differences of peak currents were presented. All the results confirmed that the developed sensor had little discrimination to these amino acids, but had good selectivity and specificity for Lys enantiomers.Stability and reproducibility of the sensor
Stability and reproducibility of sensors was a considerable factor in their application. After 50 cycles CV measurements in working buffer, it retained 95.8% of its initial current. When the developed sensor was stored at 25 °C and measured intermittently (every 10 days), it finally maintained 91.4% of its initial current response after a storage period of 30 days, depicting a quite satisfying stability. The reproducibility of the sensor was investigated as well. Five pairs of electrodes of the same batch were prepared for recognition of Lys enantiomers. They were showed similar electrochemical response and the relative standard deviation (RSD) was 3.2%, which suggested acceptable reproducibility. Considering the stability, simple operation and the wide detection range, our approach holds great promise for potential applications in the field of chiral recognition of other chiral molecule based on nanostructured composite (Fig. 6).Conclusions
In summary, we have successfully constructed a chiral sensing platform based on NC modified interface for recognizing lysine enantiomer via EIS. Good recognition has been achieved from the difference between ΔRetD and ΔRetL. A satisfying calibration plot ranging from 100 nM to 10 mM with a low detection limit of 33 nM (S/N = 3) and a favourable specificity were obtained. Thus, this work presented a good model by using impedance spectroscopy for monitoring the interactions between the proposed sensor and lysine enantiomers, and provided a promising application insight of the nanostructured composite in chiral biomolecules and drugs.Acknowledgements
The authors are grateful for the financial supports provided by the National Natural Science Foundation of China (20972128 and 21272188).Notes and references
- E. Yashima and K. Maeda, Macromolecules, 2008, 41, 3–12 CrossRef CAS.
- T. Q. Yan and C. Orihuela, J. Chromatogr. A, 2007, 1156, 220–227 CrossRef CAS PubMed.
- A. Miyazaki, T. Nakamura, M. Kawaradani and S. Marumo, J. Agric. Food Chem., 1988, 36, 835–837 CrossRef CAS.
- P. Jenner and B. Testa, Drug Metab. Rev., 1974, 2, 117–184 CrossRef CAS.
- X. Li, Z. M. Zhou, D. Xu and J. Zhang, Talanta, 2011, 84, 1080–1092 CrossRef CAS PubMed.
- H. T. Qu, J. Q. Li, G. S. Wu, J. Shen, X. D. Shen and Y. Okamoto, J. Sep. Sci., 2011, 34, 536–541 CrossRef CAS PubMed.
- Y. Katoh, Y. Tsujimoto, C. Yamamoto, T. Ikai, M. Kamigaito and Y. Okamoto, Polymer, 2011, 43, 84–90 CAS.
- W. X. Huang, H. Xu, S. D. Fazio and R. V. Vivilecchia, J. Chromatogr. A, 2000, 875, 361–369 CrossRef CAS.
- D. W. Armstrong, K. Rundlett and G. L. Reid III, Anal. Chem., 1994, 66, 1690–1695 CrossRef CAS.
- W. W. Bi, S. R. Lei, X. P. Yang, Z. M. Xu, H. Y. Yu, D. Xiao and M. M. F. Choi, Talanta, 2009, 78, 1167–1172 CrossRef CAS PubMed.
- Y. J. Kang, J. W. Oh, Y. R. Kim, J. S. Kim and H. Kim, Chem. Commun., 2010, 46, 5665–5667 RSC.
- F. Li, Y. Feng, L. M. Yang, L. Li, C. F. Tang and B. Tang, Biosens. Bioelectron., 2011, 26, 2489–2494 CrossRef CAS PubMed.
- T. Kampen, A. Bekkali, I. Thurzo, D. R. T. Zahn, A. Bolognesi, T. Ziller, A. Di Carlo and P. Lugli, Appl. Surf. Sci., 2004, 234, 313–320 CrossRef CAS PubMed.
- I. G. Hill, J. Schwartz and A. Kahn, Org. Electron., 2000, 1, 5–13 CrossRef CAS.
- S. Nishio, R. Mase, T. Oba, A. Matsuzaki and H. Sato, Appl. Surf. Sci., 1998, 127–129, 589–594 CrossRef CAS.
- M. H. Hennessy, Z. G. Soos, R. A. Pascal and A. Girlando, Chem. Phys., 1999, 245, 199–212 CrossRef CAS.
- Y. Zhuo, P. X. Yuan, R. Yuan, Y. Q. Chai and C. L. Hong, Biomaterials, 2008, 29, 1501–1508 CrossRef CAS PubMed.
- C. Ruan, F. Yang, C. H. Lei and J. Q. Deng, Anal. Chem., 1998, 70, 1721–1725 CrossRef CAS PubMed.
- M. M. Collinson, C. G. Rausch and A. Voigt, Langmuir, 1997, 13, 7245–7251 CrossRef CAS.
- E. J. Calvo, C. B. Danilowicz and A. Wolosiuk, Phys. Chem. Chem. Phys., 2005, 7, 1800–1806 RSC.
- S. Sampath and O. Lev, Adv. Mater., 1997, 9, 410–413 CrossRef CAS.
- A. Parra, E. Casero, L. Vazquez, F. Pariente and E. Lorenzo, Anal. Chim. Acta, 2006, 555, 308–315 CrossRef CAS PubMed.
- M. H. Yang, Y. H. Yang, Y. Yang, G. L. Shen and R. Q. Yu, Anal. Biochem., 2004, 334, 127–134 CrossRef CAS PubMed.
- K. Vekey and G. Czira, Anal. Chem., 1997, 69, 1700–1705 CrossRef CAS PubMed.
- F. Caruso, E. Rodda and D. N. Furlong, Anal. Chem., 1997, 69, 2043–2049 CrossRef CAS PubMed.
- C. Zhang, N. Luo and D. E. Hirt, Langmuir, 2006, 22, 6851–6857 CrossRef CAS PubMed.
| This journal is © The Royal Society of Chemistry 2014 |

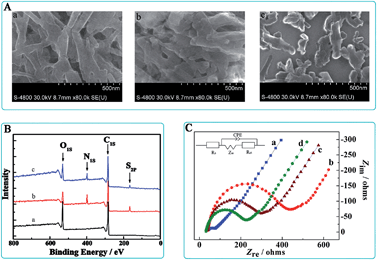
![[thin space (1/6-em)]](https://www.rsc.org/images/entities/char_2009.gif) 000: (a) bare GCE, (b) PTCA/GCE, (c) PTCA–Thi/GCE, (d) PTCA–Thi–
000: (a) bare GCE, (b) PTCA/GCE, (c) PTCA–Thi/GCE, (d) PTCA–Thi–