Polymethacrylic acid–facilitated nanofiber matrix loading Ag nanoparticles for SERS measurements†
Hui Yanga and
Cheng Zhi Huang*ab
aKey Laboratory of Luminescence and Real-Time Analytical Chemistry (Southwest University), Ministry of Education, College of Chemistry and Chemical Engineering, Southwest University, Chongqing 400715, China. E-mail: chengzhi@swu.edu.cn; Fax: +86 23 68367257; Tel: +86 23 68254659
bCollege of Pharmaceutical Science, Southwest University, Chongqing 400716, China
First published on 6th August 2014
Abstract
Nanofiber matrix loading Ag nanoparticles have been applied for SERS measurements with the limitation of poor reproducibility. By introducing polymethacrylic acid (PMAA) into the electrospun solutions in this contribution, fairly uniform PMAA/poly(N-vinylpyrrolidone) (PVP) ultrafine fibers containing silver nanoparticles (AgNPs) were successfully prepared via electrospinning by means of in situ photo reduction of silver ions. PMAA can significantly improve the absorbing amounts of silver ions in the polymer owing to its linear structure with abundant carboxyl groups, which makes the content and size of formed AgNPs in the polymer matrix to be easily controlled under different light sources (such as desk lamp, 365 nm UV lamp, and 254 nm UV lamp). With the electrospun AgNPs/PMAA/PVP fibrous membranes, malachite green (MG), a significant environmental organic pollutant known for its genotoxicity, was successfully detected with RSD values below 0.2% through SERS signals.
Introduction
The incorporation of functional molecules into the host materials may further improve the comprehensive properties of composites because the “single component” in the host material has a limited number of functions.1,2 Research on composite materials composed of nanoparticles dispersed within a polymeric matrix has attracted a great deal of attention since these materials offer considerable number of options for combining properties originating from both the inorganic components and the polymers.3,4 Nanoparticles exhibit unique properties that differ from their bulk materials owing to the quantum size effects and the large number of unsaturated surface atoms. The introduction of a polymeric matrix provides additional qualities, such as the processability, solubility or thermal stability of the systems. A wide range of metal nanoparticles have been formed within polymer templates, including Ag, Au, Cu, Pt, and Pd.5–7 In this way, composite materials possessing novel catalytic,8 conductive,9 or sensing properties can be obtained.10–12 Thus, it still remains worthwhile yet challenging to pursue a better method and explore the novel applications of these composite materials.At present, most of the methods reported to prepare metal nanoparticles within a polymeric matrix are based on in situ reactions by a wet-chemistry preparation strategy; i.e., the particles are generated from the respective metal precursors in the presence of the matrix polymer. The options range from chemical reductions,13 photoreductions14 and decompositions,15 to thermal processes16 and hydrogen-bonding interactions.17 However, compared with the methods previously mentioned, electrospinning is a more facile and ingenious method to fabricate polymer-encapsulated metal nanoparticles, by which many kinds of functional nano, such as carbon nanotubes and silver nanoparticles (AgNPs), can be incorporated into the polymer. In particular, the addition of AgNPs within polymer nanofiber by the electrospinning technique have been attracting intensive scientific interest because elemental silver has been used for decades as surface-enhanced Raman scattering (SERS) substrates.18–21 Thus, the AgNPs/polymer composite nanofiber mat by electrospinning should be particularly well-suited for use as SERS substrates for the following reasons: (1) its suitability for surface modification during sample preparation; (2) its exhibition of excellent mechanical resilience; and (3) its three-dimensional porosity for easy access by analytes. However, a remaining question is that most of the current procedures for preparing the AgNPs/polymer composite nanofiber mat by electrospinning have significant deficiencies, such as the complexity, the low yield and the aggregation of AgNPs, which produces poor reproducibility for detection results.
Polymethacrylic acid (PMAA), a common polyelectrolyte, has a strong affinity for silver ions due to its carboxylic acid group, which has also been proven to be a versatile template for the preparation of Ag nanoclusters.22 Illumination is used as a convenient tool to dynamically manipulate the synthesis and shape transformation of metal nanoparticles. Therefore, in this work, the electrospinning solution comprised of AgNO3, PMAA and PVP was used to fabricate the nanofiber mat by the electrospinning technique with the aid of light irradiation, resulting in the AgNPs/polymer composite nanofiber mat (illustrated in Scheme 1). The advantages of the present strategy might be: (1) the high yield of AgNPs for introducing the PMAA into electrospun solution; (2) highly monodisperse particles with uniform size and shape due to the dispersing and stabilizing action of polymer media; (3) the ability to control nanoparticle growth with light, revealing a novel synthesis avenue.
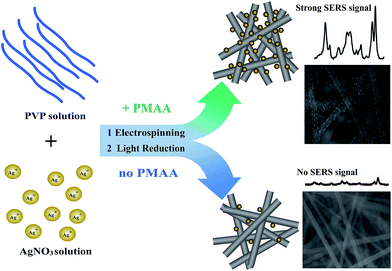 | ||
| Scheme 1 A scheme demonstrating the preparation of SERS-active electrospun nanofibers surface-decorated with AgNPs. | ||
Furthermore, by using the Raman report molecules, crystal violet (CV) and p-aminothiophenol (p-ATP) as typical examples, it was found that the as-prepared AgNPs/polymer nanofibrous mats exhibit very strong SERS activity. The SERS signals display perfect stability under continuous laser irradiation as well as good uniform response. We further demonstrate that the AgNPs/polymer nanofibrous mats can be conveniently applied as SERS substrates by taking the example of malachite green (MG), a significant environmental organic pollutant for its genotoxicity and carcinogenicity23 that is often illegally used in the aquaculture industry, showing that the SERS substrate can give good reproducible results.
Experimental section
Reagents
Polyvinylpyrrolidone (PVP) (Mw = 1![[thin space (1/6-em)]](https://www.rsc.org/images/entities/char_2009.gif) 300
300![[thin space (1/6-em)]](https://www.rsc.org/images/entities/char_2009.gif) 000), crystal violet (CV) and p-aminothiophenol (p-ATP) used in this study were purchased from Aladdin, Ltd. Silver nitrate and malachite green (MG) were obtained from Sigma-Aldrich. Poly(methacrylic acid) (PMAA) (Mw = 9500) and dehydrated alcohol (>99%) were purchased from Chongqing Chuandong Ltd. All chemicals were used without further purification. Water was purified by a Milli-Q system (Millipore).
000), crystal violet (CV) and p-aminothiophenol (p-ATP) used in this study were purchased from Aladdin, Ltd. Silver nitrate and malachite green (MG) were obtained from Sigma-Aldrich. Poly(methacrylic acid) (PMAA) (Mw = 9500) and dehydrated alcohol (>99%) were purchased from Chongqing Chuandong Ltd. All chemicals were used without further purification. Water was purified by a Milli-Q system (Millipore).
Apparatus
A desk lamp (11 W), 365 nm UV lamp and 254 nm UV lamp with a power of 11 W were employed as the irradiation sources. A S-4800 scanning electron microscope (SEM, Hitachi, Tokyo, Japan) and transmission electron microscope (TEM, Hitachi) were used for SEM and TEM imaging, respectively. X-ray photoelectron spectroscopy (XPS) analysis was performed on an ESCRLRB250X (America) spectrometer with a standard Al Kα source (hν = 1486.6 eV). X-ray powder diffraction (XRD) patterns were obtained by a Shimadzu XRD-7000 (Beijing Purkinje General Instrument Co. Ltd.) and filtered by a Cu-Kα (1.5405 Å) radiation source under an operating voltage and current of 40 kV and 50 mA. UV-vis absorption spectra were measured at room temperature with a Hitachi U-3600 spectrophotometer (Shimadzu, Japan). Fourier transform infrared (FT-IR) spectra were recorded by a Fourier transform infrared spectrometer (Shimadzu, 8400S, Japan) from 4000 to 500 cm−1 at room temperature. The prepared electrospun mats were dried overnight at 30 °C under vacuum. For the measurement of SERS spectra, a LabRAM-HR Raman spectrometer (HORIBA Jobin Yvon, France) was used, and the excitation source was 532 nm using an accumulation time of 1 s.Preparation of electrospun solution
PVP powders were first dissolved in ethanol to make an 8 wt% solution. A specific amount of a freshly prepared solution of silver nitrate was made by dissolving in water and transferred to the PVP solution. The AgNO3/PVP mixed solution was magnetically stirred for 3 h. A known amount of 10 wt% PMAA was added to the AgNO3/PVP mixed solution. The relative concentrations of the solutions are denoted as a percentage value: for instance, a 200% silver/MAA molar ratio indicates that there are two Ag ions per methacrylic acid unit. The aforementioned mixture was magnetically stirred until PMAA was dispersed completely to form the electrospun solution. For comparison, the electrospun solution containing AgNO3 only without PMAA was prepared in a similar fashion to the aforementioned method.Electrospinning
The electrospun solution was then transferred to a 10 mL tip plastic syringe. The electrospun nanofibers were prepared with commercial electrospinning equipment (DNF-001, Beijing Kaiweixin Technology Co., Ltd, China). The electrospinning parameters were set at an applied voltage of 20 kV, a collection distance of 20 cm, and the electrospinning solution feed rate was controlled at 0.03 mm min−1. The sample nanofibers were collected as overlaid membranes on electrically grounded aluminum foil that covered the plate. After being electrospun, the formed electrospun fibrous mats were vacuum dried at 30 °C overnight to remove the residual solvent and moisture for characterizations.Photoreduction
The as-prepared fibrous mats were placed in a dark room and were subjected to light for a certain time. With irradiation time, the mats gradually changed from white to light pink or to dark pink or khaki, which depended on the different light sources if exposure times were long enough. Three different sources of light were used to produce the AgNPs, including a desk lamp and UV light with different wavenumbers, i.e., 365 nm and 254 nm. When using the desk lamp, the experiments were performed in a dark cupboard to avoid other types of light. Note that different light sources led to different results.Reproducibility detection with the SERS matrix
The obtained electrospun mats were first immersed into 10−4 M p-ATP ethanol solution overnight. Then, the mats were washed thoroughly with ethanol to remove unbound p-ATP molecules, and finally the samples were dried at room temperature to evaporate all of the ethanol. 10−6 M CV and MG aqueous solution were used by following the same treatment as that previously mentioned. For comparison, local fishery water was also employed by filtering with 0.45 μm filter film after boiling to expel the impurities and then stored at room temperature.Results and discussion
Preparation of electrospun AgNPs/PMAA/PVP mats
Under the optimal electrospinning parameters, smooth and uniform PVP, PMAA/PVP, and AgNO3/PMAA/PVP nanofibers before illumination were prepared at first. Fig. 1 showed SEM images of the composite nanofibers, and the size distribution histograms of nanofibers calculated from the corresponding SEM images, giving mean diameters of 313 nm, 355 nm, and 304 nm, respectively.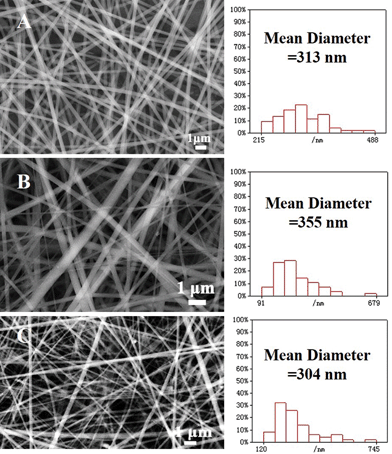 | ||
| Fig. 1 SEM images and diameter histograms of electrospun nanofibers: (A) only PVP, (B) PMAA/PVP, and (C) AgNO3/PMAA/PVP before illumination. | ||
Then, photoreduction treatment was introduced under a different light source for 24 h. Typical SEM images of AgNPs/PMAA/PVP nanofibers fabricated with different light sources are showed in Fig. 2. As can be seen, the hybrid nanofibers exhibited a smooth surface and uniform diameter. After the formation of AgNPs, no apparent change was observed either in the size or overall pattern of the AgNPs/PMAA/PVP composite nanofibers. Moreover, the mean diameter of AgNPs/PMAA/PVP nanofibers at any light source was apparently smaller than that of PVP or PMAA/PVP nanofibers without AgNPs, suggesting that the addition of AgNO3 changed the conductivity, surface tension and viscosity of the electrospun solution, resulting in the variation of the diameter. It was interesting that abundant AgNPs on the surface of PMAA/PVP at both the desk lamp and the 365 nm UV lamp could be observed, but AgNPs could be rarely seen at the 254 nm UV lamp. We suppose that the energy of the light source might be responsible for the reductive efficacy of the hybrid nanofibers.
From the Fig. 2 inset, it could be clearly seen that the AgNPs were distributed on the nanofiber surface with a high density under the condition of the desk lamp and 365 nm UV lamp, which was significant for the improvement of sensing performance. The TEM images clearly showed that both the inner and outer surfaces distributed large amounts of AgNPs with the diameter ranging from 5 to 19 nm. The TEM image also indicated that there was no change to the nanofibers' morphology during the reduction of the silver ions.
Characterization of electrospun AgNPs/PMAA/PVP mats
The effects of the light source and the photo-reduction time on the formation of AgNPs were also examined. The light source contained a desk lamp, a 365 nm UV lamp, and a 254 nm UV lamp, and the photoreduction time ranged from 0 h to 24 h. The corresponding photographs (Fig. 3) and SEM images showed the reductive process (ESI, Fig. S1†). Silver ion has strong optical properties in a specific visible-light region; moreover, silver ions can be converted into silver atoms when induced by ultraviolet light, further reuniting into the form of nanoparticles.24 Herein, the photochemical reaction for generating AgNPs is depicted in the following chemical equation: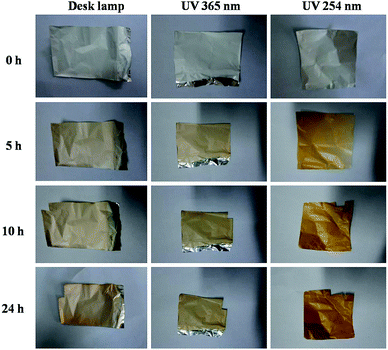 | ||
| Fig. 3 Photographs of electrospun fiber mats from the AgNO3/PMAA/PVP solution that had been illuminated by different light sources for different illumination times. | ||
Thus, the treatment of irradiation played a major role in forming AgNPs embedded in the nanofibers. The amounts of AgNPs on the polymer increased as the illuminated time increased for the same light source. Presumably, this is because of the slower diffusion of the reactive species produced by the light source penetrating into the interior of the thicker chain length polymers.
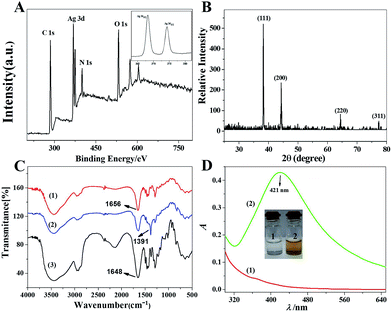
More detailed information regarding the chemical and bonding environment of the PMAA/PVP and AgNPs were ascertained using X-ray photoelectron spectroscopy (XPS). Fig. 4A showed the fully scanned spectra, demonstrating that C, O, N and Ag existed in AgNPs/PMAA/PVP. It can be seen from the inset that the peaks occurred at 368.3 eV and 374.3 eV, which corresponds well to Ag 3d5/2 and 3d3/2 binding energies, respectively. The splitting of the 3d doublet is 6 eV, indicating the metallic nature of silver.25 XPS spectra of the C 1s, O 1s and N 1s of PVP were not changed after AgNPs were immobilized into PMAA/PVP. Moreover, there was no carboxyl carbon (O–C![[double bond, length as m-dash]](https://www.rsc.org/images/entities/char_e001.gif) O) peak, which was located at 289 eV, suggesting that the carboxyl of PMAA did not coordinate with Ag ions but instead adsorbed a large amount of Ag ions. According to the XPS spectra, it was concluded that carbonyl oxygen of PVP donated lone pair electrons to sp orbitals of silver, which decreased the electron density of carbonyl oxygen and increased the electron density of silver. Thus, it was the strong Ag–O coordination that prevented the Ag ions immobilized in the PMAA/PVP nanofibers from agglomeration. Moreover, the steric effect of PVP might also help to forbid silver grain growth. More importantly, PMAA is not only acting as an effective stabilizer that prevents agglomeration of the AgNPs, but it is also essential for good morphologies of nanofibers formation when used in the appropriate concentration.
O) peak, which was located at 289 eV, suggesting that the carboxyl of PMAA did not coordinate with Ag ions but instead adsorbed a large amount of Ag ions. According to the XPS spectra, it was concluded that carbonyl oxygen of PVP donated lone pair electrons to sp orbitals of silver, which decreased the electron density of carbonyl oxygen and increased the electron density of silver. Thus, it was the strong Ag–O coordination that prevented the Ag ions immobilized in the PMAA/PVP nanofibers from agglomeration. Moreover, the steric effect of PVP might also help to forbid silver grain growth. More importantly, PMAA is not only acting as an effective stabilizer that prevents agglomeration of the AgNPs, but it is also essential for good morphologies of nanofibers formation when used in the appropriate concentration.
In order to further determine the crystal nature of AgNPs, the crystallinity of AgNPs immobilized into the PMAA/PVP nanofibers was also analyzed using X-ray diffraction (XRD) (Fig. 4B). A typical XRD pattern of the as-prepared AgNPs showed the diffraction peaks with 2θ values of 38.2°, 44.2°, 64.4° and 77.4°, corresponding to the (111), (200), (220) and (311) (specific for elemental Ag were present) crystal faces of the face-centered cubic (fcc) structure of metallic silver, in agreement with the literature.26,27 This further supported that the AgNPs were successfully reduced on the PMAA/PVP polymer matrix.
The FTIR spectra (Fig. 4C) of PMAA/PVP nanofibrous mats display a significant difference before and after the immobilization of AgNPs. A strong absorption peak at 1648 cm−1 was assigned to the free carbonyl group (C![[double bond, length as m-dash]](https://www.rsc.org/images/entities/char_e001.gif) O asymmetric stretching) of PVP, and the peak at 1656 cm−1 was attributed to COO– asymmetric vibrations of PMAA. A new peak at 1391 cm−1 appeared after the AgNPs loaded indicated the interaction between AgNPs and carbonyl groups of PVP. Moreover, after the formation of AgNPs in the PMAA/PVP nanofibers, the spectral features of the nanofibers appeared to be broader.
O asymmetric stretching) of PVP, and the peak at 1656 cm−1 was attributed to COO– asymmetric vibrations of PMAA. A new peak at 1391 cm−1 appeared after the AgNPs loaded indicated the interaction between AgNPs and carbonyl groups of PVP. Moreover, after the formation of AgNPs in the PMAA/PVP nanofibers, the spectral features of the nanofibers appeared to be broader.
Further investigation found that the sizes of the AgNPs on the surfaces of the PMAA/PVP nanofibers could be controlled by appropriately adjusting the light source during the in situ reduction. It is well-known that the optical absorption spectra of noble metal NPs are dominated by their sizes and shapes.28 Therefore, the UV-vis absorption spectra of the as-prepared AgNPs/PMAA/PVP composites were carried out, and the corresponding results were shown in Fig. 4D. There were no distinct adsorption peaks for the AgNO3/PMAA/PVP before illumination in the visible region. Nevertheless, a relatively strong adsorption peak centered at around 430 nm was observed after illumination (Fig. 4D(2)) due to the surface plasmon resonance (SPR) absorption of the AgNPs. The inset of Fig. 4D showed the optical images of the as-prepared products dissolved in water. The AgNO3/PMAA/PVP before illumination were colorless, indicating that PMAA did not have an effect on the optical properties of AgNPs/PMAA/PVP. In addition, the AgNPs/PMAA/PVP composites after the reduction were brownish-yellow in accordance with its absorption peak.
Role of PMAA in the AgNPs/PMAA/PVP system
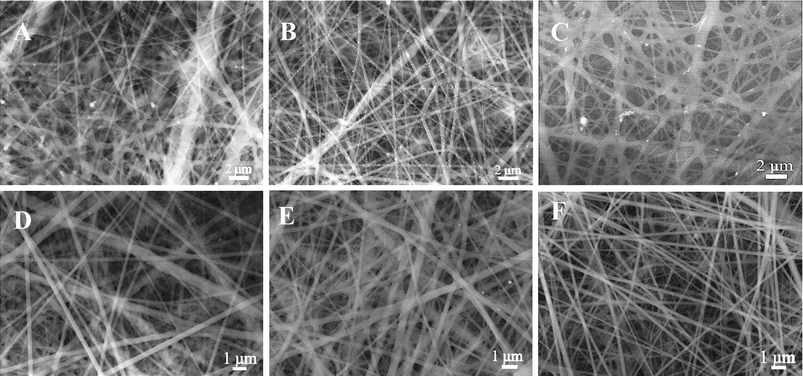
In order to gain insight into the positive effect of the PMAA, the SEM images were obtained. The concentration of PMAA in the precursor solution was varied (Fig. 5A–C). Bead-free fibers were obtained at any content of PMAA. From Fig. 5A–C, it was apparent that a limited amount of AgNPs were formed on the surface of PVP at the molar ratio of 200![[thin space (1/6-em)]](https://www.rsc.org/images/entities/char_2009.gif) :
:![[thin space (1/6-em)]](https://www.rsc.org/images/entities/char_2009.gif) 1 (Ag–MAA). The fiber morphology became dramatically cross-linked with increased concentration to 600
1 (Ag–MAA). The fiber morphology became dramatically cross-linked with increased concentration to 600![[thin space (1/6-em)]](https://www.rsc.org/images/entities/char_2009.gif) :
:![[thin space (1/6-em)]](https://www.rsc.org/images/entities/char_2009.gif) 1 (Ag–MAA) due to the difficulty of phase separation. When the molar ratio was 400
1 (Ag–MAA) due to the difficulty of phase separation. When the molar ratio was 400![[thin space (1/6-em)]](https://www.rsc.org/images/entities/char_2009.gif) :
:![[thin space (1/6-em)]](https://www.rsc.org/images/entities/char_2009.gif) 1, the AgNO3/PMAA/PVP system can be tuned to facilitate electrospinnability by a proper formulation of the dispersion, and thus, high yield, uniform distribution, and high performance AgNP/PMAA/PVP composites were obtained. In contrast to the case without PMAA, nearly no AgNPs were observed from the SEM images (Fig. 5D–F) of electrospun fiber mats from only the AgNO3/PVP solution. This result indicated the importance of PMAA introduced in this system.
1, the AgNO3/PMAA/PVP system can be tuned to facilitate electrospinnability by a proper formulation of the dispersion, and thus, high yield, uniform distribution, and high performance AgNP/PMAA/PVP composites were obtained. In contrast to the case without PMAA, nearly no AgNPs were observed from the SEM images (Fig. 5D–F) of electrospun fiber mats from only the AgNO3/PVP solution. This result indicated the importance of PMAA introduced in this system.
Because the PMAA chain can provide adsorptive –COOH groups on the polymer nanofibers, it can serve as carriers for silver ions to make as many more silver ions as possible to absorb onto the surface of polymer. Naturally, a distinctive feature is the high yield and uniform distribution of AgNPs on the surface of polymer. Overall, with the adsorption of PMAA and the high coordination affinity for silver ions of PVP, we present an easily controlled preparation of AgNP/polymer composites using PMAA. Because PMAA is a linear molecule, it acts as an adsorbing agent to absorb large amounts of silver ions; moreover, the polymer PVP acts as the stabilizer to protect the AgNPs. The polymer template usually serves to both control the particle size and passivates the surfaces of the nanoparticles against agglomeration.
SERS properties of electrospun AgNPs/PMAA/PVP mats
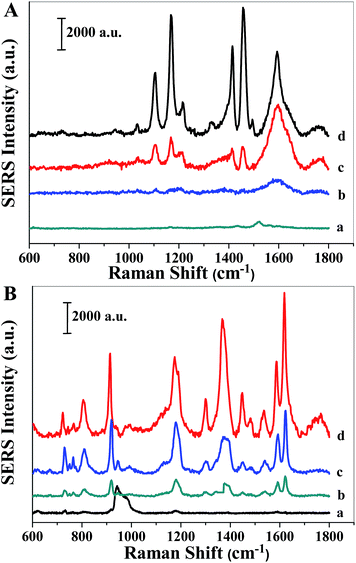
The formed AgNPs in PMAA/PVP fibers had high local electromagnetism, and they could be used as SERS substrates for molecular sensing with high sensitivity and universality.To estimate the SERS activity of the AgNPs/PMAA/PVP, 10−4 M of p-aminothiophenol (p-ATP) aqueous solution was chosen as the probe molecule because p-ATP has distinct Raman features, and it is easily absorbed on the surface of AgNPs for the bond of –SH (obtained SERS spectra are shown in Fig. 6A). The SERS spectra of p-ATP on the nanofibrous mats were also collected as the contrast before illumination. Moreover, after the AgNPs/PMAA/PVP nanofibrous mats are immersed in p-ATP ethanol solution, the p-ATP molecules can permeate into the fiber, access the AgNPs, and be trapped in the hotspot region in an ethanol solution. The primary vibrations of p-ATP were confirmed according to the literature.29 Two sets of bands were observed on the SERS spectra of p-ATP on the as-prepared substrates: 1580, 1187, and 1082 cm−1 assigned to a1 vibration modes and 1436, 1388, and 1147 cm−1 assigned to the b2 vibration modes. The relative intensity of the peaks in the spectra on AgNPs/PMAA/PVP indicated that the p-ATP adsorbed on AgNPs, according to the cleavage of the Ag–S bond in the same orientation. The distinct intensities of SERS spectra on AgNPs/PMAA/PVP by 365 nm UV lamp and the desk lamp were much stronger than that by 254 nm UV lamp. A possible reason was proposed for the difference of the intensity: the content of adsorbed p-ATP on AgNPs are different, it is obviously that the amounts of AgNPs by 365 nm UV lamp and desk lamp illuminated are more than that by 254 nm UV lamp, which corresponding to the results of the SEM images. The SERS enhancement was largely determined by the number of AgNPs (dispersed or aggregated), because more p-ATP molecules could be adsorbed on the surface of AgNPs and be activated by the hot spots formed in the nanoscale junctions and interstices.
To further investigate the universality of the as-prepared substrates, in addition to p-ATP, crystal violet (CV) was also used as a probe molecule. Fig. 6B presents the SERS spectra of 10−6 M CV on the AgNPs/PMAA/PVP substrates with different light sources. The characteristic SERS peaks of CV molecules can be identified, and their intensities also dramatically change with different light sources. Maximum enhancement occurred with light sources from the desk lamp and the 365 nm UV lamp. As can be seen in Fig. 6B, the SERS band at 806 cm−1, 914 cm−1, 1177 cm−1, 1370 cm−1, and 1625 cm−1 are assigned to the characteristic peaks for CV molecules. This indicates that in the focal area, there is rather a small number of highly SERS-active sites, which provide very high surface enhancement.
To use SERS as a routine analytical tool, the reproducibility of Raman signals is of crucial importance and is estimated by the relative standard deviation (RSD) of a major SERS peak. In this work, we collected SERS spectra of CV molecules with a concentration of 10−6 M from thirteen randomly selected positions estimated on the AgNPs/PMAA/PVP electrospun nanofibrous mats, and the RSD were calculated by the method reported.30 With this method, both an overall impression and a detailed depiction of reproducibility can be provided (Fig. S2†). In this case, RSD values of signal intensities of major SERS peaks were observed to be below 0.2%, revealing good reproducibility across the entire area of the optimized AgNPs/PMAA/PVP electrospun mats (Table S1†).
According to the results of p-ATP and CV SERS spectra, it was evident that with the enrichment from the PMAA, the SERS intensity of the probe molecules on AgNPs/PMAA/PVP was stronger than that on AgNPs/PVP, which enables qualitative detection of p-ATP and CV. As compared to the common AgNPs/polymer composites, the AgNPs reported previously were mostly encapsulated in polymer matrices; thus, the molecules of analytes applied to SERS have to diffuse/permeate into nanofibers to access these AgNPs. In this study, AgNPs that attached to electrospun nanofibers can adsorb analytes directly onto their surfaces, leading to superior SERS sensitivity. The high density AgNPs are attributed to the three-dimensional network nanostructure of the AgNPs/PMAA/PVP membrane, which provide large surface area-to-volume ratio. Most importantly, PMAA serves as the carrier of silver ions. SEM images without PMAA analysis indicate the apparent lower density AgNPs on the surface of PVP nanofibers. It is known that the high probe density can facilitate the improvement of sensitivity by maximizing the number of target molecules captured by the sensing material. This result further demonstrates the superiority of the composite as a SERS substrate.
AgNPs/PMAA/PVP nanofibrous mats as SERS substrates for MG detection
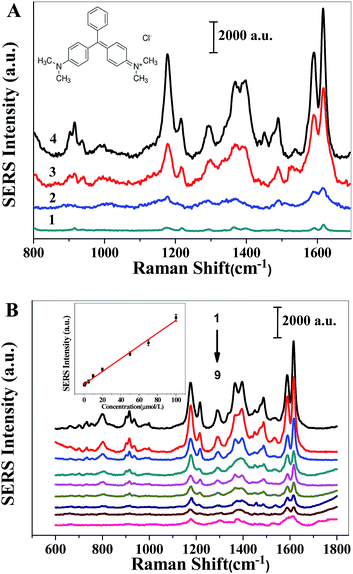
Malachite green (MG) is a cationic triphenylmethane dye used in the aquaculture industry and is banned in several countries for its genotoxicity and carcinogenicity.23 Currently, various analytical methods, including liquid chromatography,31 electrochemistry,32 chromatography-mass spectrometry spectrum,33,34 and capillary electrophoresis, have been employed.35 However, they are restricted by poor detection limits, time consuming nature and indirect measurements. Therefore, the development of a highly sensitive and selective analytical methodology of MG is of great importance. SERS is a rapid and sensitive analytical method in various areas;36,37 consequently, the SERS signals were applied to the quantitative analysis of MG in this work.Due to the π electron of the benzene ring and the positive charge of MG, MG can be well integrated with the pyrrole ring of the PVP and PMAA through π–π stacking and electrostatic interaction. Taking the advantages of the chemical enhancement effect from PVP and the electromagnetic enhancement effect from PMAA, MG can be detected sensitively by using the AgNP/PMAA/PVP composite nanofibers as SERS substrates. Fig. 7A shows the SERS spectra of 2 × 10⁻⁶ M MG on the AgNP/PMAA/PVP substrates with different light sources. As can be seen, a strong SERS spectrum was achieved with the UV light at 365 nm. The most prominent peaks at 1175, 1367 and 1618 cm−1 were assigned to the in-plane modes of C–H bending, N-phenyl stretching, and C–C stretching, respectively. The peaks around 917, 1219, and 1398 cm−1 were attributed to C–H out-of-plane bending, C–H rocking and N-phenyl stretching modes. However, the SERS intensities of the MG reduced by UV light at 254 nm and the desk lamp were lower than UV light at 365 nm.
Under the optimal light source, SERS spectra of different concentrations with MG were detected, as shown in Fig. 7B. It can be seen that the intensity of the SERS spectra increased with increasing concentrations of MG. The SERS intensity of the vibration located at 1618 cm−1 vs. the concentration of MG was also plotted in Fig. 7B, which revealed a good linearity over the MG concentration range from 0.5 μmol L−1 to 100 μmol L−1 of MG (r2 = 0.9929), and the equation of linear regression was I = 1135.2 + 80.5c (MG, 10−6 mol L−1). Considering that the as-prepared nanohybrids have a high enhancement effect, they can be used as a potential SERS sensor to detect environmentally harmful substances.
To investigate its application in practical sample analysis, the proposed procedure was performed to detect MG in a fishery water sample, and the studies of recovery were carried out on the samples. An additional procedure to remove the environmental pollutants was unnecessary. It was found that the recoveries of these samples are between 94% and 102.5% (Table S2†). The real sample determination proved that the AgNPs/PMAA/PVP composite nanofibers are efficient SERS substrates for the detection of MG in water samples, and the ignorance of the background indicates the potential application for detecting MG in other practical systems.
Conclusions
In summary, we developed a convenient and cost-effective approach to fabricate the PMAA/AgNPs/PVP composite mats with well-dispersed AgNPs on the electropun nanofibers. Based on this novel composite, the highly active SERS substrates exhibiting high performance, good stability, as well as the dramatic capability of repetitive measurement were constructed. The density of AgNPs, which had an important impact on SERS activity, could be controlled by different light sources and illumination times. The introduction of PMAA in the AgNP/PMAA/PVP composites plays an important role on the electrospun nanofibrous mats because it adsorbs large amounts of silver ions into the polymer. The novelty of the methodology provides a universal platform for the fabrication of composite membranes by decorating noble metal nanoparticles onto electrospun nanofibers, which could possibly be used in a broad range of applications.Acknowledgements
This work was financially supported by the Natural Science Foundation of China (21035005) and the Cultivation Plan of Chongqing Science & Technology Commission for 100 Outstanding Science and Technology Leading Talents.Notes and references
- R. Ostermann, J. Cravillon, C. Weidmann, M. Wiebcke and B. M. Smarsly, Chem. Commun., 2011, 47, 442–444 RSC.
- H. Yang, P. F. Gao, W. B. Wu, X. X. Yang, Q. L. Zeng, C. Li and C. Z. Huang, Polym. Chem., 2014, 5, 1965–1975 RSC.
- S. C. Davies and K. J. Klabunde, Chem. Rev., 1982, 82, 153–208 CrossRef.
- R. M. Crooks, M. Zhao, L. Sun, V. Chechik and L. Yeung, Acc. Chem. Res., 2001, 34, 181–190 CrossRef CAS PubMed.
- J. Song, M. Chen, M. B. Olesen, C. Wang, R. Havelund, Q. Li, E. Xie, R. Yang, P. Bøggild, C. Wang, F. Besenbacher and M. Dong, Nanoscale, 2011, 3, 4966–4971 RSC.
- K. Gries, H. Vieker, A. Gölzhäuser, S. Agarwal and A. Greiner, Small, 2012, 8, 1436–1441 CrossRef CAS PubMed.
- W. Wang, Z. Feng, W. Jiang and J. Zhan, CrystEngComm, 2013, 15, 1339–1344 RSC.
- P. Zhang, C. Shao, Z. Zhang, M. Zhang, J. Mu, Z. Guo and Y. Liu, Nanoscale, 2011, 3, 3357–3363 RSC.
- J. Mu, C. Shao, Z. Guo, Z. Zhang, M. Zhang, P. Zhang, B. Chen and Y. Liu, ACS Appl. Mater. Interfaces, 2011, 3, 590–596 CAS.
- Z. Zhang, C. Shao, Y. Sun, J. Mu, M. Zhang, P. Zhang, Z. Guo, P. Liang, C. Wang and Y. Liu, J. Mater. Chem., 2012, 22, 1387–1395 RSC.
- H. Wang, D. Wang, Z. Peng, W. Tang, N. Li and F. Liu, Chem. Commun., 2013, 49, 5568–5570 RSC.
- D. He, B. Hu, Q. F. Yao, K. Wang and S. H. Yu, ACS Nano, 2009, 3, 3993–4002 CrossRef CAS PubMed.
- S. Xiao, W. Xu, H. Ma and X. Fang, RSC Adv., 2012, 2, 319–327 RSC.
- Z. Y. Li, H. M. Huang, T. C. Shang, F. Yang, W. Zheng, C. Wang and S. K. Manohar, Nanotechnology, 2006, 17, 917–920 CrossRef CAS.
- H. He, W. P. Cai, Y. X. Lin and Z. F. Dai, Langmuir, 2011, 27, 1551–1555 CrossRef CAS PubMed.
- A. C. Patel, S. Li, C. Wang, W. Zhang and Y. Wei, Chem. Mater., 2007, 19, 1231–1238 CrossRef CAS.
- H. Dong, D. Wang, G. Sun and J. P. Hinestroza, Chem. Mater., 2008, 20, 6627–6632 CrossRef CAS.
- C. H. Lee, L. M. Tian, A. Abbas, R. Kattumenu and S. Singamanen, Nanotechnology, 2011, 22, 275311–275318 CrossRef PubMed.
- C. L. Zhang, K. P. Lv, H. P. Cong and S. H. Yu, Small, 2012, 8, 648–653 CrossRef CAS PubMed.
- C. L. Zhang, K. P. Lv, H. T. Huang, H. P. Cong and S. H. Yu, Nanoscale, 2012, 4, 5348–5355 RSC.
- W. Y. Zhang, X. Z. Xiao, C. Lv, J. Zhao, G. Wang, X. Gu, R. Zhang, B. B. Xu, D. D. Zhang, A. W. Li, Y. L. Zhang and H. B. Sun, Macromol. Res., 2013, 21, 306–310 CrossRef CAS PubMed.
- H. X. Xu and K. S. Suslick, ACS Nano, 2010, 4, 3209–3214 CrossRef CAS PubMed.
- D. J. Alderman, J. Fish Dis., 1985, 8, 289–298 CrossRef CAS PubMed.
- P. Rujitanaroj, N. Pimpha and P. Supaphol, J. Appl. Polym. Sci., 2010, 116, 1967–1976 CAS.
- D. Lin, H. Wu, R. Zhang and W. Pan, Chem. Mater., 2009, 21, 3479–3484 CrossRef CAS.
- D. Cheng, X. Zhou, H. Xia and H. S. O. Chan, Chem. Mater., 2005, 17, 3578–3581 CrossRef CAS.
- Y. Lu, Y. Mei, M. Schrinner, M. Ballauff, M. W. Moller and J. Breu, J. Phys. Chem. C, 2007, 111, 7676–7681 CAS.
- B. Chen, X. Jiao and D. Chen, Cryst. Growth Des., 2010, 10, 3378–3386 CAS.
- M. Osawa, N. Matsuda, K. Yoshii and I. Uchida, J. Phys. Chem., 1994, 98, 12702–21707 CrossRef CAS.
- B. Zhang, H. Wang, L. Lu, K. Ai, G. Zhang and X. Cheng, Adv. Funct. Mater., 2008, 18, 2348–2355 CrossRef CAS PubMed.
- K. Mitrowska, A. Posyniak and J. Zmudzki, J. Chromatogr. A, 2005, 1089, 187–192 CrossRef CAS PubMed.
- P. Ngamukot, T. Charoenraks, O. Chailapakul, S. Motomizu and S. Chuanuwatanakul, Anal. Sci., 2006, 22, 111–116 CrossRef CAS.
- L. Valle, C. Díaz, A. L. Zanocco and P. Richter, J. Chromatogr. A, 2005, 1067, 101–105 CrossRef CAS PubMed.
- P. Scherpenisse and A. A. Bergwerff, Anal. Chim. Acta, 2005, 529, 173–177 CrossRef CAS PubMed.
- A. A. Bergwerff and P. Scherpenisse, J. Chromatogr. B: Anal. Technol. Biomed. Life Sci., 2003, 788, 351–359 CrossRef CAS.
- W. L. Fu, S. J. Zhen and C. Z. Huang, Analyst, 2013, 138, 3075–3081 RSC.
- S. Lee, J. Choi, L. Chen, B. Park, J. B. Kyong, G. H. Seong, J. Choo, Y. Lee, K. H. Shin, E. K. Lee, S. W. Joo and K. H. Lee, Anal. Chim. Acta, 2007, 590, 139–144 CrossRef CAS PubMed.
Footnote |
| † Electronic supplementary information (ESI) available: Experimental section and additional figures (Fig. S1 and S2) and tables (Tables S1 and S2). See DOI: 10.1039/c4ra05737f |
| This journal is © The Royal Society of Chemistry 2014 |


