Mononuclear rhenium(I) complexes incorporating 2-(arylazo)phenyl benzyl thioethers: synthesis, structure, spectral, DFT and TDDFT studies†
Pallab Mondal,
Rupa Sarkar,
Amar Hens and
Kajal Krishna Rajak*
Inorganic Chemistry Section, Department of Chemistry, Jadavpur University, Kolkata 700032, India. E-mail: kajalrajak@hotmail.com; kkrajak@chemistry.jdvu.ac.in
First published on 13th August 2014
Abstract
The stoichiometric reaction of [Re(CO)5Cl] with 2-(arylazo)phenyl benzyl thioethers [ArNNC6H4SCH2Ph: Ar = Ph, 4-chlorophenyl, 4-nitrophenyl] (L1–L3) in a ratio of 1![[thin space (1/6-em)]](https://www.rsc.org/images/entities/char_2009.gif) :
:![[thin space (1/6-em)]](https://www.rsc.org/images/entities/char_2009.gif) 1 in dry toluene under refluxing condition afforded the Re(I) complexes of general formula fac-[Re(L)(CO)3Cl] in excellent yields. The ligands used in this present work are 2-(phenylazo)phenyl benzyl thioether (L1), 2-(4-chlorophenylazo)phenyl benzyl thioether (L2) and 2-(4-nitrophenylazo)phenyl benzyl thioether (L3). The elemental analysis and ESI mass spectroscopic measurements ensure the formation of desired complexes. The crystal structure of the complexes [Re(L1)(CO)3Cl], 1 and [Re(L2)(CO)3Cl], 2 were determined by X-ray diffractometry study. The molecular structures observed in the solid state were retained in the solution (1H and 13C NMR spectra). The ground and excited-state geometries, NMR, absorption, and luminescent properties of three Re(I) complexes were examined by DFT and TDDFT methods. The introduction of an electron withdrawing group at the para position of the phenyl ring attached to the N
1 in dry toluene under refluxing condition afforded the Re(I) complexes of general formula fac-[Re(L)(CO)3Cl] in excellent yields. The ligands used in this present work are 2-(phenylazo)phenyl benzyl thioether (L1), 2-(4-chlorophenylazo)phenyl benzyl thioether (L2) and 2-(4-nitrophenylazo)phenyl benzyl thioether (L3). The elemental analysis and ESI mass spectroscopic measurements ensure the formation of desired complexes. The crystal structure of the complexes [Re(L1)(CO)3Cl], 1 and [Re(L2)(CO)3Cl], 2 were determined by X-ray diffractometry study. The molecular structures observed in the solid state were retained in the solution (1H and 13C NMR spectra). The ground and excited-state geometries, NMR, absorption, and luminescent properties of three Re(I) complexes were examined by DFT and TDDFT methods. The introduction of an electron withdrawing group at the para position of the phenyl ring attached to the N![[double bond, length as m-dash]](https://www.rsc.org/images/entities/char_e001.gif) N bond varies the frontier molecular orbital energies, compositions and optical properties of these molecules significantly. The lowest lying triplet excited is associated with an admixture of the 3MLCT and 3ILCT excited state having a cis conformation of the azoaryl moiety. The emission like transition having mixed 3MLCT and 3ILCT nature was characterized by natural transition orbital (NTO) and spin density difference map analysis. The presence of the electron withdrawing NO2 group leads to the low quantum yield through enhanced non-radiative deactivation. The cis orientation at the lowest lying triplet excited state (T1) may imply some kind of photoinduced isomerization in the ligand frame and as a result there may be more than one emitting species in the solution and hence bi-exponential decay nature was observed for all the complexes.
N bond varies the frontier molecular orbital energies, compositions and optical properties of these molecules significantly. The lowest lying triplet excited is associated with an admixture of the 3MLCT and 3ILCT excited state having a cis conformation of the azoaryl moiety. The emission like transition having mixed 3MLCT and 3ILCT nature was characterized by natural transition orbital (NTO) and spin density difference map analysis. The presence of the electron withdrawing NO2 group leads to the low quantum yield through enhanced non-radiative deactivation. The cis orientation at the lowest lying triplet excited state (T1) may imply some kind of photoinduced isomerization in the ligand frame and as a result there may be more than one emitting species in the solution and hence bi-exponential decay nature was observed for all the complexes.
Introduction
The synthesis and photophysical investigation of nd6 metal complexes,1 such as those of Re(I),2 Ru(II),3 Os(II),4 and Ir(III),5 is still a very active area of research due to their potential application in the fabrication of organic light emitting diodes (OLEDs).6 Among them the Re(I) complexes bearing fac-[Re(CO)3]+ core are receiving growing interest due to their rich photophysical, photochemical, and electrochemical properties.7–9 They also have potential applications as luminescent10,11 and light-harvesting materials,12 photocatalysts for the reduction of CO2,13–15 solar cells,16 therapeutic radiopharmaceuticals,17 and in the field of bioimaging.18Such Re(I) complexes which are found to show attractive excited-state redox properties and intense luminescence in the visible region of the spectrum are stable to photodecomposition. It is documented in the literature that the excited-state life times are largely dependent on the nonradiative rate constant (knr) values because of “energy-gap law” behavior. It has also been established by excited-state resonance Raman experiments19 that a high frequency CO stretching mode is mainly responsible for radiationless decay process via accepting mode. Thus the materials generated by the removal of CO from [Re(CO)5]+ are expected to increase both quantum yield and life time of the new species. The above state of development has generated a lot of interest to synthesize and characterize new Re(I) complexes bearing [Re(CO)3]+ core.
However, performances of Re(I) complex-based OLEDs are far from practical application in electroluminescence because of serious triplet–triplet annihilation (TTA) of the emitters, caused by saturation of the emissive sites, which leads to low efficiency at high current density.20 Many efforts have been focused on both the ligand structure and rigidity of the complexes to tune the excited state properties. This problem can be solved by the addition of functional groups with electron-accepting or -donating properties into ligands.21,22
Again chelating ligands containing N, S donor atoms have unique interest in the coordination chemistry because of the stability, chemical and electrochemical activities and diversity in binding to metal ions.23 In recent years, several groups have used polydentate ligands with thioether moieties for the synthesis of model complexes to mimicking the spectroscopic and structural properties of the active sites of metallo proteins.24
The HOMO and LUMO energy levels and the band gap of Re(I) complexes can be finely tuned by exchange and/or substitution of ligands, and furthermore, the inclusion of a photoresponsive π-conjugations component into a supramolecular structure is a promising approach to synthesize the photo assisted isomeric species that may be quite valuable as model systems for theoretical studies and can be applied in photo switches or molecular memory units. It has been documented in the literature25,26 that the energy transfer from the metal-to-ligand charge-transfer excited state, 3MLCT, to a ligand centered state, 3ILtrans-L of the ligand mainly responsible for the isomerization.
By considering the above mentioned facts we have successfully designed and synthesized three N, S coordinating ligands 2-(arylazo)phenyl benzyl thioethers [ArNNC6H4SCH2Ph: Ar = Ph, 4-chlorophenyl, 4-nitrophenyl] (L1–L3) containing electron withdrawing group (Cl and NO2) and their corresponding mononuclear Re(I) complexes having [Re(CO)3]+ core. The complexes were characterized by elemental analysis and different spectroscopic techniques. X-ray structures of the selected complexes were determined. The electrochemical behavior was also examined. The photophysical properties of the complexes were also investigated. Here we have also reported the effect of electron withdrawing group (Cl and NO2) on frontier molecular orbital compositions, energies and optical properties of the complexes.
In recent years, with the development of density functional theory (DFT) and especially the improvement of time-dependent DFT (TDDFT),27 properties of both ground- and excited-states for medium-sized metal complexes can be calculated at the first-principle level with good accuracy.28,29 To get better insight into the geometry, electronic structure of these systems the geometry optimizations of both the singlet ground (S0) and lowest lying triplet excited state (T1) for all the complexes were carried out by means of DFT calculations. TDDFT calculations of 40 singlet states and 20 triplet states have been performed for better understanding of the electronic origin of the absorption and emission spectra. We also calculate and analyze the singlet and triplet excited state natural transition orbitals (NTOs) derived from TDDFT results and these NTOs analyses at S0 and T1 states are helpful to understand the nature of absorption and emission, respectively. The nature of the transitions was further supported by spin density difference map. The computational modeling of the NMR parameter is also of abiding interest, and such calculations at DFT has emerged as a promising approach for the prediction of nuclear shielding and coupling constants of NMR active nuclei.30,31 Thus, we have computed the proton and carbon NMR chemical shifts using the gauge-independent atomic orbital (GIAO)-DFT method, which is aimed at providing the definitive characterization of the complexes. Frequencies were also calculated by DFT method.
Results and discussion
Synthesis
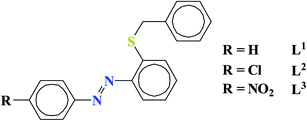
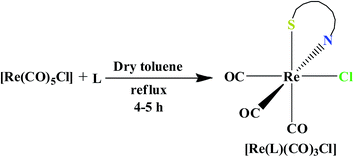
Three N, S coordinating azo ligands 2-(arylazo)phenyl benzyl thioethers [ArNNC6H4SCH2Ph: Ar = Ph, 4-chlorophenyl, 4-nitrophenyl] (L1–L3) (general abbreviation, L) has been used in the present work (Chart 1). The ligands are 2-(phenylazo)phenyl benzyl thioether (L1), 2-(4-chlorophenylazo)phenyl benzyl thioether (L2) and 2-(4-nitrophenylazo)phenyl benzyl thioether (L3). The ligands were prepared according to the literature procedure.32,33The stoichiometric reaction of the commercially available precursor [Re(CO)5Cl] with the ligand (L) in dry toluene under refluxing condition afforded the Re(I) complexes of general formula fac-[Re(L)(CO)3Cl] in excellent yields (Scheme 1) which is further confirmed by elemental analysis and positive ion mass spectroscopic measurements (see Experimental section). The positive-ion MS spectra of the compounds showed peaks at m/z corresponding to the [M − Cl]+ adducts with the correct isotope distribution pattern. The IR and NMR spectral properties were given in the ESI.
Crystal structure
The molecular structures of fac-[Re(L1)(CO)3Cl], 1 and fac-[Re(L2)(CO)3Cl], 2 were determined by single-crystal X-ray diffractometry. Both the complexes crystallize in P21/n space group. The selected bond distances and angles for 1 and 2 are listed in Table 1, and the molecular structures are shown in Fig. 1.| Bond lengths (Å) | |||||
|---|---|---|---|---|---|
| 1 | 2 | 1 | 2 | ||
| Re1–C1 | 1.936(6) | 1.935(3) | Re1–S1 | 2.4577(14) | 2.4511(7) |
| Re1–C2 | 1.913(6) | 1.903(3) | C4–N1 | 1.466(6) | 1.461(3) |
| Re1–C3 | 1.904(7) | 1.912(3) | C17–N2 | 1.425(7) | 1.428(3) |
| Re1–N1 | 2.227(4) | 2.226(2) | N1–N2 | 1.250(6) | 1.258(3) |
| Re1–Cl1 | 2.4836(14) | 2.4838(7) | |||
| Bond angles (°) | |||||
|---|---|---|---|---|---|
| 1 | 2 | 1 | 2 | ||
| C1–Re1–C2 | 89.5(2) | 89.83(12) | C2–Re1–S1 | 95.96(16) | 95.50(9) |
| C1–Re1–C3 | 87.0(2) | 87.83(12) | C3–Re1–N1 | 172.1(2) | 171.29(10) |
| C1–Re1–N1 | 99.5(2) | 100.20(10) | C3–Re1–Cl1 | 94.23(18) | 95.55(8) |
| C1–Re1–Cl1 | 91.74(17) | 90.79(8) | C3–Re1–S1 | 93.20(18) | 91.87(9) |
| C1–Re1–S1 | 174.56(17) | 174.64(8) | N1–Re1–Cl1 | 81.21(11) | 81.07(6) |
| C2–Re1–C3 | 88.6(3) | 87.54(12) | N1–Re1–S1 | 79.91(12) | 79.82(6) |
| C2–Re1–N1 | 95.9(2) | 95.80(10) | S1–Re1–Cl1 | 82.83(5) | 83.91(2) |
| C2–Re1–Cl1 | 177.02(18) | 176.87(9) | |||
| Torsional angle (°) | ||
|---|---|---|
| 1 | 2 | |
| C4–N1–N2–C17 | 174.47 | 177.48 |
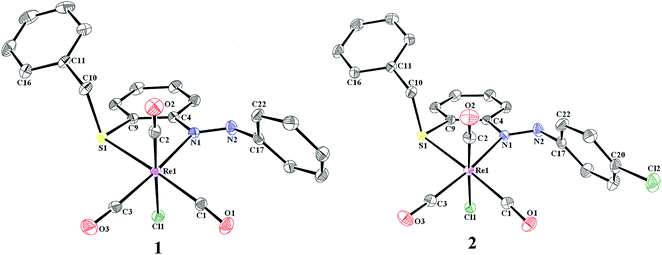 | ||
| Fig. 1 ORTEP plot (30% probability ellipsoid) and atom labeling scheme of 1 and 2. Hydrogen atoms are omitted for clarity. | ||
In both complexes, the rhenium ion attains distorted octahedral coordination geometry and the ligand binds as N, S coordinating neutral bidentate ligand. The carbonyl ligands are arranged in a facial fashion. The remaining equatorial sites are occupied by azo nitrogen and sulfur atom of the ligand and the remaining axial site is occupied by chlorine atom. The Re–C bond distances span in the ranges 1.90–1.93 Å. Moreover, these Re–carbonyl bonds are nearly perpendicular to each other with OC–Re–CO angles in the range 87.0(2)–89.5(2)° or 87.83(12)–89.83(12)° for 1 and 2, respectively. The trans bond angles fall in the range of 171.29(10)–177.02(18)°, showing only moderate deviations from an idealized octahedral geometry. The most significant angular distortion is associated with the N1–Re1–S1 bite angle of 79.91(12)° for 1 and 79.82(6)° for 2. This value reflects the formation of a strained five-membered chelate ring. The Re–C bond distance trans to sulfur atom is slightly longer than Re–C bond distance trans to chloro group and this can be attributed to the better π accepting capability of chlorine atom than sulfur atom. In the complexes 1 and 2 the azoaryl group remains trans and the torsional angle < C4–N1–N2–C17 span in the range 174.47–177.48°. In the ligand frame the dihedral angle made by the phenyl ring (C4, C5, C6, C7, C8 and C9) and the aryl moiety (C17, C18, C19, C20, C21 and C22) occurs at 64.70 and 62.51° for 1 and 2, respectively.
Geometry optimization and electronic structure
Molecular structure of the complexes 1–3 was optimized at their electronic ground state (S0) by means of DFT at B3LYP/[(6-31G) + (6-31+G) + {6-31+G(d,p)} + LANL2DZ] level. The main computed geometrical parameters for 1–3 are listed in Table 2 and the optimized structures are given in Fig. 2.| [Re(L1)(CO)3Cl], 1 | [Re(L2)(CO)3Cl], 2 | [Re(L3)(CO)3Cl], 3 | ||||
|---|---|---|---|---|---|---|
| S0 | T1 | S0 | T1 | S0 | T1 | |
| Bond lengths (Å) | ||||||
| Re1–C1 | 1.927 | 1.923 | 1.926 | 1.923 | 1.925 | 1.925 |
| Re1–C2 | 1.904 | 1.909 | 1.905 | 1.909 | 1.907 | 1.911 |
| Re1–C3 | 1.919 | 1.932 | 1.921 | 1.933 | 1.925 | 1.934 |
| Re1–N1 | 2.265 | 2.174 | 2.263 | 2.174 | 2.245 | 2.173 |
| Re1–Cl1 | 2.548 | 2.540 | 2.547 | 2.539 | 2.543 | 2.534 |
| Re1–S1 | 2.508 | 2.534 | 2.510 | 2.534 | 2.513 | 2.538 |
| C4–N1 | 1.459 | 1.397 | 1.458 | 1.396 | 1.456 | 1.394 |
| C17–N2 | 1.410 | 1.372 | 1.409 | 1.369 | 1.411 | 1.369 |
| N1–N2 | 1.278 | 1.365 | 1.278 | 1.366 | 1.274 | 1.365 |
| Bond angles (°) | ||||||
| C1–Re1–S1 | 172.852 | 171.399 | 173.032 | 171.386 | 173.209 | 171.663 |
| C2–Re1–Cl1 | 178.639 | 178.149 | 178.499 | 178.260 | 178.347 | 178.367 |
| C3–Re1–N1 | 169.241 | 171.418 | 169.240 | 171.352 | 170.002 | 170.676 |
| Torsional angle (°) | ||||||
| C4–N1–N2–C17 | 172.770 | 99.145 | 173.029 | 99.361 | 176.346 | 101.125 |
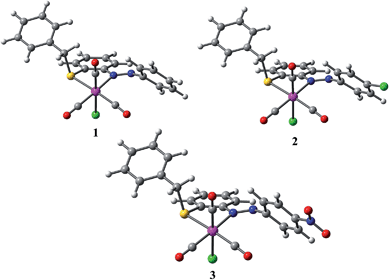 | ||
| Fig. 2 Optimized molecular structure of 1, 2 and 3 at ground singlet state (S0). (Re: pink, Cl: green, N: blue, O: red, S: yellow, C: grey, H: white.) | ||
The modeled geometries possess a distorted octahedral arrangement around the Re(I) center. The fac-[Re(CO)3]+ unit in all complexes is nearly trigonal pyramid with ∼90° angles between the CO ligands. Calculated structures are in excellent agreement with experimental data for the complexes 1 and 2, for which X-ray data are available. As shown in Table 2, the B3LYP method in combination with the LANL2DZ basis gives a very good estimation of the Re–C (with deviations ranging from −0.009 to +0.015 Å for 1 and −0.009 to +0.009 Å for 2) and Re–N bond lengths (with deviations of 0.038 and 0.037 Å for 1 and 2, respectively). In all complexes the calculated Re–S bond distances occur near 2.51 Å. All these values are within the range of allowed errors considering the environmental factors such as crystal packing and the impact of the medium. The Re–Cl bond lengths of 1 and 2 are overestimated by 0.064 and 0.063 Å, respectively. Such significant Re–Cl elongation is consistent with the research of Turki et al. The authors addressed that the drawback of DFT arises from the dynamical correlation effects, which become very important in complexes with a polar M–Cl bond.34 The good agreement between calculated and experimental data highlights the importance of relativistic effects for a proper description of the geometrical structure of the present Re(I) complexes.
The partial frontier molecular orbital compositions and energy levels of 1 in singlet ground state (S0) are listed in Table 3 while that for other complexes 2 and 3 were given in ESI (Tables S1 and S2†). The partial molecular orbital diagram with some isodensity frontier molecular orbital which are mainly involved in the electronic transitions for complexes 1, 2 and 3 were shown in Fig. 3.
| Orbital | Energy (eV) | Contribution (%) | Main bond type | |||
|---|---|---|---|---|---|---|
| Re | CO | L1 | Cl | |||
| LUMO + 5 | −0.894 | 0.3 | 72.7 | 26.8 | 0.2 | π*(CO) + π*(L1) |
| LUMO + 4 | −0.916 | 6.6 | 10.1 | 82.8 | 0.5 | π*(CO) + π*(L1) |
| LUMO + 3 | −1.464 | 9.5 | 30.5 | 59.4 | 0.5 | π*(CO) + π*(L1) |
| LUMO + 2 | −1.627 | 24.4 | 58.2 | 17.3 | 0.1 | p(Re) + π*(CO) + π*(L1) |
| LUMO + 1 | −1.753 | 22.0 | 35.2 | 40.4 | 2.4 | p(Re) + π*(CO) + π*(L1) |
| LUMO | −3.516 | 1.4 | 2.9 | 95.0 | 0.7 | π*(L1) |
| HOMO | −6.637 | 34.8 | 16.6 | 27.9 | 20.7 | d(Re) + π(CO) + π(L1) + p(Cl) |
| HOMO − 1 | −6.749 | 42.8 | 19.6 | 11.4 | 26.1 | d(Re) + π(CO) + π(L1) + p(Cl) |
| HOMO − 2 | −7.088 | 26.4 | 12.2 | 53.1 | 8.3 | d(Re) + π(CO) + π(L1) |
| HOMO − 3 | −7.185 | 6.2 | 0.7 | 83.4 | 7.7 | π(L1) |
| HOMO − 4 | −7.196 | 42.6 | 17.9 | 37.2 | 2.3 | d(Re) + π(CO) + π(L1) |
| HOMO − 5 | −7.311 | 0.4 | 0.1 | 99.3 | 0.2 | π(L1) |
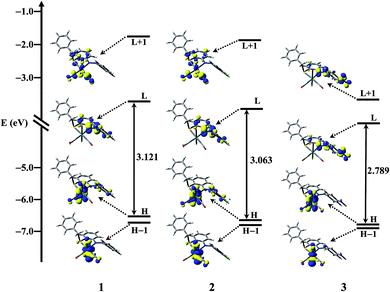 | ||
| Fig. 3 Partial molecular orbital diagram with some isodensity frontier molecular orbital mainly involved in the electronic transitions for complexes 1, 2 and 3. | ||
Significant variations on the frontier molecular orbital energies and compositions were observed with regard to the nature of the 4-substituted aromatic moiety attached through N![[double bond, length as m-dash]](https://www.rsc.org/images/entities/char_e001.gif) N bond. In the ground state (S0), the HOMO and HOMO – 1 are lying within 0.11 eV for complexes 1 and 2 while the energy difference between HOMO and HOMO – 1 for complex 3 is 0.059 eV. The HOMO and HOMO – 1 of all the complexes contained nearly 44% rhenium d orbital contribution, 27% or more chlorine and 19% or more CO contribution. In complexes 1 and 2 the HOMO – 2 is lying 0.44 eV below the HOMO having 20% or more metal d orbital contribution, nearly 53% or more ligand π orbital contribution, while in complex 3 the HOMO – 2 orbital is mainly composed of ligand π orbital. The HOMO – 3 and HOMO – 4 are almost degenerate (energy difference 0.011 eV in 1, 0.041 eV in 2 and 0.052 eV in 3). In all the complexes the HOMO – 5 orbital is mainly composed of ligand π orbital. The LUMO for all the complexes was found to 94% or more ligand contribution, while in LUMO + 1 orbital for 1 and 2 predominant contribution arises from π*(CO) and metal p orbital but in 3 the LUMO + 1 orbital have 96% contribution form ligand π* orbital. In all cases the contribution to LUMO + 2 orbital arises from metal p orbital, π* orbital of carbonyls and ligand. Strong electron withdrawing effect of NO2 group stabilizes both HOMO and LUMO most strongly and consequently the HOMO–LUMO energy gap decreases in the order 1 > 2 > 3. These compositions of frontier molecular orbitals in the singlet ground state are useful in understanding the nature of transitions as well as the absorption spectra of the complexes (vide infra).
N bond. In the ground state (S0), the HOMO and HOMO – 1 are lying within 0.11 eV for complexes 1 and 2 while the energy difference between HOMO and HOMO – 1 for complex 3 is 0.059 eV. The HOMO and HOMO – 1 of all the complexes contained nearly 44% rhenium d orbital contribution, 27% or more chlorine and 19% or more CO contribution. In complexes 1 and 2 the HOMO – 2 is lying 0.44 eV below the HOMO having 20% or more metal d orbital contribution, nearly 53% or more ligand π orbital contribution, while in complex 3 the HOMO – 2 orbital is mainly composed of ligand π orbital. The HOMO – 3 and HOMO – 4 are almost degenerate (energy difference 0.011 eV in 1, 0.041 eV in 2 and 0.052 eV in 3). In all the complexes the HOMO – 5 orbital is mainly composed of ligand π orbital. The LUMO for all the complexes was found to 94% or more ligand contribution, while in LUMO + 1 orbital for 1 and 2 predominant contribution arises from π*(CO) and metal p orbital but in 3 the LUMO + 1 orbital have 96% contribution form ligand π* orbital. In all cases the contribution to LUMO + 2 orbital arises from metal p orbital, π* orbital of carbonyls and ligand. Strong electron withdrawing effect of NO2 group stabilizes both HOMO and LUMO most strongly and consequently the HOMO–LUMO energy gap decreases in the order 1 > 2 > 3. These compositions of frontier molecular orbitals in the singlet ground state are useful in understanding the nature of transitions as well as the absorption spectra of the complexes (vide infra).
In dichloromethane solution the calculated energy of all the complexes 1–3 are lowered by a value 0.674 eV than the corresponding gas phase energy but the composition of the frontier orbitals remains same in both gas and solution phase.
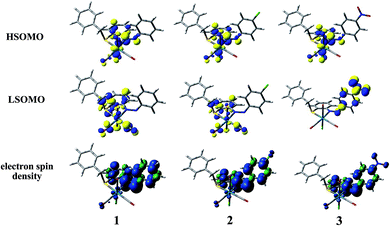
To investigate the geometrical rearrangement as well as to shed light onto the electronic nature of the emitting excited state, geometrical optimization of the lowest-lying triplet excited state (T1) in dichloromethane solution was performed by means of DFT using the unrestricted Kohn–Sham approach (UKS) at UB3LYP level. The most meaningful geometrical parameters in the T1 state for complexes 1, 2 and 3 are listed in Table 2 and isodensity surfaces of the Highest and Lowest Singly Occupied Molecular Orbitals, namely HSOMO and LSOMO for 1, 2 and 3, at the relaxed T1 geometry are showed in Fig. 4. Also, the corresponding electrons spin density, which is defined as the difference between α and β spin contributions to the total electron density, are depicted in Fig. 4. At their T1 optimized geometry, all the complexes show a negligible difference in all Re–C bond distances, being the displacement in a range of (0.004–0.028) Å. On the other hand, it is worth noting that a sizable shortening of the Re–N bond distance near 0.05 Å and also lengthening of Re–Cl and Re–S bond distances near 0.055 and 0.077 Å, respectively. The lack of the distortion around the rhenium atom indicates that the population of the T1 state yields only minor changes in the geometrical arrangement of the molecules. This will relate to the moderate emission quantum yields observed in the present case.
The optimized geometries of all the complexes in both S0 and T1 states do not show significant differences in the coordination sphere around the metal center revealing that the ligands bind in a similar fashion in the complexes. For all complexes in the ground S0 state two phenyl groups which are attached through N![[double bond, length as m-dash]](https://www.rsc.org/images/entities/char_e001.gif) N bond remains trans to each other and this is characterized by the torsional angle < C4–N1–N2–C17 ≈ 173° (for 1 and 2) and 176° (for 3). The calculated N
N bond remains trans to each other and this is characterized by the torsional angle < C4–N1–N2–C17 ≈ 173° (for 1 and 2) and 176° (for 3). The calculated N![[double bond, length as m-dash]](https://www.rsc.org/images/entities/char_e001.gif) N bond distance at S0 ground state for all complexes occurs near 1.28 Å which is in very good agreement with the experimental results. The dihedral angle made by the phenyl ring (C4, C5, C6, C7, C8 and C9) and the aryl moiety (C17, C18, C19, C20, C21 and C22) occurs at 46.87, 46.02 and 52.64° for 1, 2 and 3, respectively. In the triplet excited state (T1), the geometry around N
N bond distance at S0 ground state for all complexes occurs near 1.28 Å which is in very good agreement with the experimental results. The dihedral angle made by the phenyl ring (C4, C5, C6, C7, C8 and C9) and the aryl moiety (C17, C18, C19, C20, C21 and C22) occurs at 46.87, 46.02 and 52.64° for 1, 2 and 3, respectively. In the triplet excited state (T1), the geometry around N![[double bond, length as m-dash]](https://www.rsc.org/images/entities/char_e001.gif) N bond is completely different from the geometry observed in the S0 state. The optimized geometry at T1 state for all the complexes are given in ESI (Fig. S2†). In T1 state those two phenyl groups which are attached through N
N bond is completely different from the geometry observed in the S0 state. The optimized geometry at T1 state for all the complexes are given in ESI (Fig. S2†). In T1 state those two phenyl groups which are attached through N![[double bond, length as m-dash]](https://www.rsc.org/images/entities/char_e001.gif) N bond become cis and this is also characterized by the torsional angle <C4–N1–N2–C17 ≈ 99° (for 1 and 2) and 101° (for 3) respectively. The dihedral angle made by the phenyl ring (C4, C5, C6, C7, C8 and C9) and the aryl moiety (C17, C18, C19, C20, C21 and C22) were observed at 85.24, 84.89 and 84.08° for 1, 2 and 3, respectively. The calculated N
N bond become cis and this is also characterized by the torsional angle <C4–N1–N2–C17 ≈ 99° (for 1 and 2) and 101° (for 3) respectively. The dihedral angle made by the phenyl ring (C4, C5, C6, C7, C8 and C9) and the aryl moiety (C17, C18, C19, C20, C21 and C22) were observed at 85.24, 84.89 and 84.08° for 1, 2 and 3, respectively. The calculated N![[double bond, length as m-dash]](https://www.rsc.org/images/entities/char_e001.gif) N bond distance for all complexes at T1 state occurs near 1.36 Å.
N bond distance for all complexes at T1 state occurs near 1.36 Å.
The analysis of the singly occupied molecular orbitals at the T1 geometry showed that in all the complexes the electron density at HSOMO is mainly located on the metal center, chlorine atom and N![[double bond, length as m-dash]](https://www.rsc.org/images/entities/char_e001.gif) N bond. The LSOMO for complex 1 and 2 originates from the contribution of π* orbital of carbonyl moiety, ligand moiety and chlorine atom along with the considerable contribution from metal center whereas the NO2 group and the π* orbital of the phenyl ring containing NO2 group contributes primarily towards the LSOMO of 3. The electron spin density plot at T1 state for all the complexes illustrates that the spin is mainly localized on the rhenium atom and two phenyl groups which are attached together through N
N bond. The LSOMO for complex 1 and 2 originates from the contribution of π* orbital of carbonyl moiety, ligand moiety and chlorine atom along with the considerable contribution from metal center whereas the NO2 group and the π* orbital of the phenyl ring containing NO2 group contributes primarily towards the LSOMO of 3. The electron spin density plot at T1 state for all the complexes illustrates that the spin is mainly localized on the rhenium atom and two phenyl groups which are attached together through N![[double bond, length as m-dash]](https://www.rsc.org/images/entities/char_e001.gif) N bond and thus the lowest-lying triplet excited state (T1) is an admixture of metal-to-ligand charge transfer (3MLCT) state and ligand centered (3IL) excited state (ligand-localized) in all complexes. Therefore the emission from such triplet excited state (T1) will also have mixed 3MLCT and 3ILCT nature (vide infra).
N bond and thus the lowest-lying triplet excited state (T1) is an admixture of metal-to-ligand charge transfer (3MLCT) state and ligand centered (3IL) excited state (ligand-localized) in all complexes. Therefore the emission from such triplet excited state (T1) will also have mixed 3MLCT and 3ILCT nature (vide infra).
Photo-physical properties and DFT studies
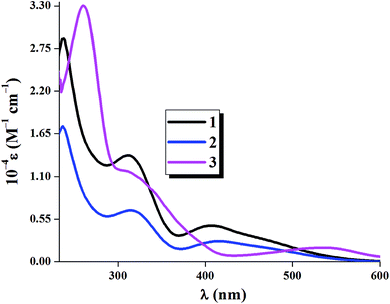
The absorption spectra of the complexes 1–3 were recorded in dichloromethane solution at room temperature. Fig. 5 shows the experimental absorption spectra for all complexes. The photo-physical parameters of the complexes 1–3 were given Table 4.| Complex | λmax, nm (ε, M−1 cm−1) | λex, nm | λemi, nm | Φ | kr, s−1 (×106) | knr, s−1 (×108) | τ1, ns | τ2, ns |
|---|---|---|---|---|---|---|---|---|
| 1 | 407 (4677), 311 (13743), 238 (28803) | 375 | 425 | 0.031 | 4.25 | 1.33 | 2.45 | 7.29 |
| 2 | 416 (2657), 314 (6635), 237 (17451) | 375 | 422 | 0.024 | 3.49 | 1.42 | 1.06 | 6.88 |
| 3 | 535 (1820), 307 (11765), 261 (33026) | 375 | 421, 500 | 0.013 | 1.97, 1.95 | 1.49, 1.48 | 0.80, 0.91 | 6.60, 6.68 |
All the complexes show three well resolved peaks. For complex 1 and 2 the bands appear near 410, 311 and 237 nm while for complex 3 absorption maxima occurs at 535, 307 and 261 nm. The bands near 410 nm for complexes 1 and 2 and the band at 535 nm for complex 3 can reasonably assigned to mainly metal-to-ligand charge-transfer (1MLCT)35–37 transition [d(Re) → π*(ligand)] while the intense absorption band at higher energy (near 311 and 237 nm for complexes 1 and 2; 307 and 261 nm for complex 3) is presumably due to spin-allowed π → π* (ligand centered, 1ILCT) transitions along with some MLCT character. These assignments were supported by theoretical calculations [from spin density plot and also from natural transition orbital (NTO) analysis at S0 state].
The calculated absorption energies associated with their oscillator strengths, the main configurations and their assignments as well as the experimental result of 1 is given in Table 5 whereas that for other complexes are given in ESI (Tables S3 and S4†). Table 5 confirms the usual assignments of all the absorption bands for complex 1.
| Electronic transitions | Composition | Excitation energy | Oscillator strength (f) | CIa | Assign | λexp (nm) |
|---|---|---|---|---|---|---|
| a Coefficient of the wave function for each excitations. The CI coefficients are in absolute values. | ||||||
| S0 → S4 | HOMO – 4 → LUMO | 2.9685 eV | 0.0629 | 0.58630 | MLCT/ILCT | 407 |
| HOMO – 3 → LUMO | (417 nm) | −0.35936 | ILCT | |||
| S0 → S10 | HOMO – 9 → LUMO | 3.7891 eV | 0.0569 | 0.62861 | MLCT/ILCT | 311 |
| HOMO – 8 → LUMO | (327 nm) | −0.27384 | ILCT | |||
| S0 → S36 | HOMO – 4 → LUMO + 3 | 5.2001 eV | 0.0620 | 0.12325 | MLCT/ILCT | 238 |
| HOMO – 3 → LUMO + 2 | (238 nm) | 0.11064 | LMCT/ILCT | |||
| HOMO – 3 → LUMO + 3 | 0.25157 | ILCT | ||||
| HOMO – 2 → LUMO + 3 | −0.21136 | MLCT/ILCT | ||||
| HOMO – 1 → LUMO + 4 | 0.30123 | MLCT/ILCT | ||||
| HOMO – 1 → LUMO + 5 | 0.12301 | MLCT/ILCT | ||||
| HOMO – 1 → LUMO + 6 | −0.13579 | MLCT/ILCT | ||||
| HOMO → LUMO + 4 | 0.13675 | MLCT/ILCT | ||||
| HOMO → LUMO + 5 | −0.18341 | MLCT/ILCT | ||||
| HOMO → LUMO + 7 | −0.17720 | MLCT/ILCT | ||||
| HOMO → LUMO + 8 | 0.23614 | MLCT/ILCT | ||||
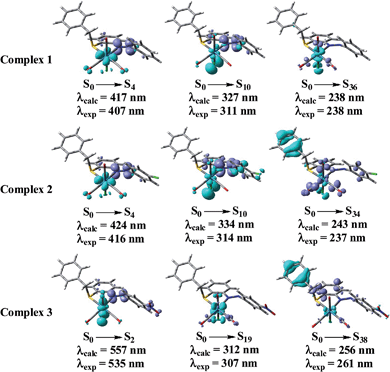
Fig. 6 shows the accompanying electron density redistributions in complex 1, 2 and 3. From spin density plot we can conclude that the absorption band at 407, 416 an 535 nm for 1, 2 and 3, respectively have primarily 1MLCT character and the higher energy intense bands in the region 237–314 nm for 1–3 have mixed 1MLCT and 1ILCT character.
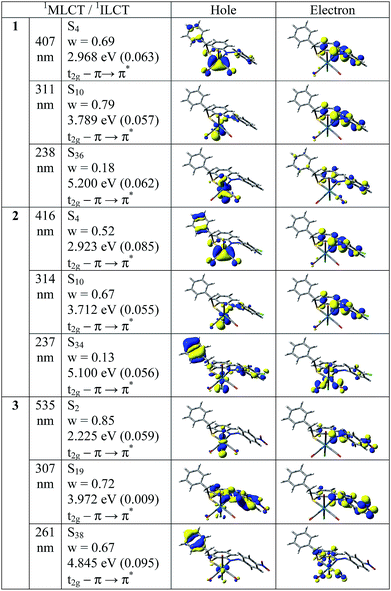
In order to analyze the nature of absorption, we performed an NTO analysis based on the calculated transition density matrices.38 Such calculations offers the most compact representation of the transition density between the ground and excited states in terms of an expansion into single-particle transitions (hole and electron states for each given excitation). Here we refer to the unoccupied and occupied NTOs as “electron” and “hole” transition orbitals, respectively. Note that NTOs are not the same as virtual and occupied MO pairs from the ground state calculations. Fig. 7 illustrates the natural transition orbitals (NTOs) for all complexes 1–3.
Based on our TDDFT NTOs analysis for all the complexes the bands in the region 407–535 nm can be characterized as primarily 1MLCT state while the absorption maxima in the region 237–314 nm can be described as an admixture of 1ILCT and 1MLCT states. As illustrated in Fig. 7, optical excitations occur from the occupied (hole) transition orbitals to the unoccupied (electron) transition orbitals. Hole NTOs contributing to the bands are localized on the rhenium center along with π orbitals of ligands (t2g–π) while the electron NTOs are mainly delocalized over the π* orbital of the ligand moiety.
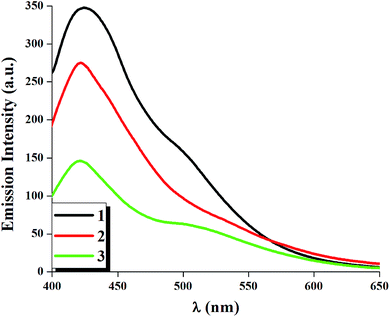
The determination of the luminescent features (λem, Φ) of each complex has been performed at room temperature in dichloromethane solution using [Ru(bipy)3]Cl2 as the reference for the determination of the quantum yield.39 After irradiation at the MLCT transition of each complex (λex = 375 nm) all complexes exhibit a sharp emission maxima near 420 nm. For complex 3 another emission band is also observed at 500 nm which is broad in nature. The room temperature quantum yields of the luminescent complexes have been calculated and the quantum yield for all complexes occurs in the range 0.013–0.031.
It is to be noted that incorporation of electron withdrawing group such as Cl (complex 2) and NO2 (complex 3) group at para position with respect to azo nitrogen atom decreases the quantum yield for 2 and 3 compared to that of 1 (Φ = 0.031) and this decrease is maximum for complex 3 (Φ = 0.013) and this is due to the presence of strong electron withdrawing NO2 group which enhances the probability of non-radiative deactivation in complex 3. The photo-physical parameters are listed in Table 4. Fig. 8 represents the emission spectra of the complexes 1–3 in dichloromethane solution at room temperature.
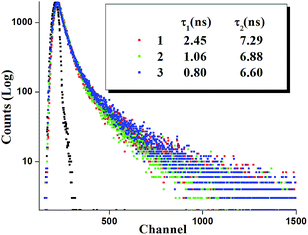
Time resolved luminescence spectra proved to be an important tool to understand the decay process and the emissive nature of the complexes. Thus time resolved luminescence spectra were recorded for all the complexes in dichloromethane solution at room temperature. All the complexes display a bi-exponential decay nature and the decay plot for the complexes 1, 2 and 3 is shown in Fig. 9. The cis orientation observed at the lowest lying triplet excited state (T1) may imply some kind of photoinduced isomerization in the ligand frame and as a result there may present more than one emitting species in the solution which leads to bi-exponential decay nature. The fluorescence life time (τ), radiative (kr) and nonradiative (knr) decay rate constant are collected in Table 4.
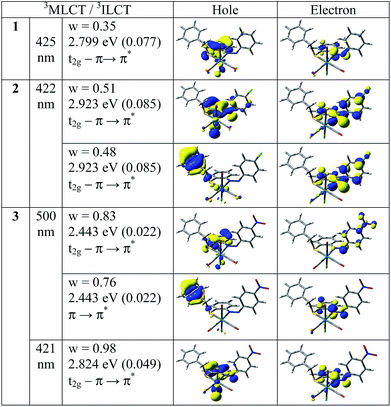
The photoluminescence property of such type of complexes mainly originates from triplet state charge transfer transitions and electron spin density at T1 state (Fig. 4) reveals that the lowest-lying triplet excited state (T1) is an admixture of metal-to-ligand charge transfer (3MLCT) state and ligand centered (3IL) excited state (ligand-localized) in all complexes. Table 6 describes the calculated emission energies associated with their oscillator strengths, the main configurations and their assignments as well as the experimental result of 1, 2 and 3. TD-DFT study at T1 state for all complexes corroborates with the mixed 3MLCT and 3ILCT nature for all the transitions.
| Complex | Excitation | Composition | Excitation energy | Oscillator strength (f) | CI | Assign | λexp (nm) |
|---|---|---|---|---|---|---|---|
| 1 | 1 | HOMO – 9 → LUMO + 1 | 2.7999 eV | 0.0767 | 0.12056 | 3MLCT/3ILCT | 425 |
| HOMO – 8 → LUMO + 1 | (443 nm) | −0.14841 | 3MLCT/3ILCT | ||||
| HOMO – 7 → LUMO | 0.36946 | 3ILCT | |||||
| HOMO – 7 → LUMO + 1 | 0.40400 | 3ILCT | |||||
| HOMO – 6 → LUMO | 0.41848 | 3MLCT/3ILCT | |||||
| HOMO – 6 → LUMO + 1 | 0.26162 | 3MLCT/3ILCT | |||||
| HOMO – 4 → LUMO | −0.30357 | 3ILCT | |||||
| HOMO – 4 → LUMO + 1 | −0.18202 | 3ILCT | |||||
| HOMO – 3 → LUMO | −0.29312 | 3ILCT | |||||
| HOMO – 3 → LUMO + 1 | 0.36576 | 3ILCT | |||||
| 2 | 1 | HOMO – 8 → LUMO | 2.8661 eV | 0.0732 | −0.13821 | 3MLCT/3ILCT | 422 |
| HOMO – 8 → LUMO + 1 | (432 nm) | 0.17843 | 3MLCT/3ILCT | ||||
| HOMO – 7 → LUMO + 1 | 0.18553 | 3ILCT | |||||
| HOMO – 6 → LUMO | 0.38801 | 3ILCT | |||||
| HOMO – 6 → LUMO + 1 | 0.50505 | 3ILCT | |||||
| HOMO – 4 → LUMO | −0.40877 | 3ILCT | |||||
| HOMO – 4 → LUMO + 1 | 0.11596 | 3ILCT | |||||
| HOMO – 3 → LUMO | 0.14502 | 3MLCT/3ILCT | |||||
| HOMO – 3 → LUMO + 1 | −0.49070 | 3MLCT/3ILCT | |||||
| HOMO – 2 → LUMO + 1 | −0.11563 | 3MLCT/3LLCT | |||||
| 3 | 1 | HOMO – 6 → LUMO | 2.4430 eV | 0.0222 | 0.64528 | 3MLCT/3ILCT | 500 |
| HOMO – 6 → LUMO + 1 | (507 nm) | −0.29303 | 3MLCT/3ILCT | ||||
| HOMO – 3 → LUMO + 1 | −0.14952 | 3MLCT/3ILCT | |||||
| HOMO – 2 → LUMO + 1 | −0.61543 | 3ILCT | |||||
| 2 | HOMO – 2 → LUMO | 2.8239 eV | 0.0494 | 0.15438 | 3MLCT/3ILCT | 424 | |
| HOMO – 14 → LUMO | (439 nm) | −0.13985 | 3ILCT | ||||
| HOMO – 9 → LUMO | 0.23895 | 3MLCT/3ILCT | |||||
| HOMO – 9 → LUMO + 1 | 0.11468 | 3MLCT/3ILCT | |||||
| HOMO – 7 → LUMO | 0.35239 | 3MLCT/3ILCT | |||||
| HOMO – 7 → LUMO + 1 | −0.14369 | 3MLCT/3ILCT | |||||
| HOMO – 6 → LUMO + 1 | 0.69998 | 3MLCT/3ILCT | |||||
| HOMO – 4 → LUMO | −0.29056 | 3ILCT |
In order to analyze the nature of emission, we performed an NTO analysis at T1 state based on the calculated transition density matrices. Fig. 10 illustrates the natural transition orbitals (NTOs) for all complexes. Based on our TDDFT NTOs analysis at T1 state all the bands for all the complexes can be characterized as an admixture of 3MLCT and 3ILCT transitions. As illustrated in Fig. 10, optical excitations occur from the occupied (hole) transition orbitals to the unoccupied (electron) transition orbitals. Hole NTOs contributing to the bands are localized over the rhenium center and π orbitals of ligands (t2g–π) while the electron NTOs are mainly delocalized over the π* orbital of the ligand moiety.
In this way the nature of transitions as well as the absorption and emission spectra of all the complexes were nicely explained with the help of electron density difference plot and TD-DFT NTOs analysis.
Electrochemical studies
In order to investigate the electrochemical behavior of the complexes cyclic voltammetry was performed for all the complexes 1–3 in dichloromethane solution at room temperature under nitrogen atmosphere with tetraethylammonium perchlorate (TEAP) as the supporting electrolyte using a Pt electrode as working electrode and the potentials were referenced to the saturated calomel electrode (SCE) without junction correction. All the three complexes exhibited a reversible single ligand centered reduction wave and an irreversible metal centered oxidation wave (ReII/ReI). The ligand reduction couple occurs in the range −0.60 to −0.75 V whereas the ReII/ReI redox couple varies from 0.78 to 0.91 V for 1–3. A representative voltammogram showing reduction upto −1.8 V for complex 1 is given in Fig. 11 and the electrochemical data for 1–3 are depicted in Experimental section.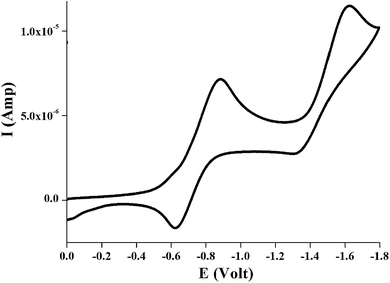 | ||
| Fig. 11 Cyclic voltammogram showing reduction upto −1.8 V of ∼10−3 M solution of [Re(L1)(CO)3Cl], 1 in dichloromethane at room temperature under N2 atmosphere. | ||
It has been reported earlier40 that the study of electrochemical behavior is an important phenomenon of the complexes where HOMO and LUMO orbitals were involved in the redox processes. In all the complexes HOMO consist of nearly 35% or more rhenium d-orbital, 21% or more chloro and 16% or more (CO)x character along with nearly 28% of ligand (complexes 1 and 2) or 7.6% of ligand (complexes 3) while the LUMO is mainly localized on ligands.
Thus the oxidation (∼0.80 V) i.e. the removal of electron from orbital containing a metal d character with a considerable contribution from Cl and carbonyl moiety is probably responsible for irreversible electrochemical behavior. On the other hand, the one electron reduction (near −0.60 V) involved addition of one electron to the π* orbital of the ligand moiety.
Conclusion
In summary, we have synthesized fac-[Re(CO)3]+complexes incorporating 2-(arylazo)phenyl benzyl thioether ligands functionalized with different electron withdrawing group (Cl and NO2) at the para position of phenyl ring attached through N![[double bond, length as m-dash]](https://www.rsc.org/images/entities/char_e001.gif) N bond to tune their optical properties. All the complexes are characterized by elemental analysis, X-ray crystallography and different spectroscopic techniques like mass, IR, NMR (1H and 13C), UV-vis and luminescence spectroscopy. Electrochemical behaviors of all the complexes were also examined. The present work investigated the ground and excited-state geometries, NMR, absorption, and luminescence properties of three Re(I) complexes by DFT and TDDFT methods. We specifically focused on the changes in frontier molecular orbital energies, compositions and optical properties of these molecules caused by introduction of the electron withdrawing group at para position of phenyl ring attached through N
N bond to tune their optical properties. All the complexes are characterized by elemental analysis, X-ray crystallography and different spectroscopic techniques like mass, IR, NMR (1H and 13C), UV-vis and luminescence spectroscopy. Electrochemical behaviors of all the complexes were also examined. The present work investigated the ground and excited-state geometries, NMR, absorption, and luminescence properties of three Re(I) complexes by DFT and TDDFT methods. We specifically focused on the changes in frontier molecular orbital energies, compositions and optical properties of these molecules caused by introduction of the electron withdrawing group at para position of phenyl ring attached through N![[double bond, length as m-dash]](https://www.rsc.org/images/entities/char_e001.gif) N bond. Experimental ground state IR and NMR data set agree with those calculated by DFT calculations. TD-DFT investigation gave insights into the optical transitions involved in the excitation process. We have characterized all of the low-lying electronic states as an admixture of MLCT and ILCT in character. The nature of the transitions was also supported by spin density difference map and natural transition orbital (NTO) analysis. The computed vertical excitation energies in solution are in good agreement with the experimental one showing that the metal-to-ligand charge transfer transitions in visible region dominate over ligand based ILCT transition. The optimization of the lowest lying triplet excited reveals that the lowest-lying triplet excited state have mixed 3MLCT and 3ILCT character where the azoaryl group adopts the cis conformation. The emission like transition is associated with strong 3MLCT and 3ILCT character as demonstrated by electron spin density and also by NTO analysis at triplet state. On moving from complex 1 to 3 the quantum yield gradually decreases and it is greatly reduced in case of 3. The presence of strong electron withdrawing NO2 group in complex 3 increases the probability of non-radiative deactivation resulting in poor luminescent nature (Φ = 0.013). The cis orientation observed at the lowest lying triplet excited state (T1) may imply some kind of photoinduced isomerization in the ligand frame and as a result there may be more than one emitting species in the solution leading to show bi-exponential decay nature for all complexes.
N bond. Experimental ground state IR and NMR data set agree with those calculated by DFT calculations. TD-DFT investigation gave insights into the optical transitions involved in the excitation process. We have characterized all of the low-lying electronic states as an admixture of MLCT and ILCT in character. The nature of the transitions was also supported by spin density difference map and natural transition orbital (NTO) analysis. The computed vertical excitation energies in solution are in good agreement with the experimental one showing that the metal-to-ligand charge transfer transitions in visible region dominate over ligand based ILCT transition. The optimization of the lowest lying triplet excited reveals that the lowest-lying triplet excited state have mixed 3MLCT and 3ILCT character where the azoaryl group adopts the cis conformation. The emission like transition is associated with strong 3MLCT and 3ILCT character as demonstrated by electron spin density and also by NTO analysis at triplet state. On moving from complex 1 to 3 the quantum yield gradually decreases and it is greatly reduced in case of 3. The presence of strong electron withdrawing NO2 group in complex 3 increases the probability of non-radiative deactivation resulting in poor luminescent nature (Φ = 0.013). The cis orientation observed at the lowest lying triplet excited state (T1) may imply some kind of photoinduced isomerization in the ligand frame and as a result there may be more than one emitting species in the solution leading to show bi-exponential decay nature for all complexes.
Experimental section
Materials
2-(Phenylazo)phenyl benzyl thioether (L1), 2-(4-chlorophenylazo)phenyl benzyl thioether (L2) and 2-(4-nitrophenylazo)phenyl benzyl thioether (L3) were synthesized by the procedure reported earlier,32,33 and the starting materials for these synthesis viz. 2-aminothiophenl, benzyl chloride, nitrosobenzene were purchased from Aldrich Chemical Co. Inc. and used as received. High purity pentacarbonylchlororhenium(I) (98%) used was also purchased from Aldrich Chemical Co. Inc. and used as received. All other chemicals including solvents were of AR grade and used as received.Physical measurements
UV-Vis spectra were recorded on a Perkin-Elmer LAMBDA 25 spectrophotometer. IR spectra were obtained with a Perkin-Elmer L-0100 spectrophotometer in the range 4000–400 cm−1. 1H and 13C NMR spectra were measured on Bruker FT 300 MHz spectrometer and Bruker FT 500 MHz spectrometer, respectively and chemical shifts are reported in parts per million relative to tetramethylsilane (TMS). Coupling constants (J) are given in Hertz (Hz) and peak multiplicity is reported as: singlet (s), doublet (d), triplet (t) and multiplet (m). The atom-numbering scheme used for 1H and 13C was same as that used in the crystallography. Electrospray ionization mass spectrometry (ESI-MS) measurements were done on a Micromass QTof YA 263 mass spectrometer. Elemental analyses (C, H, N) were performed on Perkin-Elmer 2400 series II analyzer and electrochemical measurements were recorded on a CHI 620A electrochemical analyzer under nitrogen atmosphere. Tetraethylammonium perchlorate (TEAP) was used as a supporting electrolyte and potentials were referenced to the saturated calomel electrode (SCE) without junction correction. A three-electrode system consisting of a planar Beckman model 39273 platinum inlay working electrode, platinum wire auxiliary electrode and a saturated calomel electrode (SCE) were used. The emission data were collected on a Perkin-Elmer LS 55 fluorescence spectrometer, and all samples (1.0 × 10⁻⁵ M) in dichloromethane were either degassed by three freeze–pump–thaw cycles or deaerated by purging the samples with Ar. For all luminescence measurements excitation and emission slit width of 10 nm were used. Quantum yields of the complexes were determined in freeze–pump–thaw-degassed solutions of the complexes in dichloromethane by a relative method using [Ru(bipy)3]Cl2 in the same solvent as the standard.39 The quantum yields were calculated using eqn (1),41
 | (1) |
 | (2) |
 | (3) |
Computational details
For all complexes the geometry of the singlet ground state (S0) and the lowest lying triplet excited state (T1) were optimized by the DFT42 method. Becke's three parameters hybrid exchange functional43 with the Lee–Yang–Parr (LYP) non-local correlation functional44 was used throughout the computational study. The geometry of the complexes was fully optimized in dichloromethane solution without any symmetry constraints. The nature of all the stationary points was checked by computing vibrational frequencies, and all the species were found to be true potential energy minima, as no imaginary frequency were obtained (NImag = 0). There was a good agreement between the theoretical and experimental structures. On the basis of the optimized ground and excited state geometry structures, the absorption and emission spectra properties in dichloromethane (CH2Cl2) media were calculated by time-dependent density functional theory (TDDFT)45 approach associated with the conductor-like polarizable continuum model (CPCM).46 To simulate the absorption spectra the lowest 40 singlet–singlet (S0 → Sn) transitions were computed and results of the TD calculations were qualitatively very similar. The TDDFT approach had been demonstrated to be reliable for calculating spectra properties of many transition metal complexes.47 Due to the presence of electronic correlation in the TDDFT (B3LYP) method it can yield more accurate electronic excitation energies. Hence TDDFT had been shown to provide a reasonable spectral feature for our complexes of investigation.In the calculation, the quasirelativistic pseudopotentials of Re atoms proposed by Hay and Wadt48 with 14 valence electrons (outer-core [(5s25p6)] electrons and the (5d6) valence electrons) were employed, and a “double-ξ” quality basis set LANL2DZ49 was adopted as the basis set for Re atoms. For H atoms we used 6-31(g); for C, N and O atoms 6-31+g and for Cl, S atoms 6-31+g(d,p)50 basis set were employed for the optimization of both the ground state and the lowest lying triplet excited state geometries. For C, N, O, Cl and S atoms we have introduced a diffuse function (+) since such diffuse function improve the predicted properties of species with extended electronic densities. For Cl and S atoms we have used polarization functions (d,p) along with the diffuse function and these type of basis set is considered “balanced.” Use of such balanced basis set for S and Cl atoms helps in convergence. LANL2DZ is used for rhenium atom as introduction of LANL2DZ basis set for transition metal atoms helps to achieve the proper results more easily.51
In addition, the 1H and 13C NMR spectral properties of the complexes were calculated with the magnetic field perturbation method with GIAO algorithm52 with NMR = spin–spin keyword incorporated in the Gaussian 09W program. In calculation, the 6-311+G(2d,p) basis set was employed for all atoms other than rhenium. The relative chemical shift of a given nucleus X in the molecule was defined as δcalcX [ppm] = σrefX − σcalcX where TMS was used as a reference molecule optimized at the same level of theory.52b,53a In order to account for the solvent effect, we used the integral equation-formalism polarizable continuum model (IEFPCM) method.53b,c
Finally to understand the nature of excited states involved in absorption and emission processes natural transition orbital (NTO) analysis had been performed for all complexes. This approach provides the most compact representation of the electronic transitions in terms of an expansion into single particle orbitals by diagonalizing the transition density matrix associated with each excitation.38 The spin density difference map calculations were also performed to explain their optical properties. Figures showing MOs, NTOs and the electron spin density difference plots were prepared by using the GaussView 5.1 software. All the calculations were performed with the Gaussian 09W software package.54 GaussSum 2.1 program55 was used to calculate the molecular orbital contributions from groups or atoms.
Crystallographic studies
The single crystal suitable for X-ray crystallographic analysis of complex [Re(L1)(CO)3Cl], 1 and [Re(L2)(CO)3Cl], 2 were obtained by diffusing CH2Cl2 solution into hexane. The single crystals of complexes 1 and 2 were mounted on a thin glass fiber. X-ray single crystal data collection of two crystals were made at room temperature using a Bruker APEX II diffractometer, equipped with a normal focus, 2.4 kW sealed tube X-ray source with graphite monochromated Mo-Kα radiation (λ = 0.71073 Å), operating at 50 kV and 30 mA. The diffraction profiles were integrated using the SAINT56 program, and the absorption corrections were made with SADABS.57 All the structures were solved by SHELXS 97![[thin space (1/6-em)]](https://www.rsc.org/images/entities/char_2009.gif) 58 using the Patterson method and followed by successive Fourier and difference Fourier synthesis. Full matrix least-squares refinements were performed on F2 using SHELXL 97
58 using the Patterson method and followed by successive Fourier and difference Fourier synthesis. Full matrix least-squares refinements were performed on F2 using SHELXL 97![[thin space (1/6-em)]](https://www.rsc.org/images/entities/char_2009.gif) 58 with anisotropic displacement parameters for all non-hydrogen atoms. All calculations were carried out using SHELXL 97, SHELXS 97, ORTEP-3v2,59 and WinGX system Ver-1.80.60 Data collection and structure refinement parameters along with crystallographic data for the complexes 1 and 2 were given in Table 7.
58 with anisotropic displacement parameters for all non-hydrogen atoms. All calculations were carried out using SHELXL 97, SHELXS 97, ORTEP-3v2,59 and WinGX system Ver-1.80.60 Data collection and structure refinement parameters along with crystallographic data for the complexes 1 and 2 were given in Table 7.
| [Re(L1)(CO)3Cl], 1 | [Re(L2)(CO)3Cl], 2 | |
|---|---|---|
| a R1 = Σ∣∣Fo∣ − ∣Fc∣∣/Σ∣Fo∣.b wR2 = [Σ[w(Fo2 − Fc2)2]/Σ[w(Fo2)2]]1/2. | ||
| Formula | C22H16ClN2O3SRe | C22H15Cl2N2O3SRe |
| Formula weight | 610.08 | 644.52 |
| Crystal system | Monoclinic | Monoclinic |
| Space group | P21/n | P21/n |
| a/Å | 11.213(2) | 11.3004(14) |
| b/Å | 12.434(3) | 12.5107(15) |
| c/Å | 16.010(3) | 16.729(2) |
| α/° | 90.00 | 90.00 |
| β/° | 104.25(3) | 108.932(2) |
| γ/° | 90.00 | 90.00 |
| V/Å3 | 2163.4(7) | 2237.1(5) |
| Z | 4 | 4 |
| Dc/mg m−3 | 1.873 | 1.914 |
| μ/mm−1 | 5.863 | 5.791 |
| θ range/° | 2.01–26.37 | 1.92–27.99 |
| T/K | 293(2) | 293(2) |
| F(000) | 1176 | 1240 |
| Reflections collected | 16725 | 25573 |
| Unique reflections | 4410 | 5336 |
| Reflections [I > 2σ(I)] | 3603 | 4658 |
| Rint | 0.0515 | 0.0309 |
| R1,a wR2b [I > 2σ(I)] | 0.0338, 0.0703 | 0.0203, 0.0426 |
| Goodness-of-fit (F2) | 1.040 | 1.047 |
| Δρmax/min/e Å3 | −1.388, 1.658 | −0.466, 0.447 |
Synthesis of complexes
The complexes were prepared by the same general methods. Details are given here for a representative case.![[double bond, length as m-dash]](https://www.rsc.org/images/entities/char_e001.gif) N) 1458; ν(Re–Cl) 305. IRtheor (cm−1): ν(Facial 3CO) 2031, 1953, 1896; ν(N
N) 1458; ν(Re–Cl) 305. IRtheor (cm−1): ν(Facial 3CO) 2031, 1953, 1896; ν(N![[double bond, length as m-dash]](https://www.rsc.org/images/entities/char_e001.gif) N) 1457; ν(Re–Cl) 284. 1H NMRexptl {300 MHz, CDCl3, δ (ppm), J (Hz)}: 7.94 (H18, d, J = 6.6), 7.69 (H5, d, J = 6.5), 7.47 (H22, d, J = 6.8), 7.32 (H7, H19, t, J = 7.1), 7.27 (H8, H20 t, J = 6.9), 7.20 (H6, H21, m), 7.20–7.94 (14H, Ar-H), 4.24 (H10, s). 1H NMRtheor {δ (ppm)}: 7.53 (H18), 8.00 (H5), 7.23 (H22), 6.45 (H8), 8.18 (H20), 6.43–8.00 (14H, Ar-H), 3.95 (H10, s). 13C NMRexptl {500 MHz, CDCl3, δ (ppm)}: 198.6, 197.3, 189.5 (3 CO's), 40.1 (–CH2). 13C NMRtheor {δ (ppm)}: 231.2, 224.6, 224.5 (3 CO's), 61.4 (–CH2). Epa (ReII/ReI couple): 0.78 V (irr), E1/2 (red): −0.75 V.
N) 1457; ν(Re–Cl) 284. 1H NMRexptl {300 MHz, CDCl3, δ (ppm), J (Hz)}: 7.94 (H18, d, J = 6.6), 7.69 (H5, d, J = 6.5), 7.47 (H22, d, J = 6.8), 7.32 (H7, H19, t, J = 7.1), 7.27 (H8, H20 t, J = 6.9), 7.20 (H6, H21, m), 7.20–7.94 (14H, Ar-H), 4.24 (H10, s). 1H NMRtheor {δ (ppm)}: 7.53 (H18), 8.00 (H5), 7.23 (H22), 6.45 (H8), 8.18 (H20), 6.43–8.00 (14H, Ar-H), 3.95 (H10, s). 13C NMRexptl {500 MHz, CDCl3, δ (ppm)}: 198.6, 197.3, 189.5 (3 CO's), 40.1 (–CH2). 13C NMRtheor {δ (ppm)}: 231.2, 224.6, 224.5 (3 CO's), 61.4 (–CH2). Epa (ReII/ReI couple): 0.78 V (irr), E1/2 (red): −0.75 V.![[double bond, length as m-dash]](https://www.rsc.org/images/entities/char_e001.gif) N) 1455; ν(Re–Cl) 307. IRtheor (cm−1): ν(Facial 3CO) 2022, 1914, 1903; ν(N
N) 1455; ν(Re–Cl) 307. IRtheor (cm−1): ν(Facial 3CO) 2022, 1914, 1903; ν(N![[double bond, length as m-dash]](https://www.rsc.org/images/entities/char_e001.gif) N) 1454; ν(Re–Cl) 284. 1H NMRexptl {300 MHz, CDCl3, δ (ppm), J (Hz)}: 7.85 (H18, d, J = 6.6), 7.53 (H5, d, J = 6.5), 7.45 (H22, d, J = 6.9), 7.38 (H7, H19, t, J = 6.8), 7.22 (H8, t, J = 6.9), 7.10 (H6, H21, m), 7.10–7.85 (13H, Ar-H), 4.22 (H10, s). 1H NMRtheor {δ (ppm)}: 7.23 (H18), 7.98 (H5), 7.16 (H22), 6.45 (H8), 6.32–8.43 (13H, Ar-H), 3.95 (H10, s). 13C NMRexptl {500 MHz, CDCl3, δ (ppm)}: 198.9, 197.7, 190.6 (3 CO's), 39.8 (–CH2). 13C NMRtheor {δ (ppm)}: 231.9, 225.3, 224.2 (3 CO's), 61.8 (–CH2). Epa (ReII/ReI couple): 0.91 V (irr), E1/2 (red): −0.61 V.
N) 1454; ν(Re–Cl) 284. 1H NMRexptl {300 MHz, CDCl3, δ (ppm), J (Hz)}: 7.85 (H18, d, J = 6.6), 7.53 (H5, d, J = 6.5), 7.45 (H22, d, J = 6.9), 7.38 (H7, H19, t, J = 6.8), 7.22 (H8, t, J = 6.9), 7.10 (H6, H21, m), 7.10–7.85 (13H, Ar-H), 4.22 (H10, s). 1H NMRtheor {δ (ppm)}: 7.23 (H18), 7.98 (H5), 7.16 (H22), 6.45 (H8), 6.32–8.43 (13H, Ar-H), 3.95 (H10, s). 13C NMRexptl {500 MHz, CDCl3, δ (ppm)}: 198.9, 197.7, 190.6 (3 CO's), 39.8 (–CH2). 13C NMRtheor {δ (ppm)}: 231.9, 225.3, 224.2 (3 CO's), 61.8 (–CH2). Epa (ReII/ReI couple): 0.91 V (irr), E1/2 (red): −0.61 V.![[double bond, length as m-dash]](https://www.rsc.org/images/entities/char_e001.gif) N) 1456; ν(Re–Cl) 305. IRtheor (cm−1): ν(Facial 3CO) 2003, 1914, 1885; ν(N
N) 1456; ν(Re–Cl) 305. IRtheor (cm−1): ν(Facial 3CO) 2003, 1914, 1885; ν(N![[double bond, length as m-dash]](https://www.rsc.org/images/entities/char_e001.gif) N) 1460; ν(Re–Cl) 286. 1H NMRexptl {300 MHz, CDCl3, δ (ppm), J (Hz)}: 7.68 (H18, d, J = 6.8), 7.48 (H5, d, J = 6.6), 7.33 (H22, d, J = 6.9), 7.46 (H7, H19, t, J = 6.8), 7.18 (H8, t, J = 6.9), 6.95 (H6, H21, m), 6.95–7.68 (13H, Ar-H), 4.30 (H10, s). 1H NMRtheor {δ (ppm)}: 7.09 (H18), 7.95 (H5), 7.09 (H22), 6.47 (H8), 6.30–8.66 (13H, Ar-H), 4.00 (H10, s). 13C NMRexptl {500 MHz, CDCl3, δ (ppm)}: 199.1, 197.5, 190.2 (3 CO's), 39.7 (–CH2). 13C NMRtheor {δ (ppm)}: 232.6, 225.7, 223.7 (3 CO's), 62.2 (–CH2). Epa (ReII/ReI couple): 0.78 V (irr), E1/2 (red): −0.60 V.
N) 1460; ν(Re–Cl) 286. 1H NMRexptl {300 MHz, CDCl3, δ (ppm), J (Hz)}: 7.68 (H18, d, J = 6.8), 7.48 (H5, d, J = 6.6), 7.33 (H22, d, J = 6.9), 7.46 (H7, H19, t, J = 6.8), 7.18 (H8, t, J = 6.9), 6.95 (H6, H21, m), 6.95–7.68 (13H, Ar-H), 4.30 (H10, s). 1H NMRtheor {δ (ppm)}: 7.09 (H18), 7.95 (H5), 7.09 (H22), 6.47 (H8), 6.30–8.66 (13H, Ar-H), 4.00 (H10, s). 13C NMRexptl {500 MHz, CDCl3, δ (ppm)}: 199.1, 197.5, 190.2 (3 CO's), 39.7 (–CH2). 13C NMRtheor {δ (ppm)}: 232.6, 225.7, 223.7 (3 CO's), 62.2 (–CH2). Epa (ReII/ReI couple): 0.78 V (irr), E1/2 (red): −0.60 V.Acknowledgements
Financial assistance received from the Council of Scientific and Industrial Research, New Delhi, India, Science & Engineering Research Board, New Delhi, India is gratefully acknowledged. We are also thankful to Department of Science and Technology, New Delhi, India for the data collection on the CCD facility setup (Jadvpur University) under DST-FIST program. We also acknowledge CAS, Department of Chemistry, Jadavpur University and DST-PURSE program for other facilities. Pallab Mondal, Rupa Sarkar and Amar Hens are also thankful to CSIR, New Delhi and UGC, New Delhi for the research fellowship.References
- V. Balzani, G. Bergamini, S. Campagna and F. Puntoriero, Top. Curr. Chem., 2007, 280, 1–36 CrossRef CAS.
- (a) R. A. Kirgan, B. P. Sullivan and D. P. Rillema, Top. Curr. Chem., 2007, 281, 45–100 CrossRef CAS; (b) L. Sacksteder, M. Lee, J. N. Demas and B. A. DeGraff, J. Am. Chem. Soc., 1993, 115, 8230–8238 CrossRef CAS.
- (a) S. Campagna, F. Puntoriero, F. Nastasi, G. Bergamini and V. Balzani, Top. Curr. Chem., 2007, 280, 117–214 CrossRef CAS; (b) Y. S. Wang, S. X. Liu, M. R. Pinto, D. M. Dattelbaum, J. R. Schoonover and K. S. Schanze, J. Phys. Chem. A, 2001, 105, 11118–11127 CrossRef CAS.
- (a) D. Kumaresan, K. Shankar, S. Vaidya and R. H. Schmehl, Top. Curr. Chem., 2007, 281, 101–142 CrossRef CAS; (b) Y.-L. Tung, P.-C. Wu, C.-S. Liu, Y. Chi, J.-K. Yu, Y.-H. Hu, P.-T. Chou, S.-M. Peng, G.-H. Lee, Y. Tao, A. J. Carty, C.-F. Shu and F.-I. Wu, Organometallics, 2004, 23, 3745–3748 CrossRef CAS.
- (a) L. Flamigni, A. Barbieri, C. Sabatini, B. Ventura and F. Barigelletti, Top. Curr. Chem., 2007, 281, 143–203 CrossRef CAS; (b) S. Lamansky, P. Djurovich, D. Murphy, F. Abdel-Razzaq, H.-E. Lee, C. Adachi, P. E. Burrows, S. R. Forrest and M. E. Thompson, J. Am. Chem. Soc., 2001, 123, 4304–4312 CrossRef CAS PubMed.
- (a) E. Holder, B. M. W. Langeveld and U. S. Schubert, Adv. Mater., 2005, 17, 1109–1121 CrossRef CAS PubMed; (b) Y. Wand, N. Herron, V. V. Grushin, D. D. LeCloux and V. A. Petrov, Appl. Phys. Lett., 2001, 79, 449–451 CrossRef PubMed; (c) H. Xin, F. Y. Li, M. Shi, Z. Q. Bian and H. C. Huang, J. Am. Chem. Soc., 2003, 125, 7166–7167 CrossRef CAS PubMed; (d) A. Tsuboyama, H. Iwawaki, M. Furugori, T. Mukaide, J. Kamatani, S. Igawa, T. Moriyama, S. Miura, T. Takiguchi, S. Okada, M. Hoshino and K. Ueno, J. Am. Chem. Soc., 2003, 125, 12971–12979 CrossRef CAS PubMed.
- M.-W. Louie, H.-W. Liu, M. H.-C. Lam, T.-C. Lau and K. K.-W. Lo, Organometallics, 2009, 28, 4297–4307 CrossRef CAS.
- D. V. Partyka, N. Deligonul, M. P. Washington and T. G. Gray, Organometallics, 2009, 28, 5837–5840 CrossRef CAS.
- Z. Si, X. Li, X. Li and H. Zhang, J. Organomet. Chem., 2009, 694, 3742–3748 CrossRef CAS PubMed.
- (a) S. Ranjan, S.-Y. Lin, K.-C. Hwang, Y. Chi, W.-L. Ching, C.-S. Liu, Y.-T. Tao, C.-H. Chien, S.-M. Peng and G.-H. Lee, Inorg. Chem., 2003, 42, 1248–1255 CrossRef CAS PubMed; (b) N. J. Lundin, A. G. Blackman, K. C. Gordon and D. L. Officer, Angew. Chem., Int. Ed., 2006, 45, 2582–2584 CrossRef CAS PubMed; (c) P. J. Walsh, N. J. Lundin, K. C. Gordon, J.-Y. Kim and C.-H. Lee, Opt. Mater., 2009, 31, 1525–1531 CrossRef CAS PubMed.
- (a) S. K. Mizoguchi, G. Santos, A. M. Andrade, F. J. Fonseca, L. Pereira and N. Y. M. Iha, Synth. Met., 2011, 161, 1972–1975 CrossRef CAS PubMed; (b) D. M. Cleland, G. Irwin, P. Wagner, D. L. Officer and K. C. Gordon, Chem.–Eur. J., 2009, 15, 3682–3690 CrossRef CAS PubMed.
- (a) M. Yedukondalu and M. Ravikanth, J. Chem. Sci., 2011, 123, 201–214 CrossRef CAS PubMed; (b) T. M. McLean, J. L. Moody, M. R. Waterland and S. G. Telfer, Inorg. Chem., 2012, 51, 446–455 CrossRef CAS PubMed; (c) X. Yi, J. Zhao, W. Wu, D. Huang, S. Ji and J. Sun, Dalton Trans., 2012, 41, 8931–8940 RSC.
- J. M. Smieja and C. P. Kubiak, Inorg. Chem., 2010, 49, 9283–9289 CrossRef CAS PubMed.
- (a) H. Takeda, K. Koike, T. Morimoto, H. Inumaru and O. Ishitani, Adv. Inorg. Chem., 2011, 63, 137–186 CrossRef CAS; (b) H. Takeda and O. Ishitani, Coord. Chem. Rev., 2010, 254, 346–354 CrossRef CAS PubMed; (c) A. Coleman, C. Brennan, J. G. Vos and M. T. Pryce, Coord. Chem. Rev., 2008, 252, 2585–2595 CrossRef CAS PubMed; (d) J. Schneider, H. Jia, J. T. Muckerman and E. Fujita, Chem. Soc. Rev., 2012, 41, 2036–2051 RSC.
- (a) C. Bruckmeier, M. W. Lehenmeier, R. Reithmeier, B. Rieger, J. Herranz and C. Kavakli, Dalton Trans., 2012, 41, 5026–5037 RSC; (b) Z.-Y. Bian, H. Wang, W.-F. Fu, L. Li and A.-Z. Ding, Polyhedron, 2012, 32, 78–85 CrossRef CAS PubMed; (c) J. Agarwal, E. Fujita, H. F. Schaefer and J. T. Muckerman, J. Am. Chem. Soc., 2012, 134, 5180–5186 CrossRef CAS PubMed; (d) J. Schneider, K. Q. Vuong, J. A. Calladine, X.-Z. Sun, A. C. Whitwood, M. W. George and R. N. Perutz, Inorg. Chem., 2011, 50, 11877–11889 CrossRef CAS PubMed.
- (a) A. S. Polo, M. K. Itokazu and N. Y. M. Iha, Coord. Chem. Rev., 2004, 248, 1343–1361 CrossRef CAS PubMed; (b) M. T. Spitler and B. A. Parkinson, Acc. Chem. Res., 2009, 42, 2017–2029 CrossRef CAS PubMed.
- (a) S. Liu, Chem. Soc. Rev., 2004, 33, 445–461 RSC; (b) C. Sundararajan, T. R. Besanger, R. Labiris, K. J. Guenther, T. Strack, R. Garafalo, T. T. Kawabata, D. Finco-Kent, J. Zubieta, J. W. Babich and J. F. Valliant, J. Med. Chem., 2010, 53, 2612–2621 CrossRef CAS PubMed.
- (a) V. Fernández-Moreira, F. L. Thorp-Greenwood and M. P. Coogan, Chem. Commun., 2010, 46, 186–202 RSC; (b) K. K.-W. Lo, Top. Organomet. Chem., 2010, 29, 115–158 CrossRef CAS; (c) K. K.-W. Lo, W.-K. Hui, C. K. Chung, K. H.-K. Tsang, D. C.-M. Ng and K.-K. Cheung, Coord. Chem. Rev., 2005, 249, 1434–1450 CrossRef CAS PubMed.
- Y. Shen and B. P. Sullivan, J. Chem. Educ., 1997, 74, 685–689 CrossRef CAS.
- (a) V. W. W. Yam, B. Li, Y. Yang, B. W. K. Chu, K. M. C. Wong and K. K. Cheung, Eur. J. Inorg. Chem., 2003, 4035–4042 CrossRef CAS PubMed; (b) K. Wang, L. Huang, L. H. Gao, L. Jin and C. Huang, Inorg. Chem., 2002, 41, 3353–3358 CrossRef CAS PubMed; (c) B. Li, M. Li, Z. Hong, W. Li, T. Yu and H. Wei, Appl. Phys. Lett., 2004, 85, 4786–4788 CrossRef CAS PubMed.
- C. Fu, M. Li, Z. Su, Z. Hong, W. Li and B. Li, Appl. Phys. Lett., 2006, 88, 093507 CrossRef PubMed.
- (a) X. Gong, P. K. Ng and W. K. Chan, Adv. Mater., 1998, 10, 1337–1340 CrossRef CAS; (b) F. Li, M. Zhang, J. Feng, G. Cheng, Z. Wu, Y. Ma, S. Liu, J. Sheng and S. T. Lee, Appl. Phys. Lett., 2003, 83, 365–367 CrossRef CAS PubMed; (c) W. K. Chan, P. K. Ng, X. Gong and S. Hou, Appl. Phys. Lett., 1999, 75, 3920–3922 CrossRef CAS PubMed.
- (a) R. A. Allred, S. A. Huefner, K. Rudzka, A. M. Arif and L. M. Berreau, Dalton Trans., 2007, 351–357 RSC; (b) B. Adhikary, S. Liu and C. R. Lucas, Inorg. Chem., 1993, 32, 5957–5962 CrossRef CAS; (c) A. K. Singh and R. Mukherjee, Dalton Trans., 2005, 2886–2891 RSC.
- (a) F. Thomas, Eur. J. Inorg. Chem., 2007, 2379–2404 CrossRef CAS PubMed; (b) L. Zhou, D. Powell and K. M. Nicholas, Inorg. Chem., 2007, 46, 7789–7799 CrossRef CAS PubMed; (c) M. Rombach, J. Seebacher, M. Ji, G. Zhang, G. He, M. M. Ibrahim, B. Benkmil and H. Vahrenkamp, Inorg. Chem., 2006, 45, 4571–4575 CrossRef CAS PubMed; (d) L. M. Berreau, Eur. J. Inorg. Chem., 2006, 273–283 CrossRef CAS PubMed.
- M. Busby, P. Matousek, M. Towrie and A. Vlcek, J. Phys. Chem. A, 2005, 109, 3000–3008 CrossRef CAS PubMed.
- A. S. Polo, M. K. Itokazu, K. M. Frin, A. O. T. Patrocinio and N. Y. M. Iha, Coord. Chem. Rev., 2006, 250, 1669–1680 CrossRef CAS PubMed.
- M. A. L. Marques and E. K. U. Gross, Annu. Rev. Phys. Chem., 2004, 55, 427–455 CrossRef CAS PubMed.
- Y. Wang, Y. Wang, J. Wang, Y. Liu and Y. Yang, J. Am. Chem. Soc., 2009, 131, 8839–8847 CrossRef CAS PubMed.
- X. Gao, Y. Wang, Y. Wang, J. Jia and X. Su, Sci. Sin.: Chim., 2011, 41, 1145–1155 Search PubMed.
- (a) K. Wolinski, J. F. Hinton and P. Pulay, J. Am. Chem. Soc., 1990, 112, 8251–8260 CrossRef CAS; (b) P. Taehtinen, A. Bagno, K. Klika and K. Pihlaja, J. Am. Chem. Soc., 2003, 125, 4609–4618 CrossRef CAS PubMed.
- F. Cloran, I. Carmichael and A. S. Serianni, J. Am. Chem. Soc., 2001, 123, 4781–4791 CrossRef CAS PubMed.
- (a) A. K. Mahapatra, S. Datta, S. Goswami, M. Mukherjee, A. K. Mukherjee and A. Chakravorty, Inorg. Chem., 1986, 25, 1715–1721 CrossRef CAS; (b) R. L. Shriner, H. C. Struck and W. J. Jorison, J. Am. Chem. Soc., 1930, 52, 2060–2069 CrossRef CAS.
- (a) A. Burawoy and C. E. Vellins, J. Chem. Soc., 1954, 90–95 RSC; (b) S. E. Livingstone, J. Chem. Soc., 1956, 437–440 RSC.
- M. Turki, C. Daniel and S. Záliš, J. Am. Chem. Soc., 2001, 123, 11431–11440 CrossRef CAS PubMed.
- D. R. Striplin and G. A. Crosby, Coord. Chem. Rev., 2001, 211, 163–175 CrossRef CAS.
- (a) B. D. Rossener, D. J. Stufkens and A. Vlček Jr, Inorg. Chem., 1996, 35, 2902–2909 CrossRef; (b) S. M. Fredericks, J. C. Luong and M. S. Wrighton, J. Am. Chem. Soc., 1979, 101, 7415–7417 CrossRef CAS.
- (a) L. A. Worl, R. Duesing, P. Chen, L. D. Ciana and T. J. Meyar, J. Chem. Soc., Dalton Trans., 1991, 849–858 RSC; (b) M. S. Wrighton and D. L. Morse, J. Am. Chem. Soc., 1974, 96, 998–1003 CrossRef CAS.
- R. L. Martin, J. Chem. Phys., 2003, 118, 4775–4777 CrossRef CAS PubMed.
- (a) A. Juris, V. Balzani, F. Barigelletti, S. Campagna, P. Besler and A. von Zelewsky, Coord. Chem. Rev., 1988, 84, 85–277 CrossRef CAS; (b) J. V. Caspar and T. J. Meyer, J. Am. Chem. Soc., 1983, 105, 5583–5590 CrossRef CAS; (c) M. Gleria, F. Minto, G. Beggiato and P. Bortolus, J. Chem. Soc., Chem. Commun., 1978, 285a–285a RSC; (d) B. Durham, J. V. Caspar, J. K. Nagle and T. J. Meyer, J. Am. Chem. Soc., 1982, 104, 4803–4810 CrossRef CAS.
- L. Wallace and D. P. Rillema, Inorg. Chem., 1993, 32, 3836–3843 CrossRef CAS.
- J. van Houten and R. J. Watts, J. Am. Chem. Soc., 1976, 98, 4853–4858 CrossRef CAS.
- E. Runge and E. K. U. Gross, Phys. Rev. Lett., 1984, 52, 997–1000 CrossRef CAS.
- A. D. Becke, J. Chem. Phys., 1993, 98, 5648–5652 CrossRef CAS PubMed.
- C. Lee, W. Yang and R. G. Parr, Phys. Rev. B: Condens. Matter Mater. Phys., 1988, 37, 785–789 CrossRef CAS.
- (a) M. E. Casida, C. Jamoroski, K. C. Casida and D. R. Salahub, J. Chem. Phys., 1998, 108, 4439–4449 CrossRef CAS PubMed; (b) R. E. Stratmann, G. E. Scuseria and M. J. Frisch, J. Chem. Phys., 1998, 109, 8218–8224 CrossRef CAS PubMed; (c) R. Bauernschmitt and R. Ahlrichs, Chem. Phys. Lett., 1996, 256, 454–464 CrossRef CAS.
- (a) V. Barone and M. Cossi, J. Phys. Chem. A, 1998, 102, 1995–2001 CrossRef CAS; (b) M. Cossi and V. Barone, J. Chem. Phys., 2001, 115, 4708–4717 CrossRef CAS PubMed; (c) M. Cossi, N. Rega, G. Scalmani and V. Barone, J. Comput. Chem., 2003, 24, 669–681 CrossRef CAS PubMed.
- (a) T. Liu, H.-X. Zhang and B.-H. Xia, J. Phys. Chem. A, 2007, 111, 8724–8730 CrossRef CAS PubMed; (b) X. Zhou, H.-X. Zhang, Q.-J. Pan, B.-H. Xia and A.-C. Tang, J. Phys. Chem. A, 2005, 109, 8809–8818 CrossRef CAS PubMed; (c) X. Zhou, A.-M. Ren and J.-K. Feng, J. Organomet. Chem., 2005, 690, 338–347 CrossRef CAS PubMed; (d) A. Albertino, C. Garino, S. Ghiani, R. Gobetto, C. Nervi, L. Salassa, E. Rosenverg, A. Sharmin, G. Viscardi, R. Buscaino, G. Cross and M. Milanesio, J. Organomet. Chem., 2007, 692, 1377–1391 CrossRef CAS PubMed.
- (a) P. J. Hay and W. R. Wadt, J. Chem. Phys., 1985, 82, 270–283 CrossRef CAS PubMed; (b) P. J. Hay and W. R. Wadt, J. Chem. Phys., 1985, 82, 299–310 CrossRef CAS PubMed.
- T. H. Dunning and P. J. Hay, in Modern Theoretical Chemistry, ed. H. F. Schaefer, III, Plenum, New York, 1976, vol. 3, p. 1 Search PubMed.
- A. Schaefer, C. Huber and R. Ahlrichs, J. Chem. Phys., 1994, 100, 5829–5835 CrossRef CAS PubMed.
- (a) P. Mondal, A. Hens, S. Basak and K. K. Rajak, Dalton Trans., 2013, 42, 1536–1549 RSC; (b) S. Basak, D. Chopra and K. K. Rajak, J. Organomet. Chem., 2008, 693, 2649–2656 CrossRef CAS PubMed; (c) K. E. Henry, R. G. Balasingham, A. R. Vortherms, J. A. Platts, J. F. Valliant, M. P. Coogan, J. Zubieta and R. P. Doyle, Chem. Sci., 2013, 4, 2490–2495 RSC; (d) S. Chatterjee, A. S. D. Negro, Z. Wang, M. K. Edwards, F. N. Skomurski, S. E. Hightower, J. A. Krause, B. Twamley, B. P. Sullivan, C. Reber, W. R. Heineman, C. J. Seliskar and S. A. Btyan, Inorg. Chem., 2011, 50, 5815–5823 CrossRef CAS PubMed.
- (a) K. Wolniski, J. F. Hilton and P. Pulay, J. Am. Chem. Soc., 1990, 112, 8251–8260 CrossRef; (b) R. Ditchfield, Mol. Phys., 1974, 27, 789–807 CrossRef CAS; (c) R. Mcweeny, Phys. Rev., 1962, 126, 1028–1034 CrossRef; (d) F. London, J. Phys. Chem., 1937, 397–409 CAS.
- (a) C. M. Rohlfing, L. C. Allen and R. Ditchfield, Chem. Phys., 1984, 87, 9–15 CrossRef CAS; (b) M. Cossi, V. Barone, B. Mennucci and J. Tomasi, Chem. Phys. Lett., 1998, 286, 253–260 CrossRef CAS; (c) E. Cancès, B. Mennucci and J. Tomasi, J. Chem. Phys., 1997, 107, 3032–3041 CrossRef PubMed.
- M. J. Frisch, G. W. Trucks, H. B. Schlegel, G. E. Scuseria, M. A. Robb, J. R. Cheeseman, G. Scalmani, V. Barone, B. Mennucci, G. A. Petersson, H. Nakatsuji, M. Caricato, X. Li, H. P. Hratchian, A. F. Izmaylov, J. Bloino, G. Zheng, J. L. Sonnenberg, M. Hada, M. Ehara, K. Toyota, R. Fukuda, J. Hasegawa, M. Ishida, T. Nakajima, Y. Honda, O. Kitao, H. Nakai, T. Vreven, J. A. Montgomery Jr, J. E. Peralta, F. Ogliaro, M. Bearpark, J. J. Heyd, E. Brothers, K. N. Kudin, V. N. Staroverov, R. Kobayashi, J. Normand, K. Raghavachari, A. Rendell, J. C. Burant, S. S. Iyengar, J. Tomasi, M. Cossi, N. Rega, J. M. Millam, M. Klene, J. E. Knox, J. B. Cross, V. Bakken, C. Adamo, J. Jaramillo, R. Gomperts, R. E. Stratmann, O. Yazyev, A. J. Austin, R. Cammi, C. Pomelli, J. W. Ochterski, R. L. Martin, K. Morokuma, V. G. Zakrzewski, G. A. Voth, P. Salvador, J. J. Dannenberg, S. Dapprich, A. D. Daniels, Ö. Farkas, J. B. Foresman, J. V. Ortiz, J. Cioslowski and D. J. Fox, Gaussian 09, (Revision A.1), Gaussian, Inc., Wallingford, CT, 2009 Search PubMed.
- N. M. O'Boyle, A. L. Tenderholt and K. M. Langner, J. Comput. Chem., 2008, 29, 839–845 CrossRef PubMed.
- SMART (V 5.628), SAINT (V 6.45a), XPREP, SHELXTL, Bruker AXS Inc., Madison, WI, 1998 Search PubMed.
- G. M. Sheldrick, SADABS (Version 2.03), University of Göttingen, Germany, 2002 Search PubMed.
- G. M. Sheldrick, SHELXS-97, Acta Crystallogr., Sect. A: Found. Crystallogr., 2008, 64, 112 CrossRef CAS PubMed.
- L. J. Farrugia, J. Appl. Crystallogr., 1997, 30, 565 CrossRef CAS.
- L. J. Farrugia, WinGX, J. Appl. Crystallogr., 1999, 32, 837–838 CrossRef CAS.
Footnote |
| † Electronic supplementary information (ESI) available: X-ray crystallographic file in CIF format for [Re(L1)(CO)3Cl], 1 and [Re(L1)(CO)3Cl], 2; linear correlation between the experimental and calculated 13C NMR chemical shifts of 1 (Fig. S1); optimized molecular structures of all complexes at lowest lying triplet excited state (Fig. S2); energies (eV) and composition (%) of frontier molecular orbitals (FMOs) of complexes 2 and 3 at singlet ground state (S0) (Tables S1 and S2); main calculated optical transition for complex 2 and 3 with composition in terms of molecular orbital contribution of the transition, vertical excitation energies and oscillator strength in dichloromethane (Tables S3 and S4). CCDC 968828 and 968829. For ESI and crystallographic data in CIF or other electronic format see DOI: 10.1039/c4ra05699j |
| This journal is © The Royal Society of Chemistry 2014 |

