γ-irradiation induced one-step synthesis of electromagnetic functionalized reduced graphene oxide–Ni nanocomposites†
Hongtao Zhao*abc,
Zhigang Li*bc,
Nan Zhangbc,
Yunchen Dub,
Siwei Lib,
Lin Shaoa,
Deyu Gaob,
Xijiang Hanb and
Ping Xu*b
aFundamental Science on Nuclear Safety and Simulation Technology Laboratory, Harbin Engineering University, Harbin 150009, China
bHIT-HAS Laboratory of High-Energy Chemistry and Interdisciplinary Science, Harbin Institute of Technology, Harbin 150001, China. E-mail: pxu@hit.edu.cn; zhaohongtao1976@163.com; lzg0015@163.com
cInstitute of Technical Physics, Heilongjiang Academy of Sciences, Harbin 150009, China
First published on 1st July 2014
Abstract
We here demonstrate a facile one-step synthesis of RGO–Ni hybrid materials, where Ni2+ ions and GO are simultaneously reduced by γ-irradiation. RGO–Ni, with Ni nanoparticles well dispersed on the RGO surface, shows a more enhanced EM absorption ability than the individuals.
Electromagnetic (EM) absorption materials have attracted more and more attention owing to their applications in the areas of electronic industry-wireless devices, advanced electronics, electromagnetic interference.1–3 Ideal EM absorption material should meet the following demands: thin in thickness, light in weight, wide in adsorption band, and strong in adsorption.4 The significant parameters that influence the absorbing properties are the complex permeability (μr) and permittivity (εr).5 Traditionally, ferrites and magnetic metals such as Fe, Co, Ni and their alloys have been widely considered as promising EM absorption materials owing to their strong complex permeability.6 However, their high density and large required thickness restrict their universal application in EM-related fields. Through a careful control of the reaction condition, the prepared hierarchical Ni nanostructures themselves only showed a maximum reflection loss of about −10 dB.7 Consequently, design and successful preparation of materials with lightweight and stable electromagnetic absorption characteristics are urgent and necessary.
In previous reports,8 nanocomposites consisting of carbon nanotubes (CNTs) and magnetic materials have been exploited as efficient EM absorbers, although the absorbing ability of CNTs itself is relatively weak, and complicated fabrication techniques are required. Compared to CNTs, graphene is an ideal matrix for loading magnetic nanoparticles because of its unique properties, which is a two dimensional sheet of carbon atoms that bond together in a hexagonal lattice possessing high mechanical strength, high thermal conductivity, high electron mobility and high specific surface area.9 Considering its unique electronic properties, efforts have been made to develop graphene-based EM absorption materials. Chen et al. fabricated Fe–graphene nanocomposites and the maximum reflection loss to electromagnetic waves was up to −31.5 dB at 14.2 GHz with a thickness of 2.5 mm.10 Li et al. has reported the Fe3O4–graphene hybrids with reflection loss exceeding −10 dB in 7.5–18 GHz with thicknesses of 1.48–3 mm, accompanying a maximum reflection loss value of −30.1 dB at a 1.48 mm matching thickness and 17.2 GHz matching frequency.11 Our previous study has shown that reduced graphene oxide (RGO), with the presence of defect and oxygen-containing groups, can display better EM absorption performance than graphite, due to the introduction of additional polarization relaxations.12
Herein, we report a one-step facile and clean method to synthesize RGO–Ni nanocomposites via a γ-irradiation technique (see Scheme 1). RGO–Ni nanocomposites, with Ni nanoparticles evenly supported on RGO, can be directly obtained from a solution containing GO and Ni2+ ions by a γ-irradiation induced reduction process. The as-fabricated RGO–Ni nanocomposites, combining the synergetic EM absorption effect from RGO (dielectric loss) and Ni (magnetic loss), show enhanced EM absorption performances as compared to the individual components.
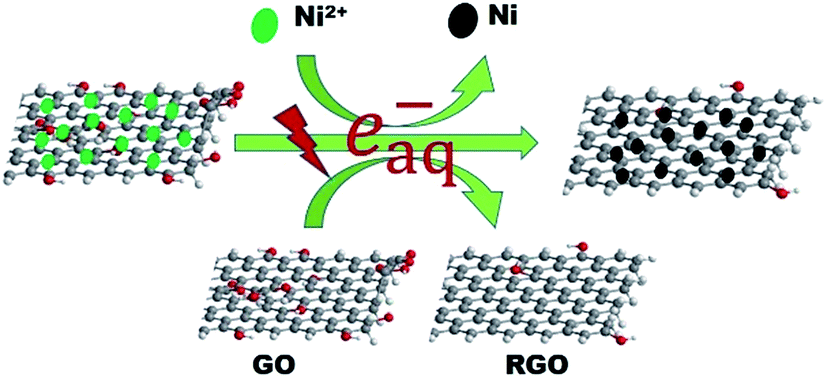 | ||
| Scheme 1 Schematic illustration of the one-step synthesis of RGO–Ni nanocomposites via a γ-irradiation technique. | ||
Graphite oxide (GO) was prepared using expansible graphite by the pressurized oxidation and multiplex reduction method.13 In a typical synthesis, a solution of Ni2+ ions was added into the GO suspension, and then propanol was added. The solution was bubbled with nitrogen for 30 min to remove dissolved oxygen and then sealed, before it was subjected to γ-irradiation. During the irradiation process, water molecules would be decomposed into both oxidative (hydroxyl radical, ˙OH) and reductive (hydrogen and hydrated electrons, H and eaq−) species.14,15 Alcohols introduced into the system can eliminate the oxidative species as radical scavengers while keep the useful reductive species,16 which enable the reduction of GO and Ni2+ ions simultaneously to produce RGO–Ni nanocomposites. From Fig. 1a, the RGO nanosheets reduced from GO by γ-irradiation are ultrathin and transparent. The wrinkled and rippled structure has also been observed on highly exfoliated RGO samples as reported in the literature,17 which is due to deformation upon the exfoliation and restacking process. Fig. 1b shows the TEM image of the as-prepared RGO–Ni nanocomposites, where the Ni nanoparticles are well dispersed on RGO surface, preferentially populated at the wrinkled and rippled sites. HR-TEM image in Fig. 1c shows that these Ni nanoparticles are highly crystallized. Size histogram in Fig. 1d reveals that these Ni nanoparticles are mostly 8–12 nm in size. Morphology and size features from SEM images agree well with the TEM images (see Fig. S1 in ESI†).
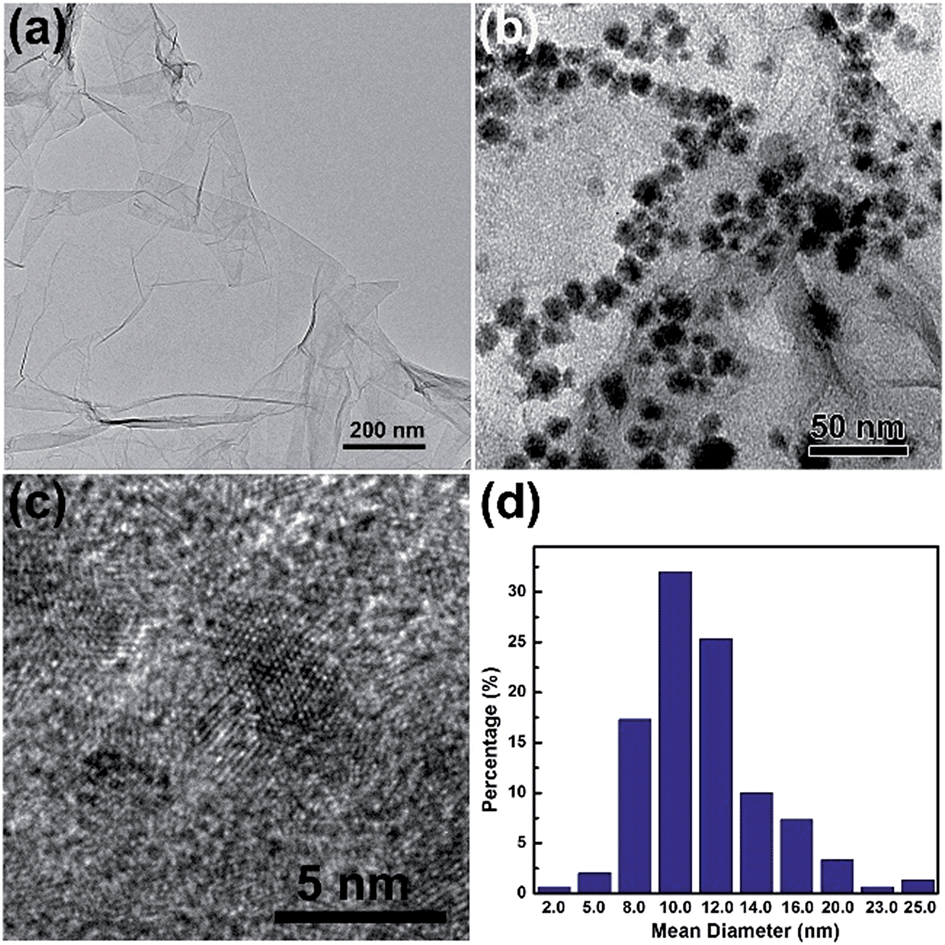 | ||
| Fig. 1 TEM images of the as-prepared RGO (a) and RGO–Ni nanocomposites (b), HR-TEM images of the RGO–Ni nanocomposites (c), and size distribution of the Ni nanoparticles supported on RGO (d). | ||
Fig. 2a shows the X-ray diffraction (XRD) patterns of the as-prepared samples. A feature diffraction peak of GO at 2θ = 10.6° corresponding to the (001) plane appears as the stacking order is observed and the d-spacing expanded to 0.85 nm.18 The reduction of GO into RGO after γ-irradiation can be verified from the disappearance of (001) peak, and the peak at 2θ = 23.5°is ascribed to the (002) plane of RGO. For RGO–Ni nanocomposite, the peaks at 2θ = 44.42°, 51.82°, and 76.26° can be well indexed to the (111), (200), and (220) (JCPDS 04-0850) planes of face-centered cubic (fcc) Ni crystals. The highly crystallized Ni nanoparticles prevents us from seeing the (002) peak of RGO. The average size of Ni nanoparticles estimated from XRD by Scherrer's equation agrees well with the that found from the TEM images.19 XRD results have confirmed the simultaneous reduction of Ni2+ ions and GO during the γ-irradiation process to produce RGO–Ni nanocomposites.
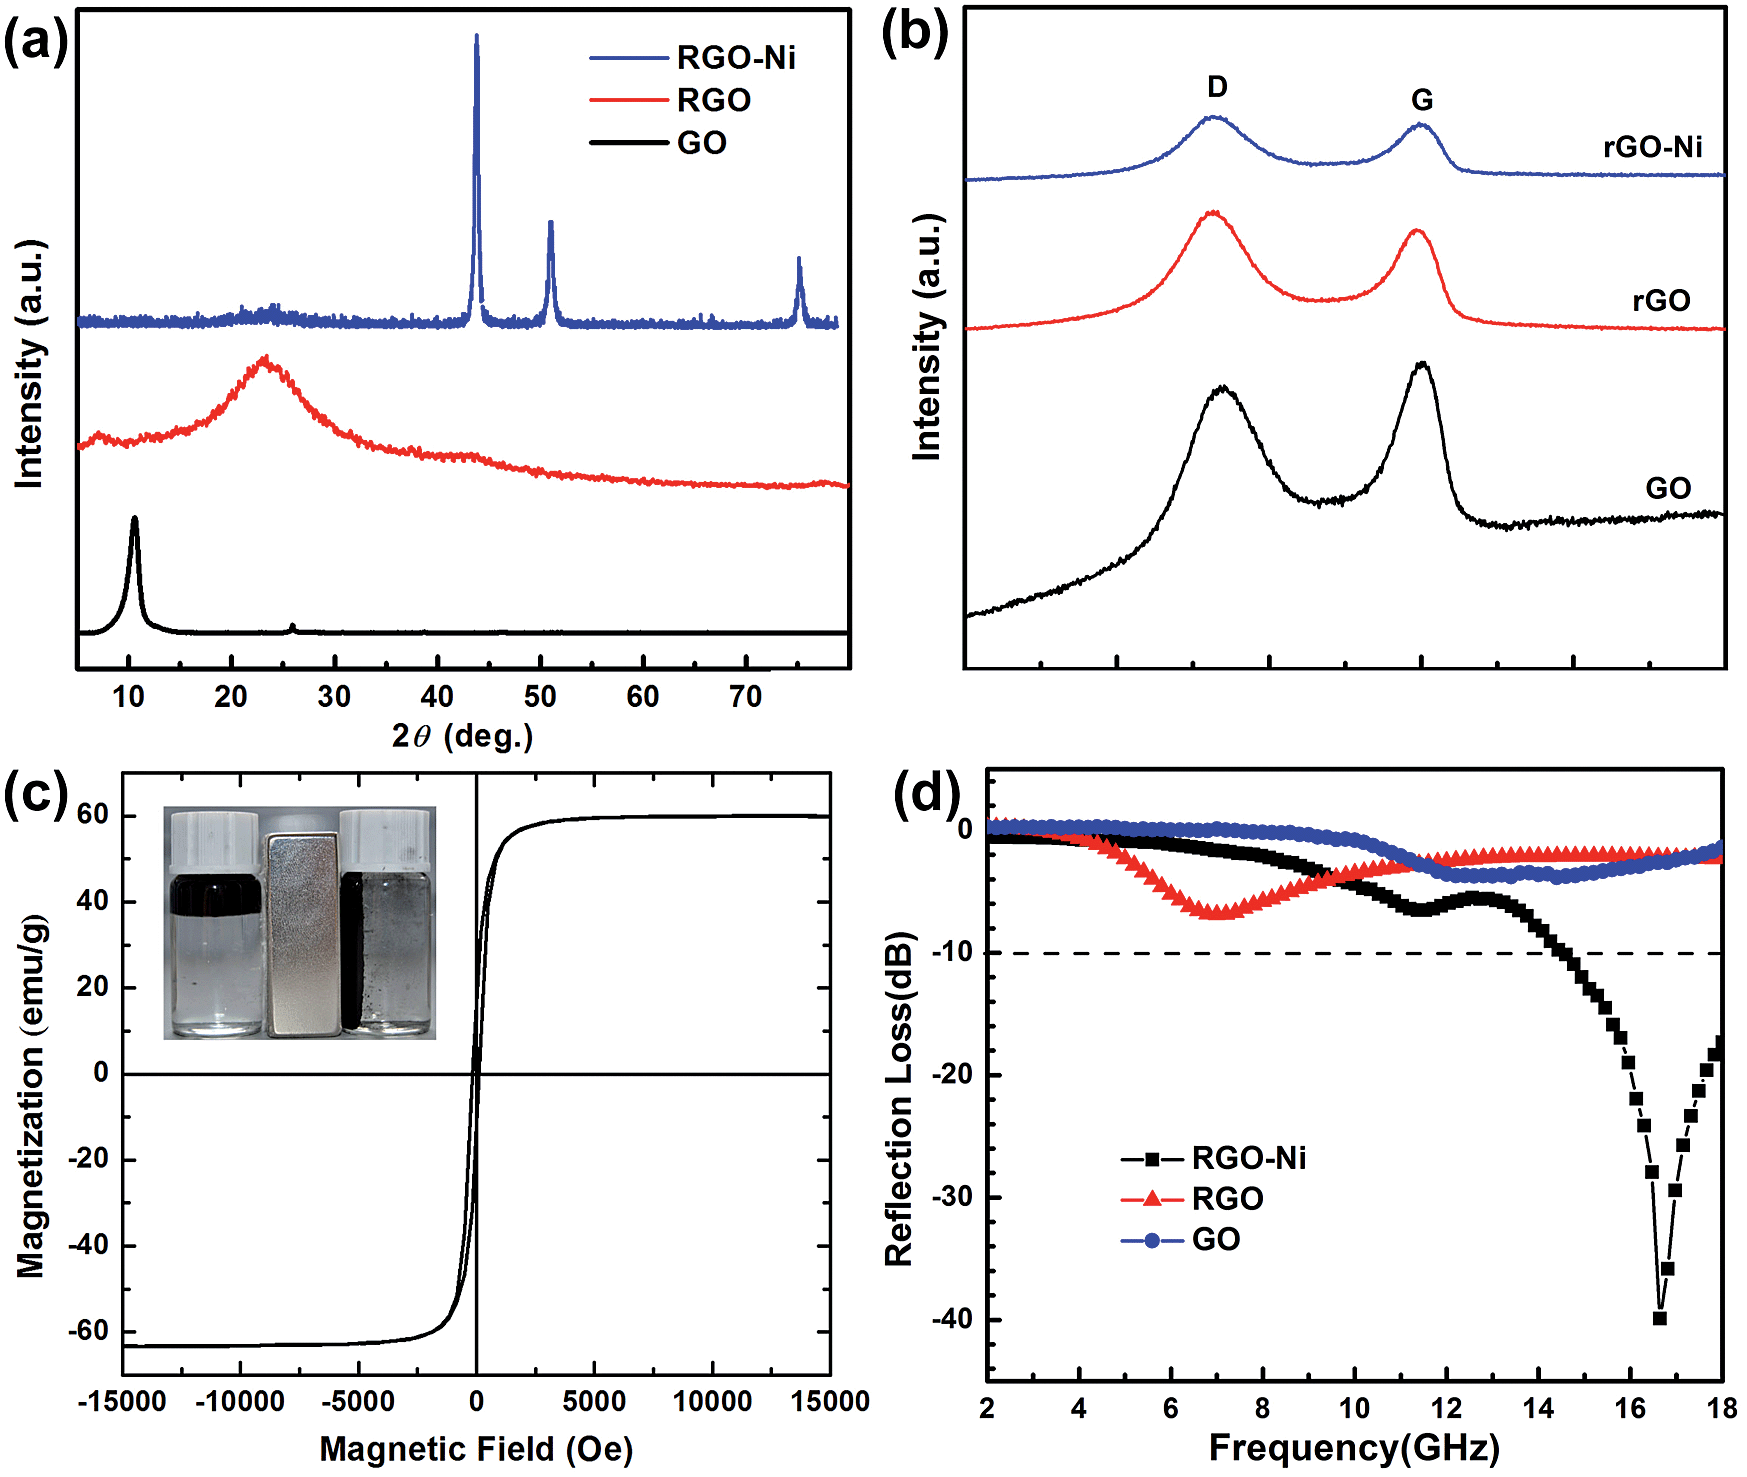 | ||
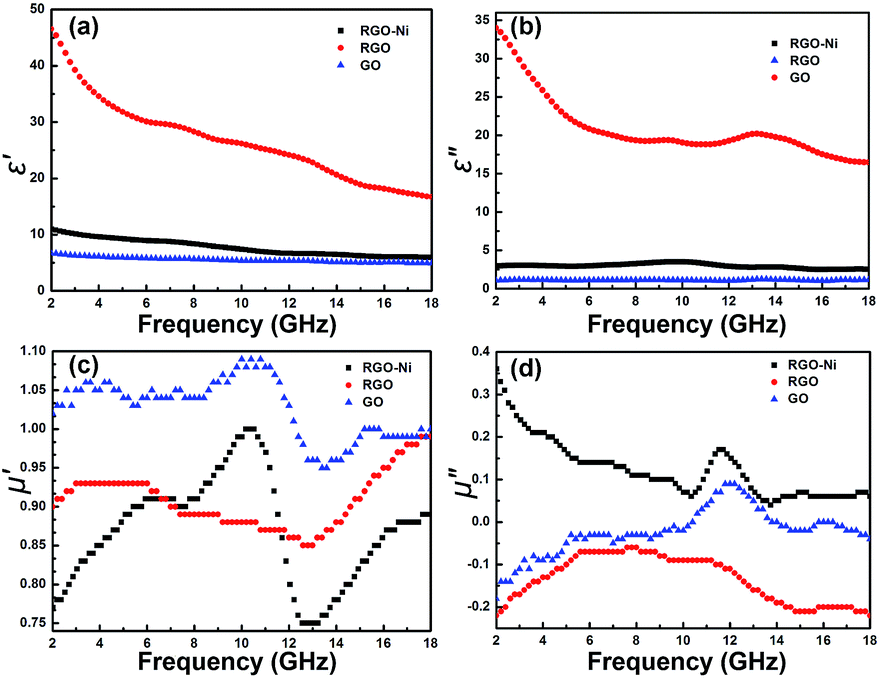
| Fig. 2 X-ray diffraction (XRD) patterns (a), Raman spectra (b), and EM absorption properties (d) of the prepared GO, RGO, and RGO–Ni nanocomposites. (c) Magnetic property of the RGO–Ni nanocomposites. | ||
Raman spectra of the as-prepared samples are shown in Fig. 2b, where G band is mainly assigned to the in-plane displacement of carbon atoms in hexagonal carbon sheets and D band is caused by the disorder in the graphitic structure due to the extensive oxidation and exfoliation.20 The intensity ratio of D band and G band, ID/IG, of RGO (1.72) is higher than that of GO (1.12), which confirms successful reduction of GO as γ-irradiation may introduce more defects.21,22 The reduction of GO to RGO can also be manifested by the FT-IR results (see Fig. S2 in ESI†).23 In the RGO–Ni nanocomposite, a slightly higher ID/IG value (1.80) than RGO was found, which might be caused by the interaction of Ni nanoparticles with residual oxygen-containing groups on RGO surface.24 The as-prepared RGO–Ni sample shows a saturation magnetization of ∼58 emu per g, which renders an easy collection and separation of the sample from the aqueous phase (Fig. 2c).
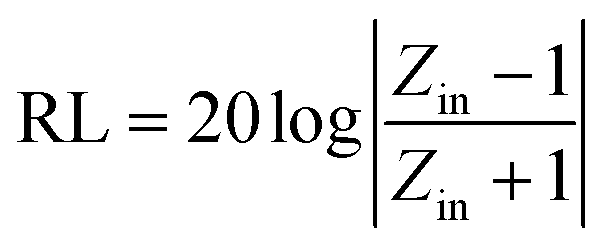
The reflection loss (RL) properties of the prepared samples are evaluated by the transmission line theory.25
 | (1) |
 | (2) |
In order to better understand the EM absorption performances of the as-prepared materials, the EM parameters (μr and εr) have been outlined in Fig. 3. The real part (ε′) and imaginary part (ε′′)of permittivity represent the energy storage ability and loss ability, respectively. ε′ values of all the samples decrease with the increase in the frequency, and RGO has the highest ε′ due to improved conductivity (Fig. 3a). With the decoration of Ni nanoparticles, RGO–Ni has medium ε′ values. GO has lowest ε′, mainly due to its deteriorated conductivity after a damage of the carbon structures of defect-free graphene. Fig. 3b shows the ε′′ values of the prepared samples, which are almost constantly zero in the whole frequency range for GO. After reduction, RGO has tremendously larger ε′′ values, which decrease from 33.6 at 2 GHz to 16 at 18 GHz. RGO–Ni shows decreased and steady ε′′ values at about 3 in the range of 2–18 GHz. As shown in Fig. 3c, μ′ values display no regular rules for the three samples, where GO has the highest values in the whole frequency range. μ′ for RGO–Ni increases from 0.78 at 2 GHz to 1.00 at 10.6 GHz, then decreases sharply to 0.75 at 12.4 GHz, and then increases to 0.87 at 18 GHz. However, from μ′′ values in Fig. 3d, one can see that RGO–Ni sample shows enhanced magnetic loss property. RGO and GO mostly are negative in μ′′, an indication of no magnetic loss due to the absence of magnetic component in the materials. While, μ′′ of RGO–Ni decreases from 0.36 at 2 GHz to 0.05 at 18 GHz, with a peak of 0.15 at 11.6 GHz. A comparison of the dielectric loss (ε′′/ε′) and magnetic loss (μ′′/μ′) demonstrates that besides maintained dielectric loss from RGO, RGO–Ni has much improved magnetic loss through the introduction of Ni nanoparticles (see Fig. S3 and S4 in ESI†).
 | ||
| Fig. 3 Real part (ε′, a) and imaginary part (ε′′, b) of permittivity, and real part (μ′, c) and imaginary part (μ′′, d) of permeability of the prepared GO, RGO, and RGO–Ni nanocomposites. | ||
In a previous work, we have investigated the EM absorption mechanism of RGO materials, where defect polarization relaxation and electronic dipole relaxation due to the presence of defect and oxygen-containing functional groups mainly contribute to the enhanced EM absorption (dielectric loss) behaviors of RGO.12 Here, for the RGO–Ni hybrid material, dielectric loss is still maintained, and introduction of Ni nanoparticles brings another loss factor, magnetic loss. Moreover, from the ε′ values, one can see that the electric conductivity of RGO–Ni should be considerably smaller than that of RGO according to the free electron theory, and thus an improved impedance matching can be expected for the hybrid material, as too high permittivity of absorber is harmful to the impedance matching and results in strong reflection and weak absorption.28 Therefore, EM absorption of RGO–Ni originates from a synergetic consequence of dielectric loss, magnetic loss and improved impedance matching.
In summary, we have demonstrated a facile one-step synthesis of electromagnetic functionalized RGO–Ni nanocomposites, where Ni2+ ions and GO are simultaneously reduced by the γ-irradiation process. The as-prepared RGO–Ni hybrid material shows greatly enhanced electromagnetic absorption ability than RGO at higher frequencies, due to the introduction of magnetic loss. A maximum RL value of −40 dB is found at 16.6 GHz for RGO–Ni, and all RL values are higher than −10 dB in the frequency range of 14.2–18 GHz. EM absorption of RGO–Ni originates from a synergetic consequence of dielectric loss, magnetic loss and improved impedance matching. We believe the as-described γ-irradiation induced reduction technique will be appealing for the fabrication of RGO–metal nanocomposites for various applications.
Acknowledgements
We acknowledge the financial supports from China Postdoctor Fund (2013M530149) and Heilongjiang Postdoctor Fund (LBH-Z13065), Natural Science Foundation of China (no. 21203045, 21101041, 21371039, 51377048), Fundamental Research Funds for the Central Universities (grant no. HIT. NSRIF. 2010065 and 2011017, and HIT. BRETIII. 201223), Heilongjiang Province Outstanding Youth Fund (JC201414), Heilongjiang Academy of Sciences Youth Fund (CX13C01), and Harbin Technological Innovation Talent Research Special Fund (2012RFQYG117, 2013RFQYG170, 2014RFXYJ037, 2014RFQYG074).Notes and references
- J. Guo, X. Wang, X. Liao, W. Zhanga and B. Shi, J. Phys. Chem. C, 2012, 116, 8188–8195 CAS.
- G. Sun, B. Dong, M. Cao, B. Wei and C. Hu, Chem. Mater., 2011, 23, 1587–1593 CrossRef CAS.
- H.-B. Zhang, Q. Yan, W.-G. Zheng, Z. He and Z.-Z. Yu, ACS Appl. Mater. Interfaces, 2011, 3, 918–924 CAS.
- C.-L. Zhu, M.-L. Zhang, Y.-J. Qiao, G. Xiao, F. Zhang and Y.-J. Chen, J. Phys. Chem. C, 2010, 114, 16229–16235 CAS.
- Z. W. Li, Z. H. Yang and L. B. Kong, J. Appl. Phys., 2011, 110, 063907 CrossRef PubMed.
- F. Wang, J. Liu, J. Kong, Z. Zhang, X. Wang, M. Itohb and K.-i. Machida, J. Mater. Chem., 2011, 21, 4314–4320 RSC.
- C. Wang, X. J. Han, P. Xu, J. Y. Wang, Y. C. Du, X. H. Wang, W. Qin and T. Zhang, J. Phys. Chem. C, 2010, 114, 3196–3203 CAS.
- R. Lv, F. Kang, J. Gu, X. Gui, J. Wei, K. Wang and D. Wu, Appl. Phys. Lett., 2008, 93, 223105 CrossRef PubMed.
- V. Georgakilas, M. Otyepka, A. B. Bourlinos, V. Chandra, N. Kim, K. C. Kemp, P. Hobza, R. Zboril and K. S. Kim, Chem. Rev., 2012, 112, 6156–6214 CrossRef CAS PubMed.
- Y. Chen, Z. Lei, H. Wu, C. Zhu, P. Gao, Q. Ouyang, L.-H. Qi and W. Qin, Mater. Res. Bull., 2013, 48, 3362–3366 CrossRef CAS PubMed.
- X. Li, H. Yi, J. Zhang, J. Feng, F. Li, D. Xue, H. Zhang, Y. Peng and N. Mellors, J. Nanopart. Res., 2013, 15, 1–11 Search PubMed.
- C. Wang, X. J. Han, P. Xu, X. L. Zhang, Y. C. Du, S. R. Hu, J. Y. Wang and X. H. Wang, Appl. Phys. Lett., 2011, 98, 072906 CrossRef PubMed.
- C. Bao, L. Song, W. Xing, B. Yuan, C. A. Wilkie, J. Huang, Y. Guo and Y. Hu, J. Mater. Chem., 2012, 22, 6088–6096 RSC.
- H. Zhao, Z. Li, N. Zhang, S. Li, L. Xiong, S. Liu, W. Jin, L. Kang and P. Xu, RSC Adv., 2014, 4, 20247–20251 RSC.
- J. L. Marignier, J. Belloni, M. O. Delcourt and J. P. Chevalier, Nature, 1985, 317, 2 CrossRef.
- G. E. Boris, Russ. Chem. Rev., 2004, 73, 101 CrossRef PubMed.
- E. D. Grayfer, A. S. Nazarov, V. G. Makotchenko, S.-J. Kim and V. E. Fedorov, J. Mater. Chem., 2011, 21, 3410–3414 RSC.
- Z.-J. Fan, W. Kai, J. Yan, T. Wei, L.-J. Zhi, J. Feng, Y.-m. Ren, L.-P. Song and F. Wei, ACS Nano, 2010, 5, 191–198 CrossRef PubMed.
- X. H. Huang, Z. Y. Zhan, X. Wang, Z. Zhang, G. Z. Xing, D. L. Guo, D. P. Leusink, L. X. Zheng and T. Wu, Appl. Phys. Lett., 2010, 97, 203112 CrossRef PubMed.
- S. Stankovich, D. A. Dikin, R. D. Piner, K. A. Kohlhaas, A. Kleinhammes, Y. Jia, Y. Wu, S. T. Nguyen and R. S. Ruoff, Carbon, 2007, 45, 1558–1565 CrossRef CAS PubMed.
- W. Y. Li, J. G. Liu and C. W. Yan, Carbon, 2013, 55, 313–320 CrossRef CAS PubMed.
- Y. X. Xu, H. Bai, G. W. Lu, C. Li and G. Q. Shi, J. Am. Chem. Soc., 2008, 130, 5856–5857 CrossRef CAS PubMed.
- Z. G. Wang, Y. Hu, W. L. Yang, M. J. Zhou and X. Hu, Sensors, 2012, 12, 4860–4869 CrossRef CAS PubMed.
- X. Sun, J. He, G. Li, J. Tang, T. Wang, Y. Guo and H. Xue, J. Mater. Chem. C, 2013, 1, 765–777 RSC.
- P. Xu, X. J. Han, J. J. Jiang, X. H. Wang, X. D. Li and A. H. Wen, J. Phys. Chem. C, 2007, 111, 12603–12608 CAS.
- M. Zong, Y. Huang, H. W. Wu, Y. Zhao, Q. F. Wang and X. Sun, Mater. Lett., 2014, 114, 52–55 CrossRef CAS PubMed.
- L. Wang, Y. Huang, X. Sun, H. J. Huang, P. B. Liu, M. Zong and Y. Wang, Nanoscale, 2014, 6, 3157–3164 RSC.
- R. C. Che, L.-M. Peng, X. F. Duan, Q. Chen and X. L. Liang, Adv. Mater., 2004, 16, 401–405 CrossRef CAS.
Footnote |
| † Electronic supplementary information (ESI) available: Experimental details, Fig. S1–S4. See DOI: 10.1039/c4ra05477f |
| This journal is © The Royal Society of Chemistry 2014 |