On the large capacitance of nitrogen doped graphene derived by a facile route
M. Praveen Kumara,
T. Kesavana,
Golap Kalitab,
P. Ragupathy*a,
Tharangattu N. Narayanana and
Deepak K. Pattanayak*a
aCSIR – Central Electrochemical Research Institute, Karaikudi-630006, India. E-mail: deepak@cecri.res.in; ragupathyp@cecri.res.in
bNagoya Institute of Technology, Gokisho-cho, Nagoya-4668555, Japan
First published on 4th August 2014
Abstract
Recent research activities on graphene have identified doping of foreign atoms into the honeycomb lattice as a facile route to tailor its bandgap. Moreover, the presence of foreign atoms can act as defective centres in the basal plane, and these centres can enhance the electrochemical activities of the surface of graphene. Here, we report a facile synthetic approach towards the bulk synthesis of nitrogen doped graphene (N-Graphene) from graphene oxide using a hydrothermal process, with significant control over the extent of N-doping. The electrochemical activeness of N-Graphene (with 4.5 atomic% of nitrogen) is studied by conducting supercapacitor measurements. N-Graphene exhibits a remarkably high specific capacitance of 459 Fg−1 at a current density of 1 mA cm−2 in an electrolyte of 1 M H2SO4 with a high cycle stability compared to that of pristine graphene, which has a specific capacitance of 190 Fg−1. The structural destabilisation of graphene in higher pH/high amount alkaline treatment is demonstrated, and hence optimization of the amount of reagents is necessary in developing a graphene based high performance electronic or electrochemical devices.
1. Introduction
The development of high power and energy density supercapacitors (SCs) has become one of the prime research areas in recent energy technology.1,2 Based on the mode of charge energy storage mechanism, SCs are broadly classified into two categories (i) double layer capacitance (Electric Double Layer Capacitance (EDLC)) in which charge is stored between the electrode/electrolyte interfaces, and (ii) the faradaic process, which is responsible for charge storage in supercapacitors. However, the energy density of SCs (30 W h Kg−1) is significantly lower than that of batteries (200 W h Kg−1) and fuel cells. The relatively low specific capacitance of EDLC, in the range of 100–300 Fg−1 in an aqueous electrolyte and 100–150 Fg−1 in a non aqueous electrolyte, is not able to satisfy the energy demand of many applications.3 Thus, it is of great interest to build SCs from new materials with low cost, high capacitance and excellent cyclability. Out of the various materials used for SC applications, carbon based materials place a unique role due to the availability of various crystalline forms of carbon with relatively high conductivity and surface area.Graphene, a 2-dimensional (2D) carbon nanostructure, has attracted great interest for applications in the field of energy storage and conversion because of its unique physicochemical properties such as high surface area, excellent conductivity and mechanical strength. However, the reported capacitance values for graphene based SCs are inferior to the theoretical capacitance of single layer graphene.4 This can be due to the unavoidable curling and bundling of graphene during device fabrication, resulting in a large reduction of its active surface area. Hence, improving the capacitance of graphene materials is of great interest, many attempts have been reported, including the introduction of dopants, and the development of graphene/metal/metal oxide hybrids.5–9
Doping foreign elements such as nitrogen (N) is accepted as a simple and effective way to tailor the local electronic structure of graphene,10,11 and because of its atomic size and strong valence bonds similar to those of carbon atoms, nitrogen can be doped into the lattice of graphene – retaining its sp2 functionalization. In particular, N-doped graphene (N-Graphene) synthesized at very high temperatures (above 900 °C) will give quaternary nitrogen.12 It has been widely accepted that the manipulated local electronic structure enhances the binding phenomenon with ions,13 and hence this feature can be utilized for making high performance storage devices from doped graphene.14 To date, various methods have been reported for the synthesis of N-Graphene including chemical vapour deposition (CVD),15 nitrogen plasma process,16 electrochemical reactions,17 thermal annealing with urea,18 and solvothermal routes.19 However, vigorous reaction conditions and sophisticated instruments are the main obstacles to process scale up and increasing the N-content. On the other hand, hydrothermal methods along with reagents such as amine,20 pyrrole,21 urea,22 and hexamethylenetetramine23 as nitrogen sources have the advantage of mild reaction conditions and are easily used to prepare large quantities of N-Graphene. The reported capacitance values for N-Graphene based SCs lie in the range of 150–370 Fg−1 only (please see Table 1). Thus, it is necessary to increase the specific capacitance of N-Graphene further by controlled nitrogen doping, if possible.
| S. No. | Atomic% | Synthesis method | Capacitance (Fg−1) | Reference |
|---|---|---|---|---|
| 1 | 7.7 | Solvothermal method | 301 | 19 |
| 2 | 8.62 | Hydrothermal method | 161 | 23 |
| 3 | 12.75 | Solvothermal method | 170 | 36 |
| 4 | 2.51 | Plasma process | 280 | 34 |
| 5 | 2.77 | Hydrothermal method | 194 | 3 |
| 6 | 3.2 | Thermally exfoliated | 82 | 42 |
| 7 | 5.96 | Chemical method | 244 | 43 |
| 8 | 9.6 | Thermally exfoliation process | 248 | 44 |
Here, we report a very simple and low cost approach towards the synthesis of N-Graphene by a hydrothermal technique using ammonium hydroxide as the nitrogen source, in the presence of hydrazine hydrate as a reducing agent. The electrochemical performance of N-Graphene was investigated by cyclic voltammetry (CV) and galvanostatic charge–discharge cycling. The influence of nitrogen doping on graphene and its electrochemical performance are systematically correlated and reported.
2. Experimental section
2.1. Synthesis of N-doped graphene
Graphene oxide (GO) was synthesized following the “Improved Method” reported by Tour et al. for the synthesis of high quality GO from graphite powder.24 In this method, graphite (2 g) was thoroughly mixed with a mixture of sulfuric acid and phosphoric acid (9![[thin space (1/6-em)]](https://www.rsc.org/images/entities/char_2009.gif) :
:![[thin space (1/6-em)]](https://www.rsc.org/images/entities/char_2009.gif) 1 ratio) (Alfa aesar) at room temperature by magnetic stirring. Potassium permanganate (14 g) was slowly added to the reaction mixture. The resultant mixture was stirred, keeping the temperature at 90 °C for 24 h. Then, 14 mL of 30% H2O2 (Alfa aesar) was added to the reaction mixture, after keeping the mixture in an ice bath. The solution was subjected to vacuum filtration, and the residue washed with water, 5% HCl and ethanol for 3 cycles. The resultant solid (GO) was soaked in ether and dried in a vacuum oven at 80 °C for 24 h.
1 ratio) (Alfa aesar) at room temperature by magnetic stirring. Potassium permanganate (14 g) was slowly added to the reaction mixture. The resultant mixture was stirred, keeping the temperature at 90 °C for 24 h. Then, 14 mL of 30% H2O2 (Alfa aesar) was added to the reaction mixture, after keeping the mixture in an ice bath. The solution was subjected to vacuum filtration, and the residue washed with water, 5% HCl and ethanol for 3 cycles. The resultant solid (GO) was soaked in ether and dried in a vacuum oven at 80 °C for 24 h.
The GO (0.1 g) was dispersed in deionised water (DI) (93 mL) and 7 mL of hydrazine hydrate added to this GO solution with continuous stirring. After 2 h, ammonium hydroxide was added to the reaction mixture (the volume of ammonium hydroxide is varied from 3–10 mL in different samples to achieve different levels of doping) and the solution kept in a teflon autoclave. The autoclave was kept in an oven at 180 °C for 12 h. The residue was collected and dispersed in water and vacuum filtrated using a PTFE membrane filter paper (pore size = 0.22 μm). This residue was washed several times with DI water to make the pH ∼7. The filtrate was collected and allowed to dry at 50 °C for 24 h in an oven. The resultant powder was collected and used for the further experiments.
2.2. Physiochemical characterization
The structure, morphology and texture were characterized by powder X-ray diffraction (XRD), field emission scanning electron microscopy (FE-SEM) and transmission electron microscopy (TEM). In order to confirm the crystal structure and phase purity of the samples, powder X-ray diffraction patterns were recorded on a Bruker D 8 Advance X-ray diffractometer with Cu Kα (λ = 1.5405 Å) radiation in the range of 5–65° (2θ). Raman measurements were carried out using a Renishaw (UK) In Via Raman microscope with 632.8 nm wavelength incident laser light. The morphology and structural properties of the as-synthesized graphene and N-Graphene were investigated using a FE-SEM (Carl Zeiss, SUPRA 55VPFEI, Germany). TEM images of the samples were taken using a FEI TECNAI G220 with an accelerating voltage of 200 kV. TEM samples were prepared (by mixing DMF and the sample under sonication for 45 min) by placing a drop of the sample solution on a carbon-coated copper grid and drying under UV light. The presence of functional groups in graphene as well as N-Graphene were observed using FT-IR (BRUKER OPTIK GMBH, Germany; Model no TENSOR 27). X-ray photoelectron spectroscopy (XPS) was carried out using a PHI 5000 VersaProbe ULVAC instrument. A Schimadzu balance (model 220D) with 10 mg sensitivity was used for weighing all materials.2.3. Electrode preparation and electrochemical characterization
High-purity stainless steel foil was polished with successive grades of emery paper, cleaned with detergent, washed with DI water, rinsed with acetone and dried in air. The foil was slurry-coated with 75 wt. % N-Graphene, 20 wt. % Super P and 5 wt. % PVDF in N-methyl-2-pyrrolidone (NMP), and dried at 100 °C under vacuum for 12 h (area of coating: 1 cm2). Electrochemical studies were carried out using a PARSTAT 4000 (Princeton Applied Research, AMETEK private Ltd., Pune, India.) in a three-electrode configuration with N-Graphene as the working electrode, Pt as the counter electrode and a saturated calomel electrode (SCE) as the reference electrode. 1 M H2SO4 was used as the electrolyte. Discharge specific capacitance (SC) of N-Graphene was calculated using the formula:| SC = It/mΔE | (1) |
3. Results and discussion
Fig. 1 shows the powder XRD pattern for graphite, GO, graphene and N-Graphene prepared in different volumes of ammonium hydroxide. The (002) plane of graphite is clearly seen at a 2θ of 26.54° (JCPDS # 656212) with interlayer spacing (d value) of 0.33 nm, while that of GO is shifted from 26.54° to 11.07° indicating the increase in ‘d’ value from 0.33 nm to 0.79 nm due to the complete oxidation and exfoliation of graphite. This is in accordance with earlier reports.25 The interlayer spacing of graphene (graphene synthesized by this route) and N-Graphene are larger than that of graphite.26 The chemically reduced GO (graphene) possessed a broad peak centered at 23.87° with a corresponding d-spacing of ∼0.37 nm. However, the hydrothermally synthesized N-Graphene with various quantities of ammonium hydroxide (3 to 10 mL) showed pronounced peaks at 24.22, 25.94, 25.7 and 25.7° with corresponding interlayer spacing of 0.36, 0.34, 0.34 and 0.34 nm, respectively. The 3 mL sample showed the highest crystallinity among all the doped samples. The interlayer spacing was slightly decreased near to the graphite atomic layer (0.33 nm) with an increasing amount of ammonium hydroxide (i.e. from 3 to 10 mL), probably due to the further reduction of RGO. Moreover, it is also noticeable that increasing the amount of ammonium hydroxide also broadened the graphitic peak corresponding to the (002) plane, indicating the reduction of crystallinity, and this is in accordance with earlier reports.27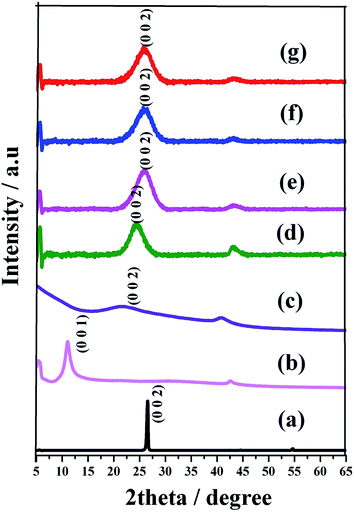 | ||
| Fig. 1 XRD pattern of (a) graphite powder (b) GO (c) graphene, (d)–(g) N-doped graphene prepared from GO and 3, 5, 7 and 10 mL of ammonium hydroxide, respectively by a hydrothermal method. | ||
Fig. 2 shows the Raman spectra of graphite, GO and N-Graphene. The two typical peaks in the graphene based materials are observed at 1348 cm−1 and 1580 cm−1 referred as the D and G bands, where the D band shows the presence of defects in the graphitic lattice with A1g symmetry, while the G band, is associated with the in-plane E2g mode of single crystalline graphitic carbon atoms in the honeycomb lattice. Generally, the ID/IG ratio provides information on the in plane crystallite dimensions, in plane and edge defects and the disorder nature of the graphene derivatives. It is well documented that the introduction of N atoms into graphene can enhance the formation of a large quantity of defects resulting in a high intensity D band due to formation of smaller nanocrystalline graphene domains by heteroatom doping.28,29 The D and G bands obtained for graphite clearly indicates the absence of disorder. As shown in Fig. 2, the significant increase in the D band of N-Graphene clearly indicates the defects and disordered structure of N-Graphene. The increase in the ID/IG band ratio from 0.95 to 1.10 in the Raman spectra is shown in Fig. 2 and indicates the increase in defects upon an increase of ammonium hydroxide content. The high ID/IG ratio of N-Graphene compared to that of pristine graphene clearly demonstrates the large structural defects and edge plane exposure caused by the insertion of heterogeneous N atoms into the graphene layers. However, there is not much change in the ID/IG ratio for various N-Graphene, possibly due to merely similar defects created during different amounts of N doping.
Fourier transform infrared (FT-IR) spectroscopy is an ideal analytical tool to identify the functional groups present in graphite, the intercalation of GO by oxidation, graphene and N-Graphene. Fig. 3 shows the typical FT-IR spectra of GO and N-Graphene prepared in different ammonium hydroxide content. Two remarkable absorption peaks obtained at 3400 and 1032 cm−1 clearly indicates the presence of absorbed water molecules and C–O groups, respectively. The GO exhibits a band at 1725 cm−1, which was assigned to the carbonyl (C![[double bond, length as m-dash]](https://www.rsc.org/images/entities/char_e001.gif) O) stretching groups. This stretching is pronounced in the GO sample due to higher degree of oxidation and the strong C–O epoxy group stretching (C–O–C) peak at 1917 cm−1, whereas GO shows broad C–O stretching bands from 1000 to 1400 cm−1, indicating the coexistence of O
O) stretching groups. This stretching is pronounced in the GO sample due to higher degree of oxidation and the strong C–O epoxy group stretching (C–O–C) peak at 1917 cm−1, whereas GO shows broad C–O stretching bands from 1000 to 1400 cm−1, indicating the coexistence of O![[double bond, length as m-dash]](https://www.rsc.org/images/entities/char_e001.gif) C–OH (carboxyl), C–O–C (epoxy), and C–OH (hydroxyl) groups. It is well known that epoxy and hydroxyl groups exhibit both edge and basal planes while carboxyl groups are mainly grafted on the edges of oxidized graphite.30 In the plane structure of GO, the peaks at 1571 and 1725 cm−1 are evident for C
C–OH (carboxyl), C–O–C (epoxy), and C–OH (hydroxyl) groups. It is well known that epoxy and hydroxyl groups exhibit both edge and basal planes while carboxyl groups are mainly grafted on the edges of oxidized graphite.30 In the plane structure of GO, the peaks at 1571 and 1725 cm−1 are evident for C![[double bond, length as m-dash]](https://www.rsc.org/images/entities/char_e001.gif) C and C
C and C![[double bond, length as m-dash]](https://www.rsc.org/images/entities/char_e001.gif) O bands. The peaks at 3004 and 3434 cm−1 correspond to C–H and O–H groups. The GO was chemically reduced by the hydrazine hydrate reduction process. After the reduction reaction, the peak at 1725 cm−1 corresponds to the weak and sharp C
O bands. The peaks at 3004 and 3434 cm−1 correspond to C–H and O–H groups. The GO was chemically reduced by the hydrazine hydrate reduction process. After the reduction reaction, the peak at 1725 cm−1 corresponds to the weak and sharp C![[double bond, length as m-dash]](https://www.rsc.org/images/entities/char_e001.gif) O stretching groups. The GO has been successfully reduced by hydrazine hydrate to obtain graphene. In N-Graphene, the nitrogen atoms replace carbon atoms. The peaks appearing at 1187 and 1571 cm−1 in N-Graphene correspond to the strong and sharp peaks of C–N and C
O stretching groups. The GO has been successfully reduced by hydrazine hydrate to obtain graphene. In N-Graphene, the nitrogen atoms replace carbon atoms. The peaks appearing at 1187 and 1571 cm−1 in N-Graphene correspond to the strong and sharp peaks of C–N and C![[double bond, length as m-dash]](https://www.rsc.org/images/entities/char_e001.gif) C stretching bonds, respectively (Fig. 3).
C stretching bonds, respectively (Fig. 3).
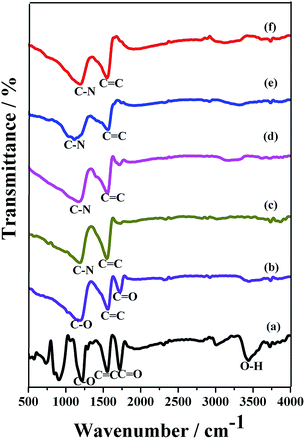 | ||
| Fig. 3 FT-IR spectra of (a) GO (b) Graphene, (c)–(f) N-doped graphene prepared from GO and 3, 5, 7 and 10 mL of ammonium hydroxide, respectively by a hydrothermal method. | ||
FE-SEM images of graphite, GO, graphene (GN) and N-Graphene are shown in Fig. 4. The graphite powder was composed of number of flake-like layers (Fig. 4a). However, after the oxidation process, these graphite layers were exfoliated and subsequently intercalated by epoxy, carboxyl and hydroxyl functional groups. The GN maintained its two dimensional sheet-like structures as seen in the FE-SEM image (Fig. 4b). The crystalline structure and transparency of the sheets are clearly maintained in N-Graphene 3 mL and N-Graphene 5 mL (Fig. 4c and d). Surprisingly, upon increasing the amount of ammonium hydroxide solution, the morphology of the N-Graphene sheets aggregated during the hydrothermal process and is shown in Fig. 4e and f.
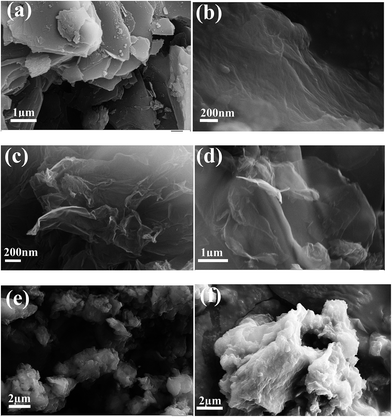 | ||
| Fig. 4 FE-SEM images of (a) graphite powder, (b) graphene and (c)–(f) N-doped graphene prepared from GO and 3, 5, 7 and 10 mL of ammonium hydroxide, respectively by a hydrothermal method. | ||
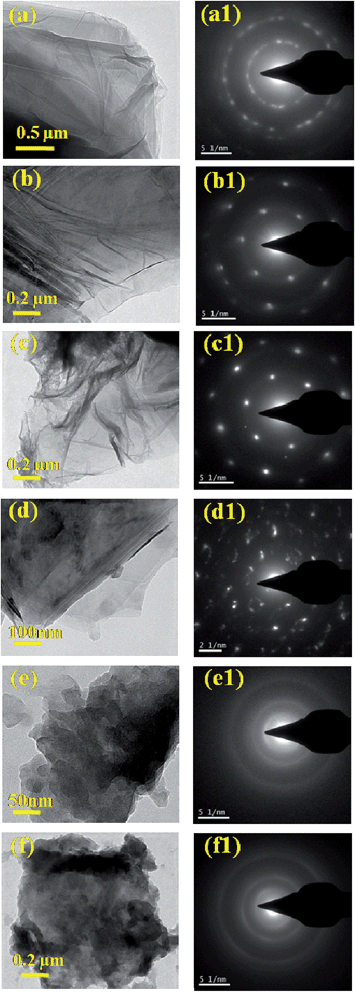
The TEM image of the GO sheet is shown in Fig. 5a and the corresponding Selected Area Electron Diffraction (SAED) pattern is shown in Fig. 5a1. After reduction, a single transparent sheet of GN was observed and is shown in the TEM image (Fig. 5b), and hexagonal rings directly visualized in the SAED pattern, while N-Graphene appeared like a crumpled sheets as observed in Fig. 5c. The morphology of N-Graphene was destroyed upon increasing the amount of ammonium hydroxide (>3 mL), and the TEM and corresponding SAED (Fig. 5d–f) patterns show their amorphous nature, indicating the structural distortion.
N-Graphene was prepared using ammonium hydroxide solution at different volumes (3–10 mL) by a hydrothermal method. XPS studies confirmed the presence of nitrogen doping in the GN sheets and are shown in Fig. 6. The XPS results show that with an increase in the amount of ammonium hydroxide from 3 to 10 mL, the amount of N-doping decreased and is shown in Fig. 6. The percentage of nitrogen incorporated into the GN sheets was found to be highest at 4.5 atomic% for 3 mL of ammonium hydroxide solution and decreased to 0.9 to 3.0 atomic% when the amount of ammonium hydroxide was increased as shown in Table 2. The increase in pH as seen in Table 2 indicates that the high alkaline environment is not advantageous for nitrogen content.31,32 Fig. 6a shows the survey scan of N-Graphene (3 mL) and it can be seen that the peaks observed at 284.7, 401 and 532.5 eV correspond to C1s, N1s and O1s, respectively. The high resolution of N1s scanning spectrum was deconvoluted into four individual components: pyridinic like N, pyrrolic like N, graphitic like N and pyridinic oxide like N observed at 399.3, 400.1, 401 and 402.2 and 403 eV, respectively (Fig. 6(ii)). Fig. 6(i) shows the high resolution C1s of 3 mL N-Graphene after deconvolution into three components, namely, C–N, C–O and C![[double bond, length as m-dash]](https://www.rsc.org/images/entities/char_e001.gif) O corresponding to the peaks observed at 285.9, 286.9 and 288.7 eV, respectively. The electrochemical performance depends on the edge defects on the graphene sheet, like the presence of pyridinic N-Graphene.33 Here, the percentage of pyridinic N was very low compared to that of pyrrolic and graphitic N. However, the high specific capacitance obtained in the present study is possibly due to the presence of various N-functionalities. The electrocatalytic activity of N-Graphene was found to be dependent on the graphitic N-content, which determines the limiting current density,34 while pyridinic N contributes to the major part of capacitance increment in N-Graphene among the various N-configurations.35 Further, increasing the volume of ammonium hydroxide leads to a change in the microstructure (interplanar spacing due to reduction) as well as the crystallinity of the GN (affected adversely as it is seen from the TEM and SAED studies), which also affect the electrochemical performance of N-Graphene. The limiting current density proceeds the maximum current density to achieve a desired electrode reaction before hydrogen or other extraneous ions are discharged simultaneously and also without undue interference such as that from polarization. The high resolution of O1s was obtained at 532 eV (Fig. 6(iii)).
O corresponding to the peaks observed at 285.9, 286.9 and 288.7 eV, respectively. The electrochemical performance depends on the edge defects on the graphene sheet, like the presence of pyridinic N-Graphene.33 Here, the percentage of pyridinic N was very low compared to that of pyrrolic and graphitic N. However, the high specific capacitance obtained in the present study is possibly due to the presence of various N-functionalities. The electrocatalytic activity of N-Graphene was found to be dependent on the graphitic N-content, which determines the limiting current density,34 while pyridinic N contributes to the major part of capacitance increment in N-Graphene among the various N-configurations.35 Further, increasing the volume of ammonium hydroxide leads to a change in the microstructure (interplanar spacing due to reduction) as well as the crystallinity of the GN (affected adversely as it is seen from the TEM and SAED studies), which also affect the electrochemical performance of N-Graphene. The limiting current density proceeds the maximum current density to achieve a desired electrode reaction before hydrogen or other extraneous ions are discharged simultaneously and also without undue interference such as that from polarization. The high resolution of O1s was obtained at 532 eV (Fig. 6(iii)).
| S. No. | NH4OH amount | Atomic% | pH value |
|---|---|---|---|
| 1 | 3 mL | 4.5 | 11 |
| 2 | 5 mL | 0.9 | 11.30 |
| 3 | 7 mL | 1.7 | 12 |
| 4 | 10 mL | 3.0 | 12.30 |
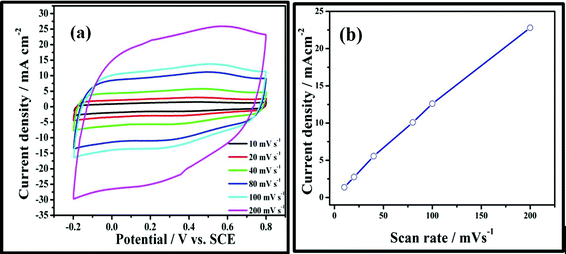
Cyclic voltammetry (CV) and galvanostatic charge–discharge cycling are recognized to be ideal experimental techniques to evaluate the supercapacitive behavior of any materials.1,2 Fig. 7a shows the CV curves of N-Graphene recorded at different scan rates ranging from 10 to 200 mV s−1 in an aqueous solution of 1 M H2SO4 within a potential window from −0.2 to 0.8 V vs. SCE. The rectangular shapes of the voltammograms exhibit a mirror image of the cathodic and anodic parts, indicating ideal capacitor behaviour of pristine and N-Graphene. As the sweep rate increases, the voltammetric current increases, indicating better rate capability and reversibility. Fig. 7b shows the linear variation of current density with scan rate revealing the surface adsorption–desorption process.
The typical galvanostatic charge–discharge curves recorded for N-Graphene are shown in Fig. 8 at a current density of 1 mA cm−2. The linear variation of potentials with time is additional finger print evidence for capacitive behaviour.1,2 The highly symmetrical charge–discharge curves indicate excellent electrochemical reversibility during the charge–discharge process. The specific capacitance of N-Graphene (3 mL ammonium hydroxide) was found to be 459 Fg−1 at a current density of 1 mA cm−2, which is several times higher than that of GN materials and also much larger than the N-Graphene materials previously reported.19,35,36 Moreover, the specific capacitance value of N-Graphene obtained in the present method is even comparable to those of metal oxide/graphene and polymer/graphene materials.37–41 The specific capacitance values for the various types of N sources for N doping used in the literature and the reported values are shown in Table 1. Fig. 8 shows the variation in specific capacitance as a function of N doping and the volume of ammonium hydroxide. The literature indicates that the specific capacitance is drastically affected by the amount of N-doping in graphene.31 But, increasing the amount of ammonium hydroxide will also affect the structure of GN as it is observed from TEM and SAED data (Fig. 5).
A drastic drop in the capacitance value was observed when the amount of ammonium hydroxide increased from 3 mL to 5 mL and may be due to the structural distortion, and also due to the lowering the amount of nitrogen to 0.9 atomic% from 4.5 atomic%. But further increase in the amount of ammonia solution increases the amount of nitrogen, and hence, though the structural distortion happened, the amount of nitrogen was increased from 0.9% to 1.7 atomic% when the ammonia solution is increased from 5 mL to 7 mL. Again, an increase in ammonia from 7 mL to 10 mL completely amorphized the graphitic backbone and hence though the amount of nitrogen was increased, its capacitance value was decreased. Moreover, out of the various nitrogen functionalities, it is reported that pyridinic nitrogen is contributing to the supercapacitance of the resultant doped structure.35 The capacitance variation follows the same trend as that of the percentage of pyridinic nitrogen (inferred from the XPS measurements) present in the samples. This is also in accordance with earlier reports.35
In order to understand the rate capability of N-doped graphene, galvanostatic charge–discharge curves were recorded at different current densities ranging from 1 to 20 mA cm−2. Fig. 9 shows the specific capacitance of N-Graphene (3 mL) as a function of current density. The specific capacitance values of N-Graphene (3 mL) were calculated to be 459, 242, 209, 186 and 186 Fg−1 at 1, 2, 5, 10 and 20 mA cm−2, respectively. The improved specific capacitance of N-Graphene (3 mL) was well maintained even at higher current densities. For instance, a specific capacitance of 186 Fg−1 could be retained even at 20 mA cm−2 current density indicating that the N-doping does not lead to any deterioration from the original power capability of graphene.36
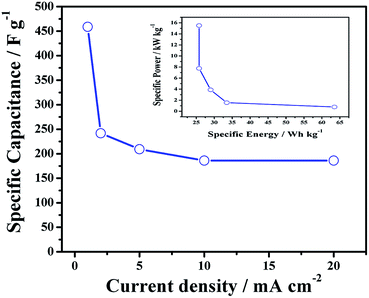 | ||
| Fig. 9 Specific capacitance vs. current density, and Ragone plot for N-doped graphene prepared from 3 mL of ammonium hydroxide solution is shown as an inset. | ||
Evaluation of supercapacitors in terms of specific power (SP) and specific energy (SE) is of practical interest. The values of SP and SE were calculated using the equations shown below:
 | (2) |
 | (3) |
The inset in Fig. 9 shows a Ragone plot for the N-Graphene electrodes. It was observed that the SE decreases with increasing SP. The SE values are high, at 25.8–63.5 W h kg−1, while the SP values are in the range 0.7–15.5 kW kg−1.
Hence, in the present investigation on N-Graphene synthesised using an ammonium hydroxide solution by a hydrothermal method indicates the presence of a large amount of graphitic and pyrrolic nitrogen in the graphene sheets (schematic, Fig. 6d). XPS results further suggest that the amount of N doping reached its highest for 3 mL ammonium hydroxide treated GO, and further increases in the ammonium hydroxide did not help to improve the nitrogen content in graphene. But instead, a large amount of ammonium hydroxide destabilised the structure of graphene (as evident from TEM images in Fig. 5e and f and the XRD results in Fig. 1), and the amount of nitrogen was also drastically reduced. This is in accordance with the earlier reports,31,32 which question the stability of graphene under alkaline treatment. Hence, it has to be concluded that, the highest level of N-doping achieved in this method is ∼4.5 atomic%, and this contributed to the highest ever reported capacitance value of ∼459 Fg−1 for N-Graphene.
4. Conclusions
A simple and effective route towards the synthesis of N-Graphene by a one-step hydrothermal process using ammonium hydroxide as the nitrogen source that achieved 4.5 atomic% of N-doping has been reported. The N1S spectrum showed the presence of pyridinic, pyrrolic, graphitic and pyridinic oxide nitrogen atoms in the doped graphene structure. The improvement in the electrochemical activities via doping was studied using supercapacitor measurements, and these studies showed the highest value (459 Fg−1) ever reported for N-Graphene.Acknowledgements
M. Praveen Kumar and Deepak K. Pattanayak thank CSIR, India for financial support through MULTIFUN (CSC 0101). Central Instrument Facility (CIF) staff Mr A. Rathish Kumar (TEM in charge), CSIR-CECRI, Karaikudi for taking TEM images is greatly appreciated.References
- B. E. Conway, Electrochemical supercapacitors, Scientific fundamentals and technological applications, Kluwer Academic/Plenum publishers, New York, 1999 Search PubMed.
- S. Sarangapani, B. V. Tilak and C. P. Chen, J. Electrochem. Soc., 1996, 143, 3791 CrossRef CAS PubMed.
- F. M. Hassan, V. Chabot, J. Li, B. K. Kim, L. R. Sandoval and A. Yu, J. Mater. Chem. A, 2013, 1, 2904–2912 CAS.
- Y. Zhu, S. Murali, M. D. Stoller, K. J. Ganesh, W. Cai, P. J. Ferreira, A. Pirkle, R. M. Wallace, K. A. Cychosz, M. Thommes, D. Su, E. A. Stach and R. S. Ruoff, Science., 2011, 332, 1537–1541 CrossRef CAS PubMed.
- W. Deng, X. Ji, Q. Chen and C. E. Banks, RSC Adv., 2011, 1, 1171–1178 RSC.
- G. Zhou, D. W. Wang, F. Li, L. Zhang, N. Li, Z. S. Wu, L. Wen, G. Q. (Max) Lu and H. M. Cheng, Chem. Mater., 2010, 22, 5306–5313 CrossRef CAS.
- Z. S. Wu, D. W. Wang, W. Ren, J. Zhao, G. Zhou, F. Li and H. M. Cheng, Adv. Funct. Mater., 2010, 20, 3595–3602 CrossRef CAS PubMed.
- L. Lai, H. Yung, L. Wang, B. K. Tec, J. Zhong, H. Chou, L. Chen, W. Chen, Z. Shen, R. S. Ruoff and J. Lin, ACS Nano, 2012, 6, 5941–5951 CrossRef CAS PubMed.
- H. Gomez, M. K. Ram, F. Alvi, P. Villalba, E. (Lee) Stefanakos and A. Kumar, J. Power Sources, 2011, 196, 4102–4108 CrossRef CAS PubMed.
- B. Biel, X. Blase, F. Triozon and S. Roche, Phys. Rev. Lett., 2009, 102, 096806 CrossRef.
- S. F. Huang, K. Terakura, T. Ikeda, M. Boero, M. Oshima and J. Miyata, Phys. Rev. B: Condens. Matter Mater. Phys., 2009, 80, 235410 CrossRef.
- Y. Zheng, Y. Jiao, L. Ge, M. Jaroniec and S. Z. Qiao, Angew. Chem., 2013, 125, 3192–3198 CrossRef PubMed.
- L. L. Zhang, X. Zhao, H. Ji, M. D. Stoller, L. Lai, S. Murali, S. Mcdonnell, B. Cleveger, R. M. Wallace and R. S. Ruoff, Energy Environ. Sci., 2012, 5, 9618–9625 CAS.
- B. Mortazavi, S. Ahli, V. Toniazzo and Y. Remond, Phys. Lett. A, 2012, 376, 1146–1153 CrossRef CAS PubMed.
- Y. Xue, B. Wu, L. Jiang, Y. Guo, L. P. Huang, J. Chen, J. Tan, D. Geng, B. Luo, W. Hu, G. Yu and Y. Lui, J. Am. Chem. Soc., 2012, 134, 11060–11063 CrossRef CAS PubMed.
- C. Wang, Y. Zhou, L. He, T. W. Ng, G. Hong, Q. H. Wu, F. Gao, C. S. Lee and W. Zhang, Nanoscale, 2013, 5, 600–605 RSC.
- X. Wang, X. Li, L. Zhang, Y. Yoon, P. K. Weber, H. Wang, J. Guo and H. Dai, Science, 2009, 324, 768 CrossRef CAS PubMed.
- Z. Lin, G. Waller, Y. Liu, M. Liu and C. P. Wong, Adv. Energy Mater., 2012, 2, 884–888 CrossRef CAS PubMed.
- Y. Lu, F. Zhang, T. Zhang, K. Leng, L. Zhang, X. Yang, Y. Ma, Y. Huang, M. Zhang and Y. Chen, Carbon, 2013, 63, 508–516 CrossRef CAS PubMed.
- P. Chen, J. J. Yang, S. S. Li, Z. Wang, T. Y. Xiao, Y. H. Qian and S. H. Yu, Nano Energy, 2013, 2, 249–256 CrossRef CAS PubMed.
- Y. Zhao, C. Hu, H. Cheng, G. Shi and L. A. Qu, Angew. Chem., Int. Ed., 2012, 51, 11371–11375 CrossRef CAS PubMed.
- L. Sun, L. Wang, C. Tain, Y. Xie, K. Shi, M. Li and H. Fu, RSC Adv., 2012, 2, 4498–4506 RSC.
- J. W. Lee, J. M. Ko and J. D. Kim, Electrochim. Acta, 2012, 85, 459–466 CrossRef CAS PubMed.
- D. C. Marcano, D. V. Kosynkin, J. M. Berlin, A. Sinitskii, Z. Sun, A. Slesarev, L. B. Alemany, W. Lu and J. M. Tour, ACS Nano, 2010, 4(8), 4806–4814 CrossRef CAS PubMed.
- S. Seo, Y. Yoon, J. Lee, Y. Park and H. Lee, ACS Nano, 2013, 7(4), 3607–3615 CrossRef CAS PubMed.
- D. Geng, Y. Songlan, Y. Zhang, J. Yang, J. Liu, R. Li, T. K. Sham, X. Sun, S. Ye and S. Knights, Appl. Surf. Sci., 2011, 257, 9193–9198 CrossRef CAS PubMed.
- B. X. Fan, W. Peng, Y. Li, X. Li, S. Wang, G. Zhang and F. Zhang, Adv. Mater., 2008, 20, 4490–4493 CrossRef PubMed.
- B. P. Vinayan, R. Nagar and S. Ramaprabhu, J. Mater. Chem., 2012, 22, 25325–25334 RSC.
- M. A. Pimenta, G. Dresselhaus, M. S. Dresselhaus, L. G. Cancado, A. Jorioa and R. Saitoe, Phys. Chem. Chem. Phys., 2007, 9, 1276–1291 RSC.
- M. Acik, G. Lee, C. Mattevi, A. Pirkle, R. M. Wallace, M. Chhowalla, K. Cho and Y. Chabal, J. Phys. Chem. C, 2011, 115, 19761–19781 CAS.
- L. Lai, L. Chen, D. Zhan, L. Sun, J. Liu, S. H. Lim, C. K. Poh, Z. Shen and J. Lin, Carbon, 2011, 49, 3250–3257 CrossRef CAS PubMed.
- M. Seredych and T. J. Bandosz, J. Phys. Chem. C, 2007, 111, 15596–15604 CAS.
- Z. Luo, S. Lim, Z. Tian, J. Shang, L. Lai, B. MacDonald, C. Fu, Z. Shen, T. Yu and J. Lin, J. Mater. Chem., 2011, 21, 8038–8044 RSC.
- L. Lai, J. R. Potts, D. Zhan, L. Wang, C. K. Poh, C. Tang, H. Gong, Z. Shen, J. Lin and R. S. Ruoff, Energy Environ. Sci., 2012, 5, 7936–7942 CAS.
- H. Cao, X. Zhou, Z. Qin and Z. Liu, Carbon, 2013, 56, 218–223 CrossRef CAS PubMed.
- H. M. Jeong, J. W. Lee, W. H. Shin, Y. J. Choi, H. J. Shin, J. K. Kang and J. W. Choi, Nano Lett., 2011, 11, 2472–2477 CrossRef CAS PubMed.
- H. Wang, Q. Hao, X. Yang, L. Lu and X. Wang, Electrochem. Commun., 2009, 11, 1158–1161 CrossRef CAS PubMed.
- J. Xu, K. Wang, S. Z. Zu, B. H. Han and Z. Wei, ACS Nano, 2010, 4, 5019–5026 CrossRef CAS PubMed.
- Q. Wu, Y. Xu, Z. Yao, A. Liu and G. Shi, ACS Nano, 2010, 4, 1963–1970 CrossRef CAS PubMed.
- Y. Munaiah, B. G. S. Raj, T. Prem Kumar and P. Ragupathy, J. Mater. Chem. A, 2013, 1, 4300–4306 CAS.
- M. Ashokkumar, T. N. Narayanan, A. L. Mohana Reddy, B. K. Gupta, B. Chandrasekaran, S. Talapatra, P. M. Ajayan and P. Thanikaivelan, Green Chem., 2012, 14, 1689–1695 RSC.
- C. Wang, Y. Zhou, L. Sun, Q. Zhao, X. Zhang, P. Wan and J. Qiu, J. Phys. Chem. C, 2013, 117, 14912–14919 CAS.
- P. Wang, H. He, X. Xu and Y. Jin, ACS Appl. Mater. Interfaces, 2014, 6, 1563–1568 CAS.
- Z. Wen, X. Wang, S. Mao, Z. Bo, H. Kim, S. Cui, G. Lu, X. Feng and J. Chen, Adv. Mater., 2012, 24, 5610–5616 CrossRef CAS PubMed.
| This journal is © The Royal Society of Chemistry 2014 |


