Performance and emission analysis of a multi cylinder gasoline engine operating at different alcohol–gasoline blends
B. M. Masum*,
M. A. Kalam*,
H. H. Masjuki,
S. M. Palash and
I. M. Rizwanul Fattah
Department of Mechanical Engineering, Centre for Energy Sciences, Faculty of Engineering, University of Malaya, 50603, Kuala Lumpur, Malaysia. E-mail: masum05me@gmail.com; kalam@um.edu.my; masjuki@um.edu.my; mpsalium@gmail.com; rizwanulfattah@gmail.com; Fax: +60 3 79675317; Tel: +60 3 79674448
First published on 16th June 2014
Abstract
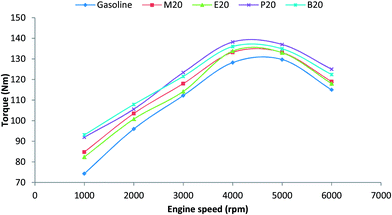
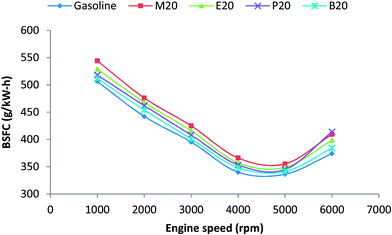
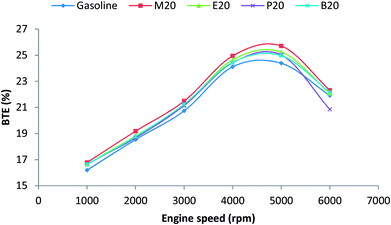
Alcohols are potential renewable alternatives for gasoline because of their bio-based origin. Although ethanol has been successfully implemented in many parts of the world, other alcohols may also be utilized, such as methanol, propanol, and butanol. These alcohols contain much energy and a high octane number. Furthermore, they displace petroleum. Therefore, this study focuses on methanol, ethanol, propanol, and butanol as gasoline fuel alternatives. We conducted tests in a four-cylinder gasoline engine under the wide open throttle condition at varying speeds and results. This engine was fueled with 20% methanol–80% gasoline (M20), 20% ethanol–80% gasoline (E20), 20% propanol–80% gasoline (P20), and 20% butanol–80% gasoline (B20). M20, E20, P20, and B20 displayed brake specific fuel consumptions levels and break thermal efficiencies that were higher than those of gasoline at 7.78%, 5.17%, 4.43%, and 1.95% and 3.6%, 2.15%, 0.7%, and 1.86%, respectively. P20 and B20 showed better torque than E20, but they consumed more fuel. Moreover, the alcohol–gasoline blends generated a higher peak in-cylinder pressure than pure gasoline. As gasoline fuel alternatives, propanol and butanol were more effective than gasoline in engines. In addition, the alcohol–gasoline blends also emitted less carbon monoxide and hydrocarbon than gasoline. However, E20 emitted more nitrogen oxide than the other alcohol–gasoline blends. Thus, propanol and butanol are more effective options than ethanol for a gasoline engine in terms of fuel properties, engine performance, and emissions.
Introduction
For researchers and manufacturers in the field of energy, the replacement of petroleum gasoline with alternative fuels is an important issue given rising petroleum fuel prices, environmental threats from engine exhaust emissions, fossil fuel depletion, the effects of global warming, and energy concerns.1 Global energy consumption has increased sharply recently, and it will increase by approximately 53% by 2030, according to the International Energy Agency.2 The United States Energy Information Administration projects that the liquid fuel consumption in the world will increase from 86.1 million barrels per day to 110.6 million barrels per day by 2035.3 Furthermore, the burning of petroleum-derived fuel generates emissions that seriously affect both the environment and human health. In particular, the burning of fossil fuels is a main contributor to the increase in carbon dioxide (CO2) emissions, which in turn aggravates global warming. If fossil fuel emissions are not strictly regulated soon, greenhouse gas (GHG) emissions from fossil fuels will increase by 39% by 2030. Hence, alternative fuel sources for clean combustion have received increased attention given several factors, such as worldwide environmental concerns, price hikes in petroleum products, and the expected depletion of fossil fuels.4 Therefore, the development of clean alternative fuels that are locally available, environmentally acceptable, and technically feasible is a global concern. In the transport sector, biofuels can be a good substitute for fossil fuels because they can be adopted directly without altering the engine and fuelling processes.The use of alcohols as substitutes for petrol in spark ignition (SI) engines has been investigated extensively. These alcohols enrich oxygen, enhance octane, and reduce carbon monoxide (CO) emission. As an alternative fuel, ethanol is the most widely used alcohol type.5 It can be combined with gasoline because of its simple chemical structure, high octane number and oxygen content, and accelerated flame propagation.6 Many experimental studies have confirmed that ethanol increases engine efficiency, torque, and power. However, its brake specific fuel consumption (BSFC) is higher than that of gasoline.7
Balki et al.8 studied the performance, combustion, and emission characteristics of a single-cylinder gasoline engine fuelled by gasoline, ethanol, and methanol. Pure ethanol and methanol enhanced torque by 3.7% and 4.7%, at the expense of a 58% and 84% increase in BSFC, respectively, compared with those of gasoline fuel. Nitrogen oxide (NOx), CO, and hydrocarbon (HC) emissions by engines containing methanol and ethanol decreased by 49% and 47.6%, 22.6% and 21.25%, and 21.6% and 19.13%, respectively, compared with those emitted by gasoline. However, CO2 emissions increased by 4.4% and 2.51%. Costa and Sodré9 investigated the performance and emission of hydrous ethanol (6.8% water content) and a blend of 78% gasoline–22% ethanol (E22) at varying speeds. Hydrous ethanol displayed a higher break thermal efficiency (BTE) and BSFC than E22 throughout the entire speed range. However, torque and break mean effective pressure increased with engine speed. Moreover, hydrous ethanol reduced CO and HC emissions but increased CO2 emissions. Koç et al.7 experimentally investigated the performance and pollutant emissions of unleaded gasoline–ethanol blends. The torque and BSFC values of E50 and E85 were higher than those of gasoline by 2.3% and 2.8% and 16.1% and 36.4%, respectively. Moreover, the addition of ethanol to gasoline significantly reduced CO, HC, and NOx emissions. Ethanol–gasoline blends also accommodated high compression ratios without inducing knocking.
In many countries, governments mandate the integration of ethanol with gasoline. The Environmental Protection Agency (EPA) issued a waiver that authorizes the incorporation of up to 15% ethanol into gasoline for cars and light pickup trucks made in 2001 onwards.10 The US Renewable Fuel Standard mandates the production of up to 36 billion gallons of ethanol and advanced bio-fuels by 2022.11 To meet the high demand for ethanol, alcohols with increased carbon numbers can be utilized as enhanced alternatives because the use of ethanol as fuel in gasoline engines is mainly limited by its low heating value (LHV). Hence, additional low-LHV fuel must be generated to match a certain power level.12 Alcohols with high carbon numbers, such as propanol and butanol, have a higher LHV than ethanol. Therefore, they can overcome this shortcoming. Furthermore, all of these alcohols can be derived from coal-derived syngas, which is a renewable energy source.13 Ethanol can also be converted into alcohols with high carbon numbers and fermented to enhance alcohol production through biorefinery.14
Some studies have compared different alcohol–gasoline blends. Gravalos et al.15 integrated approximately 1.9% methanol, 3.5% propanol, 1.5% butanol, 1.1% pentanol, and variable concentrations of ethanol with gasoline in a single-cylinder gasoline engine. A total of 30% alcohol was incorporated into the gasoline. The alcohol–gasoline blend emitted less CO and HC but more NOx and CO2 than pure gasoline. In the present study, multiple alcohol–gasoline blends also emit more acceptable levels of CO and HC than the ethanol–gasoline blend. Yacoub et al.16 integrated methanol, ethanol, propanol, butanol, and pentanol with gasoline in an engine and analyzed its performance and emissions. Each alcohol was blended with gasoline containing 2.5% and 5% oxygen. The alcohol–gasoline blend displayed better BTE, knock resistance, and emissions than gasoline, but its BSFC was higher. Alcohols with low carbon content (e.g. C1, C2, and C3) contain high levels of oxygen. Hence, relatively less of these alcohols is required to reach the targeted oxygen percentage than alcohols with high carbon content (e.g., C4 and C5). Alcohol percentage and properties varied across blends. Thus, different alcohol–gasoline blends cannot be compared properly under optimized oxygen concentrations. Gautam et al.17 prepared six alcohol–gasoline blends with various proportions of methanol, ethanol, propanol, butanol, and pentanol that total 10% alcohol. The alcohol–gasoline blends emitted lower brake specific CO, CO2, and NOx than pure gasoline. However, these researchers did not blend specific volume percentages of alcohol or consider fuel properties.
Thus, few studies compare specific percentages of alcohols, such as methanol, ethanol, propanol and butanol, with respect to performance and emission characteristics in the gasoline of an SI engine. Moreover, very few studies focus on the partial replacement of gasoline with propanol as an SI engine fuel. Nonetheless, the derivation of alcohols with high carbon numbers from renewable sources has increasingly been investigated.18–22 In particular, the application of such alcohols as gasoline engine fuel must be examined extensively. Thus, this research aims to determine the effect of methanol–gasoline, ethanol–gasoline, propanol–gasoline, and butanol–gasoline blends on engine performance, combustion, and exhaust emissions. The results obtained with these blends are compared with those of gasoline and the commonly used ethanol–gasoline blend in gasoline engines.
Materials and method
Fuel selection
In this study, we utilized methanol, ethanol, and branched isomers of propanol and butanol (99.8% purity) given their high octane numbers. We procured the ethanol from Chemical Industries (Malaya) Sdn Bhd., Malaysia and the other alcohols from QREC Chemical Company, Thailand. We obtained Primax 95 gasoline with research octane number (RON) 95 from PETRONAS, Malaysia as the base gasoline. We blended methanol, ethanol, propanol, and butanol with gasoline (M20, E20, P20, and B20, respectively) at volume concentrations of 20% alcohol and 80% gasoline. Table 1 lists the properties of the gasoline and the alcohol–gasoline blends.| Property | Unit | Gasoline | M20 | E20 | P20 | B20 |
|---|---|---|---|---|---|---|
| a Here, LHV = lower heating value, ROM = research octane number, RVP = Reid vapor pressure, LoV = latent heat of vaporization. | ||||||
| Oxygen | wt% | 0 | 9.99 | 6.94 | 5.32 | 4.32 |
| Density (at 15 °C) | kg m−3 | 736.8 | 743.82 | 748.3 | 747.32 | 750.64 |
| LHV | MJ kg−1 | 43.919 | 39.434 | 40.799 | 41.725 | 42.273 |
| RON | — | 95 | 98.7 | 99.735 | 100.81 | 97.95 |
| RVP (at 37.8 °C) | kPa | 63.9 | 55.2 | 67.7 | 58.9 | 55.5 |
| LoV | kJ kg−1 | 349 | 1178 | 923 | 761 | 683 |
| Specific gravity (at 15 °C) | — | 0.7375 | 0.7967 | 0.795 | 0.7899 | 0.8067 |
| Dynamic viscosity (at 20 °C) | mPa s | 0.516 | 0.521 | 0.629 | 0.802 | 0.925 |
Experimental setup
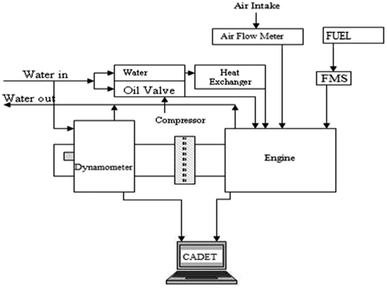
We experimented on a four-cylinder gasoline engine at the Engine Laboratory of the Mechanical Engineering Department in the University of Malaya. Table 2 details the engine, and Fig. 1 depicts the schematic of the experimental setup. The test engine was coupled with an eddy current dynamometer (Froude Hofmann model AG150, United Kingdom) with a maximum power of 150 kW. The engine was first operated on gasoline for a few minutes to stabilize the operating condition. The fuel was then changed to the alcohol blend. After sufficient amounts of the blend were consumed, data were acquired to ensure the removal of residual gasoline from the fuel line. Each test engine was again operated under gasoline to drain all of the blends in the fuel line.| Engine parameter | Value |
|---|---|
| Number of cylinder | 4 |
| Displacement volume | 1596 cm3 |
| Bore | 78 mm |
| Stroke | 84 mm |
| Connecting rod length | 131 mm |
| Compression ratio | 10![[thin space (1/6-em)]](https://www.rsc.org/images/entities/char_2009.gif) : :![[thin space (1/6-em)]](https://www.rsc.org/images/entities/char_2009.gif) 1 1 |
| Fuel system | Multi-point electric port fuel system |
| Max output (at rpm) | 78 kW at 6000 rpm |
| Max torque (at rpm) | 135 Nm at 4000 rpm |
The engine was operated between 1000 rpm to 6000 rpm with a step of 1000 rpm at 100% load condition. We measured fuel flow using a KOBOLD ZOD positive-displacement type flow meter (KOBOLD, Germany). The data were automatically collected using the CADET 10 data acquisition system. To analyze combustion, we applied a pressure sensor and crank angle encoder (RIE-360). Both sensors vary the in-cylinder pressure at a crank angle. The data were digitally recorded by a computer using the DEWESoft combustion analyzer software. Exhaust emissions were measured using the AVL DICOM 4000 exhaust gas analyzer (AVL DiTEST, Austria), where CO, NO, and HC are determined by non-dispersive infrared, heated chemiluminescence, and heated flame ionization detectors. Table 3 exhibits the accuracies of the measured parameters. In each test, performance and emission were measured in triplicate. These measurements were highly repeatable within the test series.
| Measurement range | Detection limit | |
|---|---|---|
| CO | 0–10 vol% | 0.01 vol% |
| CO2 | 0–20 vol% | 0.1 vol% |
| HC | 0–20![[thin space (1/6-em)]](https://www.rsc.org/images/entities/char_2009.gif) 000 ppm vol 000 ppm vol |
1 ppm |
| NOx | 0–5![[thin space (1/6-em)]](https://www.rsc.org/images/entities/char_2009.gif) 000 ppm vol 000 ppm vol |
1 ppm |
| O2 | 0–25 vol% | 0.01 vol% |
Results and discussion
Engine performance analysis
Engine emission analysis
Conclusion
This study mainly compares the performance, combustion, and emission characteristics of M20, E20, P20, and B20 as engine fuels. Based on experimental observation, we can draw the following conclusions:• Alcohol–gasoline blends displayed better engine torque and BTE than gasoline. Torque was also enhanced in alcohol blends with high carbon numbers compared with those with low carbon numbers given their improved fuel properties such as RON, LHV etc. In particular, P20 exhibits the best torque and BTE among all of the fuels. Moreover, the BSFC levels of P20 and B20 are more acceptable than that of E20 at 1.21% and 3.06% because of their high LHV.
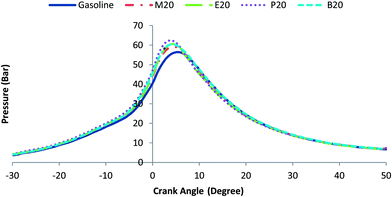
• In-cylinder gas pressure increases earlier in all alcohol–gasoline blends that in gasoline fuel because of the high flame speed of alcohol. Furthermore, the combustion duration of alcohol–gasoline blends was shorter than that of gasoline. Peak in-cylinder pressure was also higher for alcohol–gasoline blends (particularly the P20 blend) than for pure gasoline.
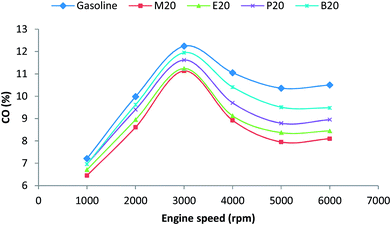
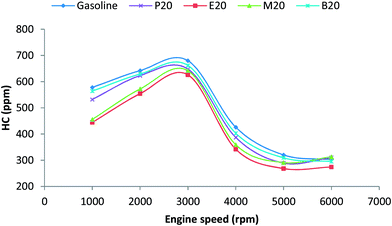
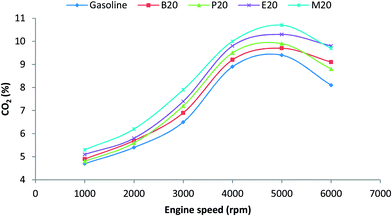
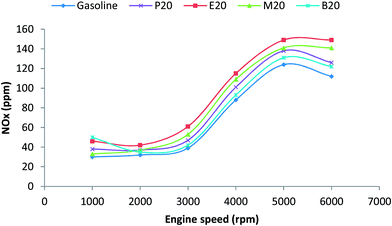
• All alcohol–gasoline blends emitted less CO and HC than gasoline. Specifically, E20 emitted the lowest amount. However, these blends emitted more NOx and CO2 than gasoline. Moreover, P20 and B20 emitted 5–6% less NOx and 11–14% less CO2 than E20. Thus, alcohol–gasoline blends are more environment-friendly than gasoline.
• In general, the fuel properties of P20 and B20 were superior to the other alcohol–gasoline blends. Furthermore, these blends enhanced engine performance and lowered emissions more effectively than the ethanol–gasoline blend in an unmodified gasoline engine.
Acknowledgements
The authors would like to appreciate University of Malaya for financial support through Research Grant no. CG 060-2013 and High Impact Research grant titled: Development of Alternative and Renewable Energy Career (DAREC) having grant number UM.C/HIR/MOHE/ENG/60.References
- M. Gürü, B. D. Artukoğlu, A. Keskin and A. Koca, Energy Convers. Manage., 2009, 50, 498–502 CrossRef PubMed.
- H. Ong, T. Mahlia and H. Masjuki, Renewable Sustainable Energy Rev., 2011, 15, 639–647 CrossRef PubMed.
- E. Cecrle, C. Depcik, A. Duncan, J. Guo, M. Mangus, E. Peltier, S. Stagg-Williams and Y. Zhong, Energy Fuels, 2012, 26, 2331–2341 CrossRef CAS.
- S. Mekhilef, S. Siga and R. Saidur, Renewable Sustainable Energy Rev., 2011, 15, 1937–1949 CrossRef CAS PubMed.
- A. Demirbas, Energy Convers. Manage., 2009, 50, 2239–2249 CrossRef CAS PubMed.
- B. M. Masum, M. A. Kalam, H. H. Masjuki and S. M. Palash, Adv. Mater. Res., 2013, 781, 2471–2475 CrossRef.
- M. Koç, Y. Sekmen, T. Topgül and H. S. Yücesu, Renewable Energy, 2009, 34, 2101–2106 CrossRef PubMed.
- M. K. Balki, C. Sayin and M. Canakci, Fuel, 2014, 115, 901–906 CrossRef CAS PubMed.
- R. C. Costa and J. R. Sodré, Fuel, 2010, 89, 287–293 CrossRef CAS PubMed.
- M. L. Wald, A Bit More Ethanol in the Gas Tank, N. Y. TIMES, 2010.
- R. Rabobank, The Future of Ethanol - Brazilian and U.S. Perspectives, PRNewswire, NEW YORK, 2012.
- A. Demirbas, Energy Sources, Part A, 2009, 31, 1056–1062 CrossRef CAS.
- J. Campos-Fernandez, J. M. Arnal, J. Gomez, N. Lacalle and M. P. Dorado, Fuel, 2013, 107, 866–872 CrossRef CAS PubMed.
- E. S. Olson, R. K. Sharma and T. R. Aulich, Proceedings of the Twenty-Fifth Symposium on Biotechnology for Fuels and Chemicals Held May 4–7, 2003, in Breckenridge, CO, 2004 Search PubMed.
- I. Gravalos, D. Moshou, T. Gialamas, P. Xyradakis, D. Kateris and Z. Tsiropoulos, Renewable Energy, 2013, 50, 27–32 CrossRef CAS PubMed.
- Y. Yacoub, R. Bata and M. Gautam, Proc. Inst. Mech. Eng., Part A, 1998, 212, 363–379 CrossRef.
- M. Gautam, D. Martin and D. Carder, Proc. Inst. Mech. Eng., Part A, 2000, 214, 165–182 CrossRef.
- E. M. Ammar, Metabolic Engineering of Propionibacteria for Enhanced Propionic Acid and n-Propanol Fermentative Production, The Ohio State University, 2013.
- T. Grotkjaer, B. Christensen, T. B. Regueira, S. T. Joergensen and A. Berry, Google Patents, Patent number: WO 2012058603 A1, 2011.
- R. Jain and Y. Yan, Microb. Cell Fact., 2011, 10, 19 CrossRef PubMed.
- E. I. Lan and J. C. Liao, Bioresour. Technol., 2013, 135, 339–349 CrossRef CAS PubMed.
- I. Komonkiat and B. Cheirsilp, Bioresour. Technol., 2013, 146, 200–207 CrossRef CAS PubMed.
- C. J. Baker, Banks Power, 2014.
- I. Schifter, L. Diaz, J. P. Gómez and U. Gonzalez, Fuel, 2013, 103, 292–298 CrossRef CAS PubMed.
- R. Feng, J. Yang, D. Zhang, B. Deng, J. Fu, J. Liu and X. Liu, Energy Convers. Manage., 2013, 74, 192–200 CrossRef CAS PubMed.
- G. Najafi, B. Ghobadian, T. Tavakoli, D. R. Buttsworth, T. F. Yusaf and M. Faizollahnejad, Appl. Energy, 2009, 86, 630–639 CrossRef CAS PubMed.
- M. Eyidogan, A. N. Ozsezen, M. Canakci and A. Turkcan, Fuel, 2010, 89, 2713–2720 CrossRef CAS PubMed.
- J. Campos-Fernandez, J. M. Arnal, J. Gomez, N. Lacalle and M. P. Dorado, Fuel, 2013, 107, 866–872 CrossRef CAS PubMed.
- I. M. Rizwanul Fattah, H. H. Masjuki, M. A. Kalam, M. Mofijur and M. J. Abedin, Energy Convers. Manage., 2014, 79, 265–272 CrossRef CAS PubMed.
- T. C. Melo, G. B. Machado, C. R. Belchior, M. J. Colaço, J. E. Barros, E. J. de Oliveira and D. G. de Oliveira, Fuel, 2012, 97, 796–804 CrossRef PubMed.
- H. Bayindir, H. S. Yücesu and H. Aydin, Energy Sources, Part A, 2010, 33, 49–56 CrossRef.
- M. Canakci, A. N. Ozsezen, E. Alptekin and M. Eyidogan, Renewable Energy, 2013, 52, 111–117 CrossRef CAS PubMed.
- M. Pechout, M. Mazac and M. Vojtisek-Lom, Training, 2012, 2013, 11 Search PubMed.
- E. W. Kaiser, W. O. Siegl, Y. I. Henig, R. W. Anderson and F. H. Trinker, Environ. Sci. Technol., 1991, 25, 2005–2012 CrossRef CAS.
- B. Masum, H. Masjuki, M. Kalam, I. Rizwanul Fattah, S. M. Palash and M. Abedin, Renewable Sustainable Energy Rev., 2013, 24, 209–222 CrossRef CAS PubMed.
| This journal is © The Royal Society of Chemistry 2014 |

