A molecularly imprinted electrochemical sensor based on gold nanoparticles and multiwalled carbon nanotube–chitosan for the detection of tryptamine
Xue Meng,
Wenjuan Guo*,
Xiaoli Qin,
Yiming Liu,
Xiangwei Zhu,
Meishan Pei and
Luyan Wang
Shandong Provincial Key Laboratory of Chemical Sensing & Analysis, School of Chemistry and Chemical Engineering, University of Jinan, Jinan 250022, China. E-mail: chm_guowj@163.com; Tel: +86-13589066804
First published on 13th August 2014
Abstract
A novel molecularly imprinted electrochemical sensor based on gold nanoparticle/chitosan–multiwalled carbon nanotubes (CS–MWCNTs) for sensitive detection of tryptamine was presented. Molecularly imprinted polymers (MIPs) were synthesized by electropolymerization using 3-thiophenemalonic acid (3-TPA) as a functional monomer, and tryptamine (TA) as the template molecule. Cyclic voltammetry (CV) and chronoamperometry were used to characterize the electrochemical behavior of the developed sensor. The linear range of the sensor was from 6.0 × 10⁻⁸ mol L−1 to 3.0 × 10⁻⁵ mol L−1, with the limit of detection (LOD) of 4.17 × 10⁻⁸ mol L−1 (S/N = 3). The proposed MIPs sensor exhibited good selectivity for TA, as well as good stability and repeatability. Furthermore, the proposed sensor was applied to determine the TA in cheese and lactobacillus beverage samples and the results implied its feasibility for practical application.
1. Introduction
Biogenic amines are nitrogenous compounds of low molecular weight found in a small amount in plants and animals.1,2 Biogenic amines in food are formed mainly by the decarboxylation of amino acids.3,4 It is well known that if the amount of biogenic amines is high in human body, it will cause a range of diseases, such as hypotension, hypertension, migraines, nausea, rash, dizziness, increased cardiac output, and increased respiration.5,6 Tryptamine (TA) is a kind of the biogenic amines, which is formed from the decarboxylation of the tryptophan.7,8 It is present at trace concentrations in mammalian brain tissue and is thought to play a very significant role in the coordination of biogenic amine-based synaptic physiology.9 The consumption of foods containing high concentrations of TA may cause high blood pressure. For this reason, many methods have been used for the determination of TA, such as liquid chromatography/quadrupole time-of-flight mass spectrometry,10,11 tandem mass spectrometry,12 electrophoretic technique13 and ultra-performance liquid chromatography (UPLC).14 However, the methods mentioned above are usually expensive and time-consuming. It is necessary for us to develop a convenient method with relative low cost for the detection of TA residue in foodstuffs.15Molecular imprinting was first raised by Dickey in 1949 and had been gradually known until the molecularly imprinted polymers (MIPs) were constructed by Wuff in 1972.16 Recently, the molecular imprinting technology (MIT) has become an efficient analytical tool combined with electrochemical sensors. As a recognition element for sensors, MIPs are usually obtained by the polymerization of monomers and templates (combined by covalent interaction or non-covalent interaction primarily). After removing the templates, the surface cavities complementary to the templates are formed.17–19 Molecularly imprinted electrochemical sensor exhibits high selectivity, low-cost, and good stability.20,21 To improve the current response of the sensor, a variety of materials have been employed to modify electrode, like gold nanoparticle, multiwalled carbon nanotubes (MWCNTs) and conducting polymer.22,23
During these years, nanoparticles have been widely used in the modification of the electrode to increase the electrode surface area and enhance the current signal. Among the nanoparticles, gold nanoparticles (GNPs) have attracted many researchers' interest because of its large aspect ratio, good conductivity and biocompatibility.24,25 Carbon nanotubes (CNTs) also possess many unique properties, such as high surface-to-volume ratio, good electrical conductivity, and good chemical stability.26–30 Both GNPs and CNTs are increasingly used to enhance the sensitivity of electrochemical sensor. Due to its excellent film-forming ability, high water permeability, good adhesion, and high mechanical strength, chitosan (CHIT) has been used to enhance the stability of nanoparticles and CNTs as immobilization matrices.31,32 To the best of our knowledge, Huang group has been devoted to developing the biosensor by MIT. In 2011, J. Huang et al. successfully prepared a molecularly imprinted electrochemical sensor based on multiwalled carbon nanotube–gold nanoparticle composites and chitosan for the detection of tyramine, a kind of TA analogs.33 After that, they successfully prepared a electrochemical sensor based on molecularly imprinted film at polypyrrole–sulfonated graphene/hyaluronic acid–MWCNTs modified electrode with the relatively low limit of detection (LOD) of 7.4 × 10⁻⁸ mol L−1.34 In this paper, the fabrication of the sensor was easier and 3-TPA was first used. The usage of 3-TPA which was used as the monomer to form the films with high conductivity is benefit to improve the current signal. Moreover, it can also provide more binding sites with the template molecules.
Polythiophene and its derivatives have attracted considerable attention over the past 20 years for many excellent properties, including their stability in the atmosphere, high conductivity, and ease in forming free-standing and high strength films.35–38 Poly(3-thiophenemalonic acid) (P3-TPA) is one of the most promising conducting polymers with two carboxylic groups, which could afford higher electrode stability and reproducibility compared with that of the unsubstituted thiophene. Moreover, P3-TPA can provide more binding sites compared with the polythiophene derivatives with one functional group. In this article, a novel molecularly imprinted electrochemical sensor based on GNPs/CS–MWCNTs was fabricated for the detection of TA. The MIPs were formed through electropolymerization of the functional monomer 3-thiophenemalonic acid (3-TPA) with TA as the template molecule. The characterization and detection of the imprinted sensor were investigated by cyclic voltammetry (CV) and amperometry. The reproducibility, repeatability and stability were also investigated.
2. Materials and methods
2.1 Reagents
TA and 3-TPA were purchased from Beijing Bailingwei Co., Ltd. (China). MWCNTs were obtained from Beijing Dekedaojin Co., Ltd. (China). Gold chloride (HAuCl4·4H2O) and chitosan were purchased from Sinopharm Chemical Reagent Co., Ltd. (China). Cheese and lactobacillus beverage samples were obtained from a local market. All chemicals were analytical grade. Deionized water was used throughout this study.2.2 Equipments
Cyclic voltammetry (CV) and chronoamperometry experiments were carried out with an Electrochemical Workstation IM6ex (Germany). Solution pH was measured on PHS-3C pH meter. Fluorescence spectra were measured on F-4600 FL Spectrophotometer. Electrochemical measurements were performed using a three-electrode system consisting of a KCl saturated Ag/AgCl reference electrode, a platinum wire auxiliary electrode and a modified glassy carbon working electrode.2.3 Glassy carbon electrode (GCE) pretreatment
Bare GCE was polished using 0.3 μm 0.05 μm alumina slurry on microcloth pads and rinsed thoroughly with deionized water. Prior to surface modification, the GCE was scanned by CV from −0.2 to +0.6 V in K3[Fe(CN)6] solution until repeating cyclic voltammograms appeared. Then, the electrode was washed with deionized water and dried before use.2.4 Sensor fabrication
Firstly, GNPs was modified on the bare GCE by the electrochemical reduction of HAuCl4 (1 mg mL−1) at the potential of −200 mV for 5 min. Subsequently, carboxylated MWCNTs–chitosan (MWCNTs–CS) were modified on the electrode. The carboxylated MWCNTs were prepared based on a reported method.39 50 mg MWCNTs were dissolved in a 40 mL mixture of 98 wt% concentrated sulfuric acid and 68 wt% nitric acid (3![[thin space (1/6-em)]](https://www.rsc.org/images/entities/char_2009.gif) :
:![[thin space (1/6-em)]](https://www.rsc.org/images/entities/char_2009.gif) 1, v/v) for ultrasonic agitation for 4 h. Then the mixture was washed with deionized water by centrifugation (10
1, v/v) for ultrasonic agitation for 4 h. Then the mixture was washed with deionized water by centrifugation (10![[thin space (1/6-em)]](https://www.rsc.org/images/entities/char_2009.gif) 000 rpm) until the pH of the resulting solution became neutral. MWCNTs–CS composites were prepared by mixing 1 mg MWCNTs–COOH with 500 μL 0.1% chitosan, and a dispersed black suspension was obtained by ultrasonic agitation for 3 min. At last, 15 μL MWCNTs–CS composites solution was dropped onto the GNP modified electrode surface and dried at RT.
000 rpm) until the pH of the resulting solution became neutral. MWCNTs–CS composites were prepared by mixing 1 mg MWCNTs–COOH with 500 μL 0.1% chitosan, and a dispersed black suspension was obtained by ultrasonic agitation for 3 min. At last, 15 μL MWCNTs–CS composites solution was dropped onto the GNP modified electrode surface and dried at RT.
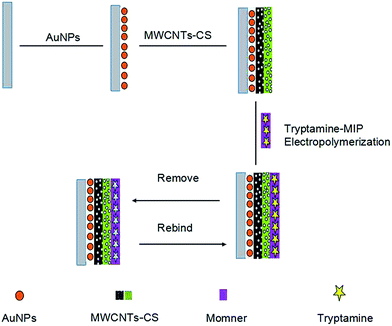
Finally, the TA-imprinted polymer was prepared by electropolymerization in the solution of 20 mmol L−1 3-TPA and 1 mmol L−1 TA in the range from −0.6 to 1.0 V at a scan rate of 100 mV s−1 for 15 scans. The MIP electrode was washed by the flowing PBS solutions for 5 minutes to remove the template molecules and dried overnight. The schematic diagram of the stepwise procedure of the sensor is shown in Scheme 1.
As a comparison, non-imprinted polymers (NIPs) sensor was prepared under the same experimental conditions without TA.
2.6 Electrochemical measurements
Electrochemical measurements to characterize the MIPs films were carried out in 5.0 mmol L−1 K3[Fe(CN)6] solution containing 0.2 mol L−1 KCl at RT. CV measurements were performed over a potential range from −0.2 to 0.6 V at a scan rate of 50 mV s−1. Amperometric experiment (I–t) was performed and all sensing potentials were set at 0.4 V. The equilibrium time of each curve was set at 800 s. All experiments except the characterization of the MIPs modified electrode were carried out using I–t.3. Results and discussion
3.1 Characterization of the sensor
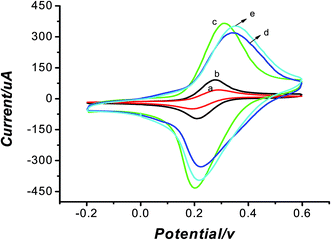
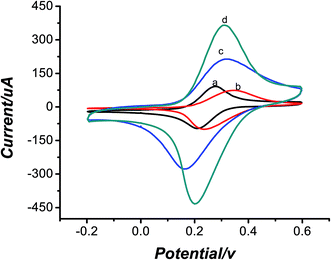
CV was used in the study to investigate the processes of the modification of electrodes in aqueous solution containing 5 mmol L−1 of K3[Fe(CN)6] and 0.2 mol L−1 KCl as shown in Fig. 1. The bare electrode (curve a) had a pair of redox peaks. After modification of GNPs (curve b), the peak current was larger. This is resulted from the good conductivity of GNPs. Fig. 1c shows the CV of the MWCNT–CS modified electrode. It was obvious that the current response became 200 μA larger than that of the bare electrode. It is mainly due to that MWCNTs had the special properties involving good electrical conductivity and good chemical stability, as well as excellent film-forming ability and high mechanical strength of CS. When the MIP was prepared, the peak current decreased because of the nonconductive template molecules, as shown in Fig. 1d. After the template was removed, the peak current became larger and increased about 300 μA than that of bare electrode in Fig. 1e. This could be explained that the formation of vacant recognition sites or binding cavity after the removal of the template made electronic transmission possible and K3[Fe(CN)6] could pass through the cavity to reach the surface of the electrode more easily. To testify the better modification effect of MWCNTs–CS bionanocomposites than MWCNTs and CS only, another experiment was carried out. As seen from Fig. 2d, CS was used to disperse MWCNTs and the current of MWCNTs–CS was higher than MWCNTs only. So MWCNTs–CS bionanocomposites showed high conductivity due to the excellent film-forming ability and dispersibility of CS.3.2 Characterization of the removal of template
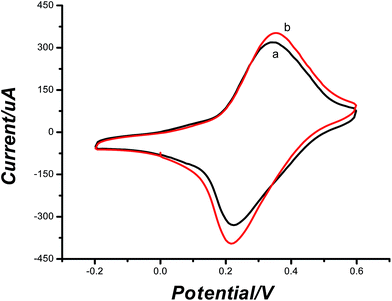
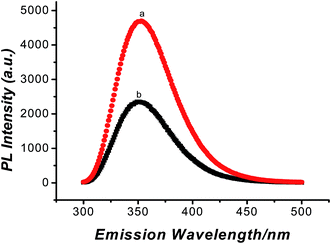
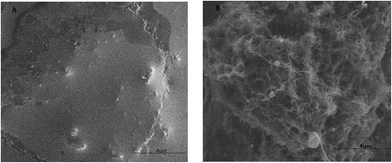
CV measurement, fluorescence experiment and SEM images were used to confirm the removal of TA. As observed in Fig. 3, after the template was removed, the peak current became larger, it could be explained that the formation of vacant recognition sites or binding cavity made electronic transmission possible. The fluorescence experiment was carried out in the elution solution. The elution solution was found at 354 nm with emission spectra (Fig. 4). This result was consistent with the result of the standard TA solution (5 × 10⁻⁴ mol L−1). It confirmed that TA was removed. Meanwhile, as observed in Fig. 5A, the imprinted film was distributed regularly on the electrode surface when the imprinted film was immobilized on the GNPs/CS–MWCNTs. After being washed with PBS, there were some caves which were caused by the removal of TA from the molecularly imprinted polymer (shown in Fig. 5B).3.3 Optimization of the experimental parameters
![[thin space (1/6-em)]](https://www.rsc.org/images/entities/char_2009.gif) :
:![[thin space (1/6-em)]](https://www.rsc.org/images/entities/char_2009.gif) 10; 1
10; 1![[thin space (1/6-em)]](https://www.rsc.org/images/entities/char_2009.gif) :
:![[thin space (1/6-em)]](https://www.rsc.org/images/entities/char_2009.gif) 15; 1
15; 1![[thin space (1/6-em)]](https://www.rsc.org/images/entities/char_2009.gif) :
:![[thin space (1/6-em)]](https://www.rsc.org/images/entities/char_2009.gif) 20; 1
20; 1![[thin space (1/6-em)]](https://www.rsc.org/images/entities/char_2009.gif) :
:![[thin space (1/6-em)]](https://www.rsc.org/images/entities/char_2009.gif) 25; 1
25; 1![[thin space (1/6-em)]](https://www.rsc.org/images/entities/char_2009.gif) :
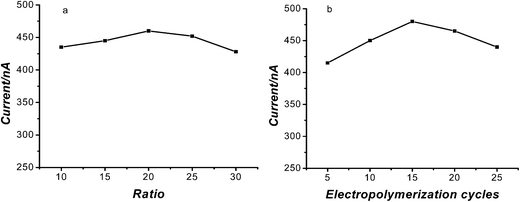
:![[thin space (1/6-em)]](https://www.rsc.org/images/entities/char_2009.gif) 30) to detect 5 × 10⁻⁶ mol L−1 TA. The corresponding results are shown in Fig. 6a. It's obvious that when the ratio was 1
30) to detect 5 × 10⁻⁶ mol L−1 TA. The corresponding results are shown in Fig. 6a. It's obvious that when the ratio was 1![[thin space (1/6-em)]](https://www.rsc.org/images/entities/char_2009.gif) :
:![[thin space (1/6-em)]](https://www.rsc.org/images/entities/char_2009.gif) 20, the current was the biggest. When the ratio was 1
20, the current was the biggest. When the ratio was 1![[thin space (1/6-em)]](https://www.rsc.org/images/entities/char_2009.gif) :
:![[thin space (1/6-em)]](https://www.rsc.org/images/entities/char_2009.gif) 10 or 1
10 or 1![[thin space (1/6-em)]](https://www.rsc.org/images/entities/char_2009.gif) :
:![[thin space (1/6-em)]](https://www.rsc.org/images/entities/char_2009.gif) 15, the current response became decreasing. It may be that the MIP was dispersed non-uniformly and the binding sites were limited. When the ratio was 1
15, the current response became decreasing. It may be that the MIP was dispersed non-uniformly and the binding sites were limited. When the ratio was 1![[thin space (1/6-em)]](https://www.rsc.org/images/entities/char_2009.gif) :
:![[thin space (1/6-em)]](https://www.rsc.org/images/entities/char_2009.gif) 25 and 1
25 and 1![[thin space (1/6-em)]](https://www.rsc.org/images/entities/char_2009.gif) :
:![[thin space (1/6-em)]](https://www.rsc.org/images/entities/char_2009.gif) 30, the current was lower which may be caused by the reason that the total number of binding sites was more than that of TA molecules.
30, the current was lower which may be caused by the reason that the total number of binding sites was more than that of TA molecules.
3.4 Chronoamperometric measurement
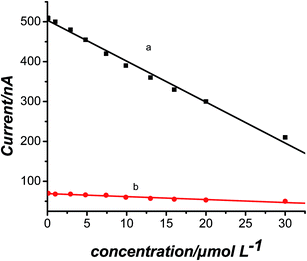
Chronoamperometric measurements of MIP and NIP electrodes were carried out to investigate the affinity of the MIPs electrode and NIPs electrodes to TA. Results are shown in Fig. 7. For the MIP electrode, a good linear relationship between the current density and the concentration of TA was found in the concentration range of 6.0 × 10⁻⁸ to 3.0 × 10⁻⁵ mol L−1, with a correlation coefficient of 0.9961. The detection limit (LOD) was 4.17 × 10⁻⁸ mol L−1 (S/N = 3), which was better than some other methods. The comparison results can be seen from Table 1.| Methods | Linear range | Detection limit | Reference |
|---|---|---|---|
| Molecularly imprinted electrochemical sensor | 0.0096–4.81 μg mL−1 | 0.00668 μg mL−1 | This paper |
| Ultra high performance liquid chromatography | 0.29–342.95 μg mL−1 | 0.09 μg mL−1 | 14 |
| Liquid chromatography-tandem mass spectrometry | 0.43–5.66 μg mL−1 | 0.05 μg mL−1 | 12 |
| Liquid chromatography/quadrupole time-of-flight mass spectrometry | 0.05–10.0 μg mL−1 | 0.02 μg mL−1 | 11 |
| Micellar liquid chromatography | 0.1–5 μg mL−1 | 0.041 μg mL−1 | 13 |
| Molecularly imprinted electrochemical sensor | 0.014–11.22 μg mL−1 | 0.0119 μg mL−1 | 37 |
3.5 Interference studies
Three TA analogs (tyramine, dopamine, tryptophan) were chosen to check the selectivity of TA imprinted sensor based on structural similarity and interaction types. The concentration of TA and the three substrates were all 5 × 10⁻⁶ mol L−1. It can be seen from Fig. 8 that the response of MIP electrode toward TA was stronger than that toward structural analogs and there was small response on NIP sensor. These results confirmed that the binding sites in TA-imprinted polymer are complementary to TA (template) in size, shape and position of their functional groups. Therefore, the imprinted sensor had good selectivity for detection of TA.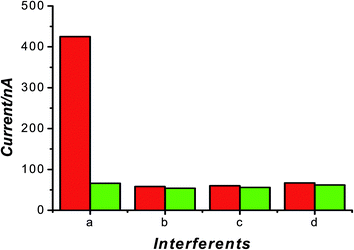 | ||
| Fig. 8 Chronoamperometric measurement of tryptamine and structural analogues on imprinted electrode: a, tryptamine; b, tyramine; c, dopamine; d, tryptophan. | ||
3.6 Reproducibility, repeatability and stability
To investigate the reproducibility of the imprinted sensor, six sensors which were fabricated under the same conditions were used to determine 5 × 10⁻⁶ mol L−1 TA. The relative standard deviation (RSD) was 5.2% which indicated that the imprinted sensor had an excellent reproducibility.To investigate the repeatability of the imprinted sensor, the experiments were performed in replicates of five times in a 5 × 10⁻⁶ mol L−1 TA. The relative standard deviation (RSD) was 7.1% which indicated that the imprinted sensor had a good repeatability.
To investigate the stability of the sensor, three sensors were used to detect 5 × 10⁻⁶ mol L−1 TA solution every two days (stored in 4 °C). After two weeks, the current response retained 91% of the initial value. It was suggested that the sensor possessed good stability.
3.7 Application
In order to examine the practical application, the imprinted sensor was used to detect TA in cheese and lactobacillus beverage samples by standard addition methods. The known different concentrations of standard solutions of TA were added to the 1.0 mL cheese and lactobacillus beverage samples, respectively. The detection of the concentration of TA was operated with the as-prepared MIP electrode by the chronoamperometric method. Results are shown in Table 2. The recoveries of this sensor ranged from 91.7 to 102%. It indicated that the method was accurate for the determination of TA in real samples.| Sample | Added (mol L−1) | Found (mol L−1) | Recovery (%) |
|---|---|---|---|
| Cheese | 1 × 10⁻⁶ | 9.64 × 10⁻⁷ | 96.4 |
| 3 × 10⁻⁶ | 3.06 × 10⁻⁶ | 102 | |
| 5 × 10⁻⁶ | 4.86 × 10⁻⁶ | 97.2 | |
| Lactobacillus beverage | 1 × 10⁻⁶ | 9.23 × 10⁻⁷ | 92.3 |
| 3 × 10⁻⁶ | 2.75 × 10⁻⁶ | 91.7 | |
| 5 × 10⁻⁶ | 4.67 × 10⁻⁶ | 93.4 |
4. Conclusions
In this study, a novel MIP sensor for TA detection was developed. The sensor was decorated by GNPs and CS–MWCNTs to improve the current response and the sensitivity of the sensor. In addition, the sensor showed good repeatability, stability and selectivity, and can be applied in real samples.Acknowledgements
Shandong Provincial Natural Science Foundation, China (grant no. ZR2012BL11), and Shandong Provincial Science and Technology Development Plan Project, China (grant no. 2013GGX10705) are acknowledged for their financial supports.References
- F. Gosetti, E. Mazzucco, V. Gianotti, S. Polati and M. C. Gennaro, J. Chromatogr. A, 2007, 1149, 151–157 CrossRef CAS PubMed.
- M. L. Latorre-Moratalla, et al., J. Chromatogr. A, 2009, 1216, 7715–7720 CrossRef CAS PubMed.
- S. Jia, Y. Ryua, S. W. Kwon and J. Lee, J. Chromatogr. A, 2013, 1282, 1–10 CrossRef CAS PubMed.
- R. Paseiro-Cerrato, et al., J. Chromatogr. A, 2011, 1218, 7105–7109 CrossRef CAS PubMed.
- M. Saaida and B. Saada, et al., J. Chromatogr. A, 2009, 1216, 5165–5170 CrossRef PubMed.
- D. Restuccia, et al., Talanta, 2011, 85, 363–369 CrossRef CAS PubMed.
- M. Gil-Agust, S. Carda-Broch, L. Monferrer-Pons and J. Esteve-Romero, J. Chromatogr. A, 2007, 1156, 288–295 CrossRef PubMed.
- S. Jia, et al., J. Chromatogr. A, 2011, 1218, 9174–9182 CrossRef CAS PubMed.
- S. A. Burchett and T. P. Hicks, Prog. Neurobiol., 2006, 79, 223–246 CrossRef CAS PubMed.
- F. Zhang, J. Xue, D. Wang, Y. Wang, H. Zou and B. Zhu, J. Inst. Brew., 2013, 119, 294–302 CrossRef CAS PubMed.
- S. Jia, et al., J. Chromatogr. A, 2011, 1218, 9174–9182 CrossRef CAS PubMed.
- G. Sagratini, et al., Food Chem., 2012, 132, 537–543 CrossRef CAS PubMed.
- M. Gil-Agustí, et al., J. Chromatogr. A, 2007, 1156, 288–295 CrossRef PubMed.
- B. Redruello, et al., Food Chem., 2013, 139, 1029–1035 CrossRef CAS PubMed.
- P. Deng, et al., Food Chem., 2014, 157, 490–497 CrossRef CAS PubMed.
- Y. Lv, T. Tan and F. Svec, Biotechnol. Adv., 2013, 31, 1172–1186 CrossRef CAS PubMed.
- B. L. Li, et al., Sens. Actuators, B, 2013, 186, 96–102 CrossRef CAS PubMed.
- Y. Zeng, et al., Biosens. Bioelectron., 2013, 45, 25–33 CrossRef CAS PubMed.
- Y. Tong, et al., Biosens. Bioelectron., 2013, 47, 553–558 CrossRef CAS PubMed.
- T. Alizadeh and F. Rezaloo, Sens. Actuators, B, 2013, 176, 28–37 CrossRef CAS PubMed.
- E. Royetal, S. Patra and R. Madhuri, et al., Talanta, 2014, 120, 198–207 CrossRef PubMed.
- H. Chen, et al., Electrochim. Acta, 2014, 117, 385–392 CrossRef CAS PubMed.
- J. Zhang, et al., Sens. Actuators, B, 2014, 193, 844–850 CrossRef CAS PubMed.
- J. Huang, et al., Food Control, 2011, 22, 786–791 CrossRef CAS PubMed.
- L. Zeng, H. Wang, X. Bo and L. Guo, J. Electroanal. Chem., 2012, 687, 117–122 CrossRef CAS PubMed.
- C. Xue, et al., Biosens. Bioelectron., 2013, 49, 199–203 CrossRef CAS PubMed.
- Y. Yangetal, Biosens. Bioelectron., 2013, 47, 475–481 CrossRef PubMed.
- T. Madrakian, E. Haghshenas and A. Afkhami, Sens. Actuators, B, 2014, 193, 451–460 CrossRef CAS PubMed.
- A. Nezhadali and M. Mojarrab, Sens. Actuators, B, 2014, 190, 829–837 CrossRef CAS PubMed.
- Y. Yangetal, Biosens. Bioelectron., 2013, 47, 475–481 CrossRef PubMed.
- S. MansouriMajd, H. Teymourian, A. Salimi and R. Hallaj, Electrochim. Acta, 2013, 108, 707–716 CrossRef CAS PubMed.
- W. Lian, et al., Biosens. Bioelectron., 2012, 38, 163–169 CrossRef CAS PubMed.
- J. Huang and X. Xing, et al., Food Res. Int., 2011, 44, 276–281 CrossRef CAS PubMed.
- X. Xing, S. Liu, J. Yu, W. Lian and J. Huang, Biosens. Bioelectron., 2012, 31, 277–283 CrossRef CAS PubMed.
- R. J. Waltman, J. Bargon and A. F. Diaz, J. Phys. Chem., 1983, 87, 1459 CrossRef CAS.
- L. Groenendaal, G. Zotti, P. H. Aubert, S. M. Waybright and J. R. Reynolds, Adv. Mater., 2003, 15, 855–879 CrossRef CAS PubMed.
- J. K. Xu, Z. H. Wei, Y. K. Du, S. Z. Pu, J. Hou and W. Q. Zhou, J. Appl. Polym. Sci., 2008, 109, 1570 CrossRef CAS PubMed.
- P. Liu, Y. L. Wu, H. L. Pan, B. S. Ong and S. P. Zhu, Macromolecules, 2010, 43, 6368–6373 CrossRef CAS.
- W. Lian, et al., Food Control, 2012, 26, 620–627 CrossRef CAS PubMed.
| This journal is © The Royal Society of Chemistry 2014 |

