DOI:
10.1039/C4RA04273E
(Communication)
RSC Adv., 2014,
4, 31333-31336
A convenient chemical titration method to measure M(II)/M(III) ratios of layered double hydroxides
Received
8th May 2014
, Accepted 4th July 2014
First published on 8th July 2014
Abstract
The M(II)/M(III) ratio is an important structural feature of layered double hydroxides (LDHs). Here, we report a convenient chemical titration method to measure the M(II)/M(III) ratio of LDHs. The measured results have a relative standard deviation of less than 1.0%, and agree with the data measured by inductively coupled plasma (ICP) atomic emission spectroscopy very well.
1. Introduction
In recent years, layered double hydroxides (LDHs), also known as “anionic clays”, have attracted significant academic and industrial interest due to their wide applications in various fields such as catalysts,1 thermal stabilizers,2 UV-ray shielding,3 drug release,4 adsorbents5 and polymer nanocomposites.6,7 They are commonly expressed by the general formula [M1−x2+Mx3+(OH)2]x+Ax/zz−·mH2O, in which M2+ and M3+ are divalent (Mg2+, Zn2+, Co2+, Fe2+, Ni2+, etc.) and trivalent (Al3+, Cr3+, Fe3+, etc.) cations occupying in the octahedral positions within the hydroxide layers, Az− is the anion balancing the positive charges on the layers, while x is generally believed to be between 0.20 and 0.33.8,9
The ratio of M(II)/M(III), which reveals the layer charge density, is an important feature of the LDHs.10 For example, LDHs with different M(II)/M(III) ratios have been found to exhibit significant deviances in their adsorption characteristics and selectivity.11 Generally, it is quantitatively determined by the instrumental analysis methods, such as inductively coupled plasma (ICP) atomic emission spectroscopy, ion beam analysis,12 atomic absorption,13 and even a semi-quantitative method of energy dispersive X-ray spectroscopy (EDS).14 However, these methods are strongly dependent on special analytical instruments. Fortunately, complexometric titration method has obvious advantages of being simple, cheap, and independent of instruments.15,16 Meanwhile, it is also effective for measurements of a mixture containing two or more different metal ions.17–19 Unfortunately, the publications of measurements of M(II)/M(III) ratio by chemical titration method are very limited so far.
In this study, we report a convenient chemical titration method to quantitatively measure the M(II)/M(III) ratio in MgAl-LDH and ZnAl-LDH, synthesized by traditional coprecipitation method, which are the most common and widely used types of LDHs. And the corresponding results by chemical titration are compared with a typical instrumental analysis method of ICP atomic emission spectroscopy.
2. Materials and characterizations
All reagents were of analytical reagent (A.R.) pure grade. Distilled water was used in the titration and synthesis procedure. MgAl-LDH and ZnAl-LDH samples with various Mg/Al or Zn/Al ratios (molar ratios of 2, 3 or 4 for the starting raw materials) were synthesized by a typical coprecipitation procedure under nitrogen atmosphere.6 In brief, for MgAl-LDH, sodium hydroxide aqueous solution (NaOH, 1 mol L−1) and a mixture solution of magnesium nitrate (Mg(NO3)2, 0.75 mol L−1) and aluminium nitrate (Al(NO3)3, 0.25 mol L−1) were added in a drop-wise manner into the mother solution containing NaOH and sodium nitrate (NaNO3, initially containing 0.15 mol L−1 NO3−). During the titration process, the pH value was monitored and kept at 10.0 with vigorous stirring. The resulting slurry was aged at 80 °C for 8 h. A white product was subsequently isolated by filtration and dried in a vacuum oven at 50 °C for 24 h. The same process was taken in the synthesis of ZnAl-LDH, except the pH value was kept at 7.0.
Standard solutions of zinc nitrate (0.01 mol L−1) or EDTA (0.01 mol L−1) was prepared by dissolving Zn(NO3)2·6H2O or disodium salt of EDTA in distilled water, and the concentration of EDTA was standardized by zinc nitrate solution. Buffer solutions of sodium acetate–acetic acid (pH 5.8) or ammonia–ammonium chloride (pH 10.0) was obtained by dissolving 200 g of sodium acetate and 9 mL of acetic acid in 1 L of distilled water, or 70 g of ammonium chloride in 250 mL of distilled water and subsequently mixed with 570 mL of liquid ammonia (25%) and then diluting to 1 L using distilled water. The concentration of NH4F solution was 0.3 mol L−1. Xylenol orange (0.1% aqueous solution) and Eriochrome Black T (mixing with ground sodium chloride crystals, 1![[thin space (1/6-em)]](https://www.rsc.org/images/entities/char_2009.gif) :
:![[thin space (1/6-em)]](https://www.rsc.org/images/entities/char_2009.gif) 100) were used as indicators.
100) were used as indicators.
Powder X-ray diffraction (PXRD) patterns were collected on a Rigaku D/max 2400 diffractometer with Cu Kα radiation (λ = 0.15418 nm). The powder samples were first dissolved in HNO3, and then determined through ICP atomic emission spectroscopy (SPECTRO ARCOS EOP, SPECTRO Analytical Instruments GmbH).
3. Measurements of Mg/Al ratios for MgAl-LDHs
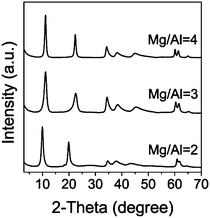
In order to measure the Mg/Al ratios, a series of MgAl-LDHs were synthesized. All of the obtained MgAl-LDH samples show well-defined layered structure and high purity, confirmed by the PXRD patterns shown in Fig. 1. In addition, for the MgAl-LDHs, the basal spacings (d003) vary with Mg/Al ratios, possibly due to the change of nitrate configuration of “flat-lying” or “stick-lying” and the difference of layer charge density.10
 |
| | Fig. 1 PXRD patterns of the MgAl-LDHs with various Mg/Al ratios. | |
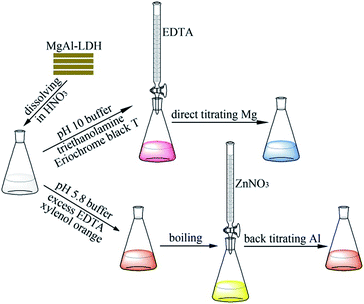
The chemical titration procedure for the measurements of the Mg/Al ratios of the MgAl-LDHs was schematically illustrated in Fig. 2. And the corresponding chemical reactions were shown by equilibrium eqn (1)–(4). Firstly, the 0.200 g of MgAl-LDH samples were dissolved in 100 mL HNO3 solution (0.1 mol L−1). To determine the content of the Mg2+ cations, the sample solution (5 mL) was added into a pH = 10.0 buffer solution (20 mL) followed by adding 3 mL triethanolamine (TEA) to entirely mask the Al–EDTA complexation (eqn (1)). Then, the Mg2+ cations was directly complexometric titrated with standard EDTA solution using Eriochrome Black T as the indicator (eqn (2)). The volume of the used standard EDTA solution was abbreviated as VE,1. As for the determination of the Al3+ content, the sample solution (5 mL) was kept in a pH = 5.8 buffer solution (20 mL). Subsequently, an excess known quantity of EDTA (20 mL) solution was added. At this low pH, the Al–EDTA complex was formed (eqn (3)), whereas the formation of Mg–EDTA complex was completely inhibited. After being boiled for 2−3 min, the back titration was carried out for the unchelated EDTA using the standard zinc nitrate solution and the indicator of xylenol orange (eqn (4)). The volume of used standard zinc nitrate solution was described as VZ,1. Thus, the Mg/Al ratio could be calculated by eqn (5), in which the CE and CZ were the concentrations of the standard solutions of EDTA and zinc nitrate, respectively.
 |
| | Fig. 2 A schematic illustration for the chemical titration procedure of the Mg/Al ratios of the MgAl-LDHs. | |
The titration data illustrated in Table 1 demonstrate that the results were accurate and reproducible. The relative standard deviation (R.S.D.) is low and permissible, being less than 1.0%. Generally, the Mg/Al ratios in the synthesized MgAl-LDHs are always lower than those calculated by the starting raw materials (Mg(NO3)2 and Al(NO3)3). The Mg/Al ratios shown in Fig. 1 and Table 1 (listed in the column of “added Mg/Al”) are based on the calculated results of the starting solutions of Mg(NO3)2 and Al(NO3)3. Obviously, they are slightly lower than those data of the titration data. Furthermore, the Mg/Al ratios of the MgAl-LDHs measured by the chemical titration method developed herein were in agreement with the ICP atomic emission spectroscopic results very well. Therefore, we conclude that the chemical titration method reported herein is highly effective for the measurements of Mg/Al ratios of the MgAl-LDHs.
| | |
pH = 10: Al + TEA = Al–TEA
| (1) |
| | |
pH = 5.8: Al + EDTA = Al–EDTA
| (3) |
| | |
Mg/Al = VE,1CE/(20CE − VZ,1CZ)
| (5) |
Table 1 Determination data of the Mg/Al ratios for the MgAl-LDH samples by chemical titration and ICP atomic emission spectroscopic methods
| Added Mg/Al |
Titration data |
R.S.D. (%) (n = 5) |
ICP data |
| Mg (wt%) |
Al (wt%) |
Mg/Al |
| 1.999 |
1.922 ± 0.016 |
0.84 |
20.45 |
11.58 |
1.960 |
| 2.987 |
2.825 ± 0.015 |
0.53 |
23.61 |
9.46 |
2.769 |
| 4.008 |
3.510 ± 0.012 |
0.34 |
25.70 |
8.08 |
3.529 |
4. Measurements of Zn/Al ratios for ZnAl-LDHs
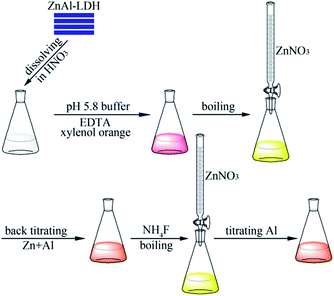
For the measurements of the Zn/Al ratios for the ZnAl-LDHs, a basic titration process was proposed, as shown in Fig. 3. First, the ZnAl-LDH samples were dissolved in 100 mL HNO3 solution (0.1 mol L−1). Then, 10 mL of the obtained solution was added into a mixture containing a pH = 5.8 buffer solution (20 mL) and an excess amount of the standard EDTA solution (15 mL). Subsequently, the system was boiled for 2−3 min to ensure entire the complex of EDTA with Zn2+ and Al3+ (eqn (3) and (4)). The total amount of Zn2+ and Al3+ was measured by back titration with the standard zinc nitrate solution using xylenol orange as the indicator (eqn (4)). The volume of the used standard zinc nitrate solution was described as VZ,2. Subsequently, 4 mL NH4F solution was added to release the EDTA combined with the Al3+ (eqn (6)). After boiling for 2−3 min, the released EDTA was titrated with the standard zinc nitrate solution. The volume of the used standard zinc nitrate solution was abbreviated as VZ,3. Therefore, the Zn/Al ratio could be calculated by eqn (7).| | |
pH = 5.8: Al–EDTA + 6F− = AlF63− + EDTA
| (6) |
| | |
Zn/Al = (15CE − VZ,2CZ − VZ,3CZ)/VZ,3CZ
| (7) |
 |
| | Fig. 3 A schematic illustration showing the chemical titration procedure of the measurements of the Zn/Al ratios for the ZnAl-LDHs. | |
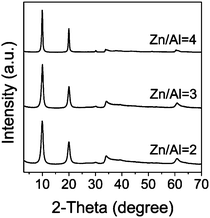
The PXRD patterns (Fig. 4) show that all of the ZnAl-LDH samples are well-defined. The lack of any impurity peaks confirms the high purity of the products. These XRD results are in very good agreement with the previous investigations.20,21 However, unlike the MgAl-LDH samples, the basal spacing for all of the synthesized ZnAl-LDH samples were essentially 0.89 nm, without any obvious changes. The reason might be due to the real Zn2+/Al3+ ratios in the synthesized product. As shown in Table 2, all of the measured Zn/Al ratios were between 1.1 and 2.0, although the Zn/Al ratios of the starting solutions of Zn(NO3)2 and Al(NO3)3 were 2, 3 and 4, respectively.
 |
| | Fig. 4 PXRD patterns of the ZnAl-LDHs with various Zn/Al ratios. | |
Table 2 Determination data of the Zn/Al ratios of the ZnAl-LDH samples by chemical titration and ICP atomic emission spectroscopic methods
| Added Zn/Al |
Titration data |
R.S.D. (%) (n = 5) |
ICP data |
| Zn (wt%) |
Al (wt%) |
Zn/Al |
| 1.997 |
1.217 ± 0.006 |
0.49 |
34.61 |
12.21 |
1.170 |
| 2.990 |
1.462 ± 0.013 |
0.89 |
34.51 |
10.12 |
1.407 |
| 4.003 |
1.976 ± 0.013 |
0.66 |
40.15 |
9.04 |
1.832 |
As for the titration process of the ZnAl-LDHs, the feasibility of the chemical titration method has also been verified. The chemical titration procedure was completed for the three synthesized ZnAl-LDHs. The relative titration data (shown in Table 2) clearly demonstrate that accurate and reproducible results could be achieved, with a very low R.S.D. of ≤1.0%. Furthermore, the Zn/Al ratios of the ZnAl-LDHs measured by the chemical titration method developed herein were also in agreement with those determined by the ICP atomic emission spectroscopic results very well.
5. Conclusions
In summary, a simple and effective chemical titration method was proposed to measure the Mg/Al or Zn/Al ratios of the synthesized MgAl-LDHs or the ZnAl-LDHs. The measured results were accurate and highly reproducible (with a permissible R.S.D. of less than 1.0%), and showed little difference with the data determined by the instrumental analytical method such as ICP atomic emission spectroscopy.
Acknowledgements
The authors are grateful to National Natural Science Foundation of China (51073162). G. Chen acknowledges Youth Innovation Promotion Association, Chinese Academy of Sciences.
Notes and references
- D. Pavel, D. Tichit and I.-C. Marcu, Appl. Clay Sci., 2012, 61, 52 CrossRef PubMed
 .
. - J. Liu, G. Chen and J. Yang, Polymer, 2008, 49, 3923 CrossRef CAS PubMed
 .
. - T. Cao, K. Xu, G. Chen and C.-Y. Guo, RSC Adv., 2013, 3, 6282 RSC
 .
. - M. S. S. Román, M. J. Holgado, B. Salinas and B. Rives, Appl. Clay Sci., 2013, 71, 1 CrossRef PubMed
 .
. - I. Pavlovic, M. R. Pérez, C. Barriga and M. A. Ulibarri, Appl. Clay Sci., 2009, 43, 125 CrossRef CAS PubMed
 .
. -
(a) P. Fu, K. Xu, H. Song, G. Chen, J. Yang and Y. Niu, J. Mater. Chem., 2010, 20, 3869 RSC
 ;
(b) Z. Hu and G. Chen, Adv. Mater., 2014, 26 DOI:10.1002/adma.201400179
  ;
(c) Z. Hu and G. Chen, J. Mater. Chem. A, 2014, 2 10.1039/c4ta01590h
  .
. - K. Xu, G. Chen and J. Shen, Appl. Clay Sci., 2013, 75, 114 CrossRef PubMed
 .
. - K. Xu, G. Chen and J. Shen, RSC Adv., 2014, 4, 8686 RSC
 .
. - K. Xu, Z. Zhang, G. Chen and J. Shen, RSC Adv., 2014, 4, 19218 RSC
 .
. - Z. Xu and H. Zeng, J. Phys. Chem. B, 2001, 105, 1743 CrossRef CAS
 .
. - Y. F. Chao, J. J. Lee and S. L. Wang, J. Hazard. Mater., 2009, 165, 846 CrossRef CAS PubMed
 .
. - H. C. Greenwell, W. Jones, S. L. Rugen-Hankey, P. J. Holliman and R. L. Thompson, Green Chem., 2010, 12, 688 RSC
 .
. - Z. P. Xu and P. S. Braterman, Appl. Clay Sci., 2010, 48, 235 CrossRef CAS PubMed
 .
. - J. S. Valente, M. Sanchez-Cantu, E. Lima and F. Figueras, Chem. Mater., 2009, 21, 5809 CrossRef CAS
 .
. - K. C. Ghosh, B. C. Mukherjee, N. N. Ganguly, M. Yusuf and V. N. Choudhury, Talanta, 1992, 39, 675 CrossRef CAS
 .
. - C. Yi, D. J. Huang and M. Gratzl, Anal. Chem., 1996, 68, 1580 CrossRef CAS
 .
. - Y. Ni and Y. Wu, Anal. Chim. Acta, 1997, 354, 233 CrossRef CAS
 .
. - P. Shetty and A. N. Shetty, J. Serb. Chem. Soc., 2005, 70, 1357 CrossRef CAS
 .
. - S. Yang and R. Y. Tsai, J. Chem. Educ., 2006, 83, 906 CrossRef CAS
 .
. - Z. Zhang, G. Chen and J. Liu, RSC Adv., 2014, 4, 7991 RSC
 .
. - Z. Zhang, G. Chen and K. Xu, Ind. Eng. Chem. Res., 2013, 52, 11045 CrossRef CAS
 .
.
|
| This journal is © The Royal Society of Chemistry 2014 |
Click here to see how this site uses Cookies. View our privacy policy here. ![[thin space (1/6-em)]](https://www.rsc.org/images/entities/char_2009.gif) :
:![[thin space (1/6-em)]](https://www.rsc.org/images/entities/char_2009.gif) 100) were used as indicators.
100) were used as indicators.

.
.
.
.
.
; (b) Z. Hu and G. Chen, Adv. Mater., 2014, 26 DOI:10.1002/adma.201400179
; (c) Z. Hu and G. Chen, J. Mater. Chem. A, 2014, 2 10.1039/c4ta01590h
.
.
.
.
.
.
.
.
.
.
.
.
.
.
.
.


