
Template-free fabrication of rattle-type TiO2 hollow microspheres with superior photocatalytic performance
Donghai Wanga,
Haijiao Zhang *ac,
Jingxin Guoa,
Huijuan Xua,
Xuedong Zhu*b and
Zheng Jiaoa
*ac,
Jingxin Guoa,
Huijuan Xua,
Xuedong Zhu*b and
Zheng Jiaoa
aInstitute of Nanochemistry and Nanobiology, School of Environmental and Chemical Engineering, Shanghai University, Shanghai 200444, P. R. China. E-mail: hjzhang128@shu.edu.cn; Fax: +86-21-6613-5275; Tel: +86-21-6613-5275
bState Key Laboratory of Chemical Engineering, East China University of Science & Technology, Shanghai 200237, P. R. China. E-mail: xdzhu@ecust.edu.cn
cState Key Laboratory of Molecular Engineering of Polymers, Department of Macromolecular Science, Fudan University, Shanghai 200433, P. R. China
First published on 13th August 2014
Abstract
In the paper, an environmentally friendly and template-free route based on a simple hydrothermal process has been developed for preparing rattle-type TiO2 hollow microspheres by using titanium(IV) sulfate (Ti(SO4)2) as the titanium source and glycerol/water as the cosolvent. The SEM and TEM images showed that the obtained TiO2 products were rattle-type hollow nanostructures with a diameter of ca. 1.1 μm. More importantly, the products have a good thermal stability and high crystallinity, which is favorable for their practical applications. According to the experimental results, a possible formation mechanism involving the Ostwald ripening process was proposed combined with various techniques such as SEM, TEM, BET, IR, and UV-vis. The photocatalytic results indicated that the TiO2 microspheres obtained from 750 °C thermal treatment exhibited higher photocatalytic activity for the photodegradation of methyl orange (MO) than those of other calcination temperatures and commercial Degussa P25. To further improve the photocatalytic activity, Ag-doped TiO2 photocatalyst was also prepared by the impregnation method. The results indicated that the photocatalytic activity of the Ag/TiO2 catalysts was greatly enhanced compared with the pure TiO2 catalysts. The possible photodegradation mechanism was also discussed.
1. Introduction
In recent years, nanomaterials based on semiconducting metal oxides such as ZnO, SnO2, TiO2 and others have been widely applied in the photocatalytic degradation of organic pollutants,1,2 water-splitting,3,4 photovoltaics,5–7 and so on. On account of ease of scaling up and relatively high economical efficiency, these metal oxides have attracted more and more attention in both fundamental research and industrial applications. Among them, TiO2 has been regarded as one of the most important semiconductors because of its non-toxicity, low cost, high chemical stability, and excellent photocatalytic activity.8–12 Generally speaking, the outstanding photocatalytic performance of TiO2 are attributed to the relatively wide band gap energy of 3.0–3.2 eV, which allows the absorption of UV light, resulting in the generation of electron (e−)–hole (h+) pairs and subsequently inducing redox reactions.13–16 In addition, the photocatalytic activity of TiO2 was also strongly affected by their intrinsic physicochemical properties such as the surface area, crystal phase, particle size, crystallinity, as well as the morphology.17–20 Nowadays, many efforts have been made to prepare the TiO2 nanomaterials with diversified morphologies including spheres,21–24 networks25,26 and nanotubes,27,28 etc.29,30 Among various morphologies, the hollow nanostructures have their unique advantages in controlled shell thickness, mesoporosity, and high crystallinity.31–34 Many methods have been developed to fabricate the hollow nanostructures through Ostwald ripening process, nanocasting, and etching techniques.33,34 To date, the most extensive approach used is the sacrificial-template method including hard template and soft template to obtain hollow nanostructures. However, these methods usually require multiple experiment processes in which the templates not only need to be synthesized but also removed by calcination or dissolution.31,32 The whole process needs a lot of energy and materials. In comparison, a template-free method has its unique advantages of simple, efficient, low cost and environment-friendly.33–36Herein, we present a low-cost, simple, one-step, and template-free route to synthesize rattle-type TiO2 hollow microspheres with a good thermal stability, high crystallinity, and superior photocatalytic performance. Combined with many characterization techniques and the experimental results, we put forward a possible formation mechanism involving the Ostwald ripening process. It was found that the calcination temperature played an important role in determining the structure and properties of the TiO2 products. Besides that, Ag/TiO2 photocatalyst was also prepared by the impregnation method. The photodegradation of methyl orange (MO) was used to evaluate the photocatalytic performance of the materials. The present method offered a possible synthetic route for the preparation of other metal oxide and composite material. Moreover, such yolk–shell TiO2 microspheres could also be applied in various fields including catalysis, electrochemistry, separation, purification, and so on.
2. Experimental section
2.1 Materials
Titanium(IV) sulfate (CP), glycerol (AR), ethanol (AR), silver nitrate (AgNO3), sodium borohydride (NaBH4), trisodium citrate, methyl orange (MO), commercial TiO2 (Degussa P25, Degussa Chemical, Germany), the reagents mentioned are all purchased from Sinopharm Chemical Reagent Co, Ltd. All reagents were used without further purification. Distilled water was used throughout the experiments.2.2 Synthesis
2.3 Characterizations
The samples were studied by transmission electron microscopy (TEM, JEOL 200CX), scanning electron microscopy (SEM, JEOL JSM-6700F), High resolution transmission electron microscopy (HRTEM, JSM-2010F). FT-IR spectrum was recorded on a Nicolet AVATAR 370 Fourier transform infrared spectrometer at a wavenumber of 500–4000 cm−1 using KBr pellets. Elemental qualitative analysis was conducted by the energy-dispersive X-ray spectroscopy (EDX, OXFORD INCA) which was mounted in the JSM-6700F. X-ray powder diffraction (XRD) patterns were obtained on the Japan Rigakul D/max-2550 instrument operating at 40 kV and 40 mA using CuKα radiation (λ = 0.154 nm). X-ray photoelectron spectroscopy (XPS) measurements were performed on an ESCALAB 250Xi (Thermofisher, England) using monochromatic Al Kα X-ray source operating at a vacuum better than 10−7 Pa. N2 adsorption–desorption isotherms were recorded on a QUADRASORB SI surface area & pore size analyzer at 77 K, after the product were annealed at 150 °C for 6 h. The Brunauer–Emmett–Teller (BET) specific surface area was calculated by using the desorption data. UV-vis absorption spectra were recorded on a HITACHI U-3010 UV-vis spectrophotometer.2.4 Photodegradation measurements
The photocatalytic activity of the products was tested in a SGY-IB photochemical reactor using methyl orange (MO) degradation in aqueous solution under UV light irradiation (λ < 400 nm). Typically, 20 mg of TiO2 catalysts was added to 50 ml aqueous solution containing 25 mg L−1 MO in a 100 ml beaker. The mixture was then placed an ultrasonic water bath for 20 min, followed by stirring in the dark at ambient temperature for 60 min to achieve adsorption–desorption equilibrium for MO. Upon equilibrium, 3–5 ml of the suspension was extracted out to determine the initial concentration of MO solution, which was recorded as the base concentration C0. The remaining mixture was transferred into a 50 ml quartz tube and illuminated with a 300 W Hg lamp. In the following 60 min, 3–5 ml of the suspension was extracted out every 5 min. Extracted suspensions were centrifuged immediately to separate any suspended solid. The UV-vis spectra of the upper solution were measured using a Hitachi U-3010 UV-vis spectrophotometer to determine the concentration of remaining MO over time, which was recorded as Ct. For comparison, the photocatalytic activity of commercial Degussa P25 was also investigated under the same condition.3. Results and discussion
3.1 Structure and morphology
The structures and morphologies of the samples were characterized by SEM and TEM techniques. Fig. 1a shows a typical SEM image of the as-prepared products, the spherical products with uniform morphology can be clearly observed. The obtained TiO2 microspheres have a relative wide particle size distribution and most of them are intact with a diameter of ca. 1.1 μm. From the inset magnifying SEM image of the broken sphere, we can see that there is a huge cavity inside the sphere, indicating the hollow nanostructure. Moreover, the surface of the microsphere is obviously coarse, assembled with abundant TiO2 nanoparticles. Fig. 1b is a typical TEM image of the TiO2 microspheres. The obtained TiO2 materials were partly empty spheres and have a similar sphere-in-sphere structure, consistent with the SEM observation. Fig. 1c shows a HRTEM image of TiO2-550. As marked in the image, the lattice fringe spacing of each nanocrystal was measured to be 0.35 nm, corresponding to the (101) plane of the anatase TiO2 crystal phase. XRD was used to characterize the crystal phase structure of the obtained samples. As shown in the Fig. 1d, the as-synthesized and calcined products are both typical anatase TiO2 (JCPDS no.: 21-1272), and no other diffraction peaks appeared indicating the high purity of the prepared TiO2 nanostructures. However, the intensities of the diffraction peaks greatly increased after calcination at 550 °C, suggesting a high crystallinity of the product. | ||
| Fig. 1 (a) SEM, (b) TEM, (c) HRTEM images; (d) XRD patterns of the typical TiO2 products before and after calcined at 550 °C. | ||
As we known, the photocatalytic activity was significantly influenced by many factors including the crystalline phase, particle size, crystallinity, surface area, and porosity.17–20 Considering that, the effect of the calcination temperature on the photocatalytic performance of the TiO2 samples were investigated. Fig. 2a–d show the corresponding TEM images of the TiO2 products calcined at different temperature range from 550 to 850 °C. As increasing the calcination temperature, the grain size of the TiO2 microspheres began to enlarge based on the TEM images. Especially, it was worth mentioned that the rattle-type structure of the TiO2 microspheres still remained well even at high calcination temperature of 850 °C, indicating a good structural stability, which is very helpful for their practical applications.
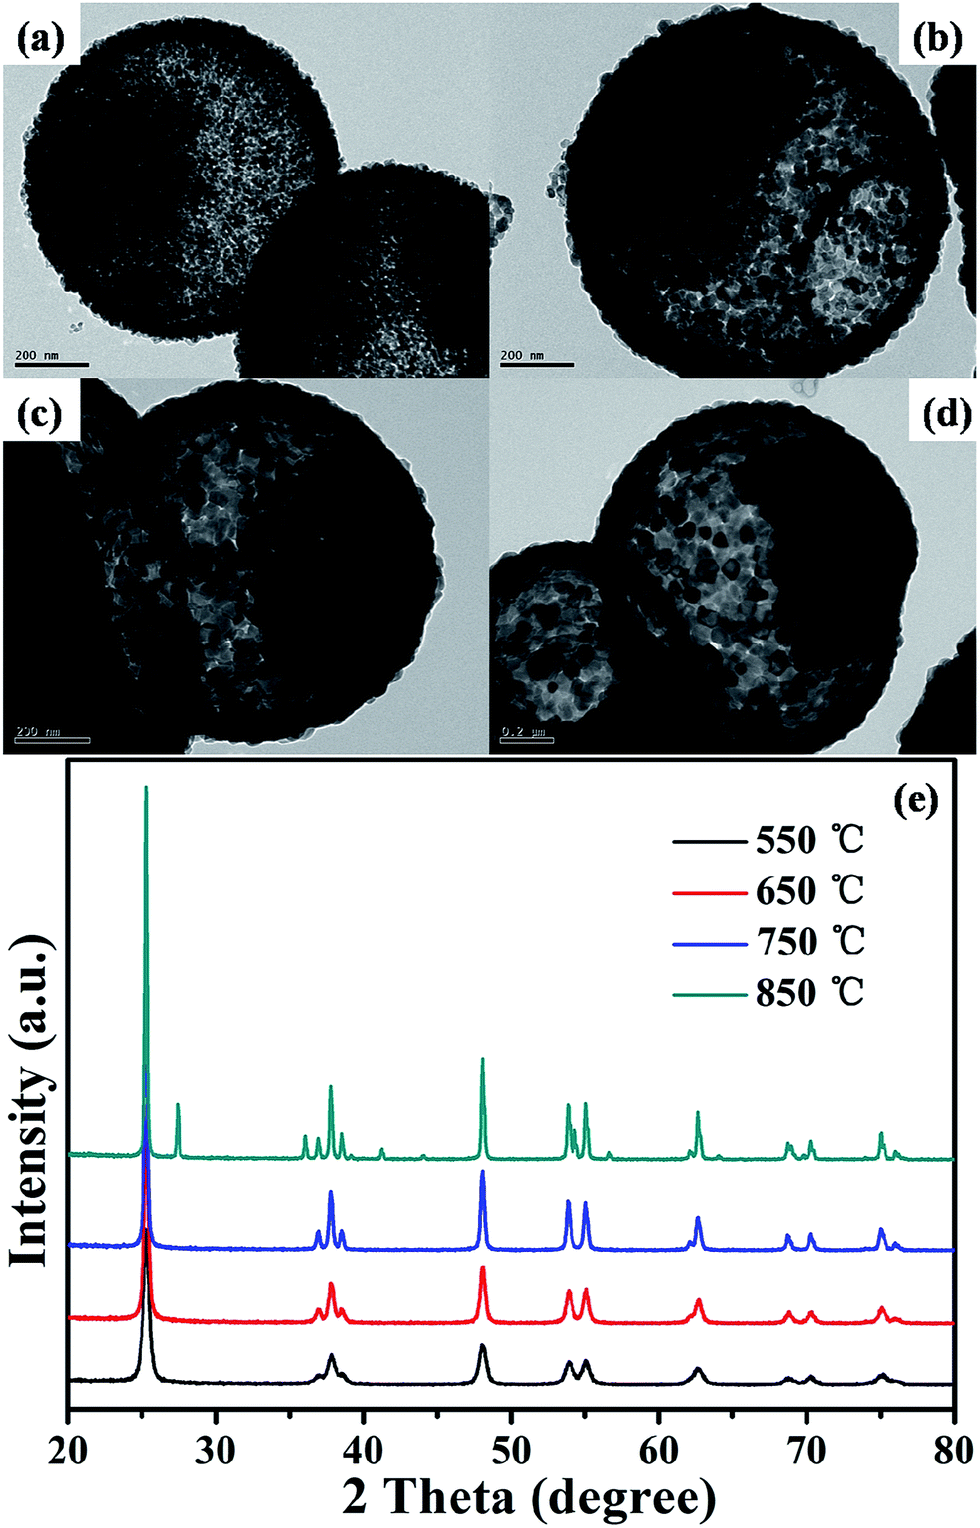 | ||
| Fig. 2 TEM images of (a) TiO2-550, (b) TiO2-650, (c) TiO2-750, (d) TiO2-850; (e) XRD patterns of the TiO2 products calcined at different temperatures. | ||
XRD technique was utilized to monitor subtle changes in terms of the crystal growth or possible phase transition. As indicated in the Fig. 2e, the anatase phase of TiO2 materials was kept well in the range of calcination temperatures from 550 to 750 °C. In addition, we found that the intensity of anatase peaks gradually increases suggesting an enhancement of crystallization and the growth of the crystal size. To a certain extent, that is in favor of improving the photocatalytic activity, because high crystallinity is helpful to the charge transfer of the excited electron and electron hole pair, thus the recombination reduced.37 The crystal size was calculated using the Scherrer equation at 2θ = 25.3° corresponding to the (101) plane diffraction of anatase TiO2.38 When the temperature increased from 550 to 650 °C, the crystal size increased from 16.7 to 21.5 nm, and then increased sharply from 21.5 to 32.2 nm once the calcination temperature increased from 650 to 750 °C. This is because higher thermal treatment temperature will lead to better crystallinity. As predicted, crystalline phase transition from anatase to rutile began to occur upon the calcination temperature reached 850 °C.39 The TiO2 materials obtained were mixed crystal phase consist of anatase and rutile phase. It was generally acknowledged that the anatase phase of TiO2 has a much better photocatalytic activity than rutile.40–42 The reason is that anatase including a higher reduction potential and a lower recombination rate of photogenerated carriers in comparison to the rutile products. The work will be discussed in the following sections.
The textural properties of the TiO2 samples were characterized by N2 adsorption–desorption isotherms. Seen from the Fig. 3a, the TiO2-550 sample exhibited an obvious hysteresis loop, which was attributed to a type IV isotherm, revealing the existence of mesopores in the material.18 Interestingly, the corresponding pore size distribution (Fig. 3b) indicates two kinds types of pores existed in the product, centered at around 2.9 nm and 18.7 nm, respectively. Those are mainly originated from the primary nanocrystals aggregate and connections of the spherical nanoparticles. The TiO2-550 product has a BET surface area of 103.5 m2 g−1 and a pore volumes of 0.42 cm3 g−1. As increasing the calcination temperature, the BET surface area and the corresponding pore volumes both gradually decreased, and but the crystal size enlarged, indicating the structure and surface properties were affected by the thermal treatment temperature. More information was systematically listed in Table 1.
 | ||
| Fig. 3 (a) N2 adsorption–desorption isotherm, (b) the corresponding pore size distribution of TiO2-550 product. | ||
| Calcination T/°C | SBETa (m2 g−1) | Pore volumeb (cm3 g−1) | Pore sizeb (nm) | Crystal sizec (nm) |
|---|---|---|---|---|
| a The BET surface area was determined by BET method using the desorption data in P/P0 range from 0.05 to 0.3.b Pore volume and pore size were determined by the desorption data at P/P0 = 0.95.c Crystal sizes were calculated by Scherrer equation from XRD data. | ||||
| 550 | 103.5 | 0.42 | 15.2 | 16.7 |
| 650 | 85.6 | 0.32 | 18.8 | 21.5 |
| 750 | 52.6 | 0.20 | 3.5 | 32.2 |
| 850 | 33.4 | 0.09 | 3.2 | 48.2 |
3.2 Formation mechanism
To further explore the formation mechanism of the rattle-type TiO2 hollow nanostructures, a series of products were also prepared by varying the reaction time and precursor compositions. Fig. 4 shows the structural evolution of the products obtained at different reaction time. It was found that only smooth, solid spherical particles were obtained after the reaction time was conducted for 1 h (Fig. 4a). Once the reaction time was conducted for 2.5 h, the surface of the products produced tiny bulges (Fig. 4b) and became much coarser in the following 0.5 h (Fig. 4c). More interesting is the solid spherical particles rapidly formed a rattle-type structure similar as ball-in-ball structure within the 0.5 h (Fig. 4d). Nevertheless, it did not have many changes on the structure even through the reaction time was extended to 48 h (Fig. 4e) and 96 h (Fig. 4f). Hence, we could draw a conclusion that once the rattle-type structure was formed and very stable.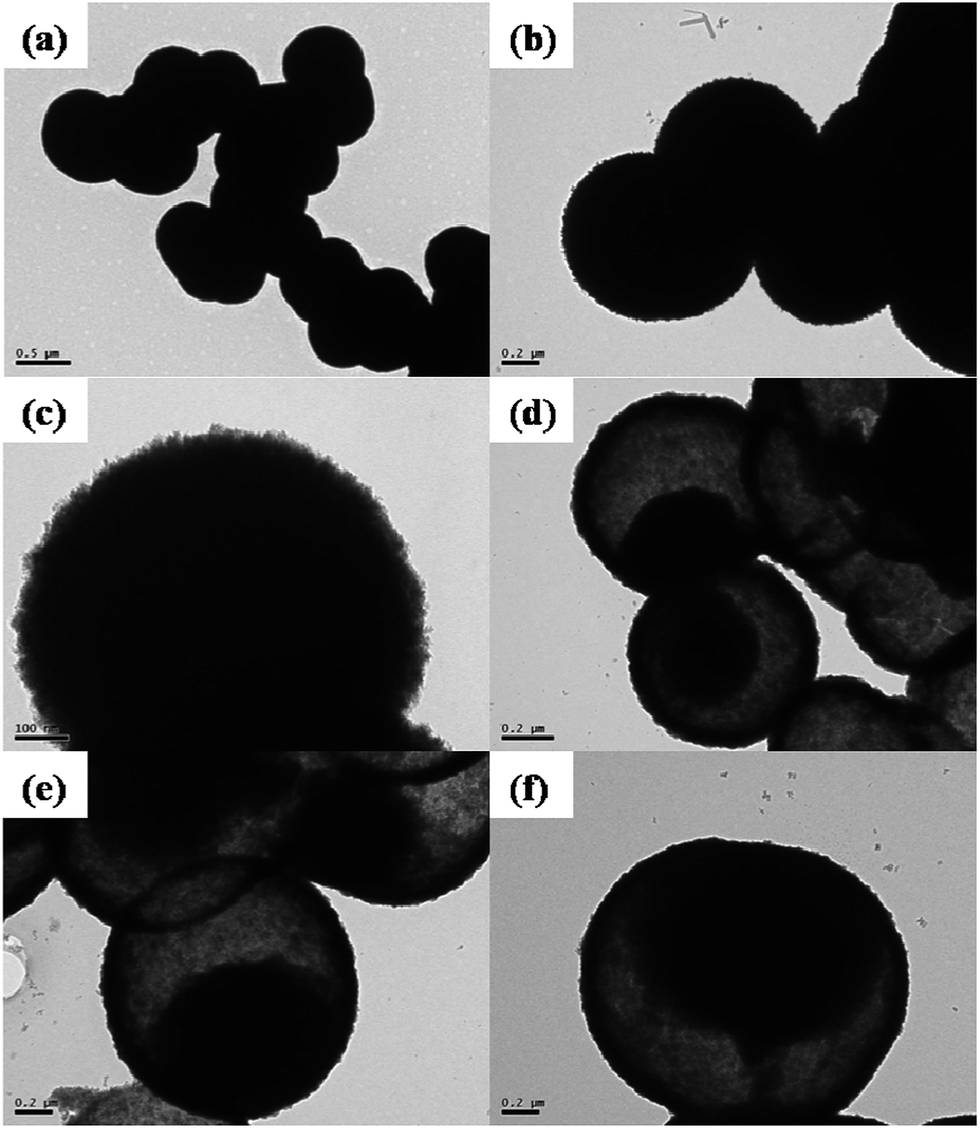 | ||
| Fig. 4 TEM images of the TiO2 microspheres synthesized at different reaction time: (a) 1 h, (b) 2.5 h, (c) 3 h, (d) 3.5 h, (e) 48 h, (f) 96 h. | ||
At the same time, we investigated the effects of other reaction conditions on the structure of the products. As displayed in Fig. 5a, it only formed the aggregate solid TiO2 when 10 ml of distilled water were added to the reaction system. Then increased to 15 ml of water, the rattle-type morphology began to emerge (Fig. 5b). The structure would remain and didn't change too much even though 50 ml of water used (Fig. 5e). However, when we continue to increase the dosage of water to 80 ml, only the solid spheres were obtained (Fig. 5f). The morphology changes of the obtained TiO2 microspheres are shown in Fig. 5g. We supposed a possible reason of the difference was that the excess water (e.g. 80 ml) would destroy the hydroalcoholic system composed of glycerol and H2O. When Ti(SO4)2 was added to the reaction system, it would firstly react with H2O and lead to the formation of TiOSO4. Then, the TiOSO4 would continue to react with abundant water and generate the H2TiO3, which would transfer into TiO2 nanoparticles during the hydrothermal process.
 | ||
| Fig. 5 TEM images of the TiO2 microspheres synthesized with different amounts of H2O: (a) 10 ml, (b) 15 ml, (c) 20 ml, (d) 30 ml, (e) 50 ml, (f) 80 ml; (g) Schematic illustration of the morphology changes. | ||
To further confirm above assumption, some comparative experiments were designed to reveal the truth (Fig. 6). Firstly, the order of the raw material added the reaction system was changed (Fig. 6a–b). Ti(SO4)2 and deionized water were firstly mixed together and stirred at room temperature for 15 min, then glycerol was added into the clear solution and stirred for another 15 min. After that, the mixed solution was transferred into a Teflon-lined stainless steel autoclave at 110 °C for 6 h. The obtained TiO2 solid sphere (Fig. 6a) was similar to the sample shown in Fig. 5f. This means H2O really inhibits the formation of titanium precursor. Herein, it was concluded that H2O plays a key role in control of morphology of the obtained TiO2 microspheres.
 | ||
| Fig. 6 TEM images of the TiO2 spheres synthesized with different experimental methods: (a) and (b) solid TiO2 spheres; (c) and (d) hollow TiO2 microspheres. | ||
According to the present results, the previous experimental scheme was also made some adjustments. Firstly, 20 ml of water and 11.97 g of glycerol was mixed and stirred for 20 min. Subsequently, the extra 60 ml of water was added and continued to stir for 10 min. Then, the solution was added into a Teflon-lined stainless steel autoclave at 110 °C for 6 h. At the present modified method, the total hollow TiO2 microspheres could be obtained, as shown in Fig. 6c and d, which was completely different with the solid spheres (Fig. 5f). This is because when the extra water was added in the system, the titanium precursor could rapidly hydrolyze into TiO2 nanoparticles. Once the hydrothermal treatment was employed, enough water made the response more intense, improved the rate of the dissolution and rearrangement of the formed solid spheres. That would accelerate the process of Ostwald ripening. On account of the formation of more nucleation centers in the presence of higher concentrated H2O, the diameters of TiO2 hollow microspheres decrease compared with the rattle-type TiO2 hollow microspheres.
FT-IR spectra reveal the change of the composition of the obtained TiO2 microspheres at the different reaction time. As demonstrated in the Fig. 7a, the TiO2 precursor before hydrothermal treatment displayed stronger absorbance peaks at 2886 and 2940 cm−1, which can be attributed to the vibrations of C–H bond of glycerol. And peaks between 1000 and 1200 cm−1 can be corresponding to the C–O structure of glycerol. As increasing the reaction time and thermal treatment, these peaks would be weakened until disappeared, indicating gradually reduction of organic molecules on the spherical surface. Additionally, the absorption peaks at 3419 and 1631 cm−1 are associated with the –OH functionality and the peak at 2354 cm−1 results from asymmetrical stretching vibration of O![[double bond, length as m-dash]](https://www.rsc.org/images/entities/char_e001.gif) CO.43,44 EDX patterns (Fig. 7b and c) revealed that the obtained rattle-type TiO2 microspheres at different reaction time were mainly composed of Ti and O elements. And S elements (Fig. 7b) are attributed to the solid spheres contain a small number of hydrolysable ligands such as –SO4, while Si elements was from the substrate. Hence, the results are in agreement with our previous analysis.
CO.43,44 EDX patterns (Fig. 7b and c) revealed that the obtained rattle-type TiO2 microspheres at different reaction time were mainly composed of Ti and O elements. And S elements (Fig. 7b) are attributed to the solid spheres contain a small number of hydrolysable ligands such as –SO4, while Si elements was from the substrate. Hence, the results are in agreement with our previous analysis.
 | ||
| Fig. 7 (a) FT-IR spectra of the TiO2 microspheres synthesized at 0 h, 1 h, 6 h, and TiO2-550; corresponding EDX patterns of the TiO2 microspheres synthesized at (b) 1 h, (c) 6 h; (d) schematic illustration for the formation of rattle-type TiO2 hollow microspheres. | ||
Based on the previous experimental results and analysis, a possible formation mechanism of the rattle-type TiO2 hollow microspheres is as follows: during the solvothermal condition, the TiO2 building clusters may be generated through hydrolysis reaction of the titanium precursor, and then aggregate into spheres because of the high surface energy. The Ostwald ripening process occurred in the presence of water,45,46 leading to the dissolution and re-deposition of the poorly crystallized solid spheres' surface and the outer shell resulted from the continuous hydrolysis. Then, water continuously diffused through the shell, which caused the inner core gradually dissolved and recrystallized on the shell of the spheres to finally form rattle-type TiO2 hollow spheres. The aggregation of TiO2 nanoparticles contributed to the formation of the mesoporous structure. It should be noted that the water produced by the etherifying reactions between glycerol and glycerol as well as added water, is essential for the formation of the rattle-type TiO2 hollow microspheres. Fig. 7d briefly illustrates the formation process of rattle-type TiO2 hollow microspheres.
3.3 Photocatalytic properties
Considering that the effect of calcination temperature on the crystal phase and size of TiO2 products, which will directly affect their performances. Therefore, the photocatalytic activity of a series of TiO2 samples prepared with different calcination temperatures was evaluated by the photodegradation of methyl orange (MO). For comparison, the degradation abilities of P25, an excellent commercial TiO2 photocatalyst, were also investigated under the same conditions. As shown in Fig. 8a, the photocatalytic results revealed that the photocatalytic performance of TiO2 enhanced with the increase of calcination temperature. In particular, MO can be degraded completely within 15 min under the ultraviolet light irradiation when using the sample calcined at 750 °C as the catalyst, which exhibited a superior photocatalytic activity in comparison to other photocatalysts including P25. Thus, as expected, the degradation rate of the product calcined at 850 °C was decreased and the total degradation time was extended to 20 min. That was caused by the impurity of crystal phase, as mentioned in XRD analysis. Fig. 8b shows the temporal evolution of the spectral changes of MO solution mediated by the typical TiO2-750 photocatalyst. The inset digital images showed the color changes of the resultant liquid from orange to completely transparent colorless, which indirectly tracked the reaction process. More importantly, the TiO2-750 photocatalyst exhibited a good cycling stability, the degradation rates were scarcely changed after 5 cycle times, as displayed in Fig. 8c. | ||
| Fig. 8 (a) Time courses of MO concentration in the MO system with TiO2 microspheres obtained from different calcination temperatures, (b) the photodegradation under UV light irradiation of the MO in the presence of TiO2-750, (c) the cycling stability of TiO2-750. | ||
It has been demonstrated that the photocatalytic activity could be greatly be enhanced by doping TiO2 with noble metals such as Au, Pt, Ag, and Pd.47–49 Herein, Ag-doped TiO2-550 (namely, Ag/TiO2-550) has been synthesized by the impregnation method. As shown in Fig. 9a, TEM image clearly revealed that the some Ag nanoparticles were homogeneously encapsulated in the TiO2-550 microspheres. This could be further confirmed by EDX patterns (Fig. 9b). Additionally, no significant Ag species were detected indicating that there were nearly no Ag nanoparticles on the outer surface, almost all the Ag nanoparticles were encapsulated in the TiO2-550 microspheres. Fig. 9c shows the XRD pattern of the obtained Ag/TiO2-550 sample. Besides the intensive diffraction peaks assigned to well-crystallized anatase phase TiO2, the sharp peaks at around 2θ = 44.3, 64.4 and 77.4° were corresponding to the (200), (220) and (311) facets of face-centered cubic Ag (JCPDS no. 65-2871). Fig. 9d displays the UV-vis diffuse reflectance spectra of Ag/TiO2-550 and TiO2-550 samples. Compared with pure TiO2-550 sample, the Ag/TiO2-550 exhibited an slightly additional peak in the visible range between 450 and 650 nm, this can be attributed to the plasmon effect of Ag.48 Calculated by the inset patterns of Fig. 9d, the bandgap energy of Ag/TiO2-550 is about 2.82 eV, which is slightly lower than that of TiO2-550 (3.02 eV). Fig. 10a shows XPS spectra of TiO2-550 and Ag/TiO2-550 samples. As was observed, both samples appear sharp peaks at 458 eV and 531 eV, which can be attributed to the binding energies of Ti 2p photoelectrons of Ti4+ and O 1s photoelectrons of O2−, respectively. On the other hand, the Ag/TiO2-550 sample shows obvious two peaks at 369 eV and 375 eV (inset pattern in Fig. 10a), corresponding to the binding energies of Ag 3d5/2 and Ag 3d3/2, respectively.49 The above results indicated that the Ag nanoparticles had been successfully doped into the TiO2 product. The photocatalytic performance of the Ag/TiO2-550 and Ag/TiO2-750 sample was examined under the same conditions. As shown in Fig. 10b, the MO molecules can be completely decomposed in the presence of the Ag/TiO2-550 catalysts within 20 min, which is superior to the pure TiO2-550 (25 min). Meanwhile, the photocatalytic performance of Ag/TiO2-750 was further enhanced and MO could be degraded completely within 10 min under the ultraviolet light irradiation. Hence, it can be clearly seen that Ag-doped TiO2 samples showed better photocatalytic activity than that of pristine TiO2-550 and TiO2-750, respectively.
 | ||
| Fig. 9 (a) TEM image, (b) EDX pattern, (c) XRD pattern, (d) UV-vis spectra of Ag/TiO2-550. | ||
 | ||
| Fig. 10 (a) XPS spectra of TiO2-550 and Ag/TiO2-550 samples; the inset is a high-resolution XPS spectrum of Ag 3d of Ag/TiO2-550 sample. (b) Time courses of MO concentration in the MO system with different TiO2 catalysts. | ||
To explain the superior photocatalytic performance of the Ag/TiO2 catalysts, a possible photocatalytic mechanism representing the charge transfer process in the hybrids is illustrated in Scheme 1.49,50 Under UV light illumination, electron–hole pairs are produced in the conduction and valence bands of TiO2. The absorption of a photon excites an electron to the conduction band (eCB−) generating a positive hole in the valence band (hVB+). Then electron would transfer from TiO2 to Ag nanoparticle due to the match of energy. The doping of Ag nanoparticles into TiO2 may partly improve the separation efficiency of photogenerated electron–hole pairs. As a result, the photocatalytic activity of TiO2 could be improved due to the synergistic effect between TiO2 and Ag nanoparticles. After that, the photoexcited electrons can be trapped by the adsorbed oxygen or dissolved in the solution to form superoxide anion (˙O2−). Moreover holes could react with water or hydroxide ions to produce highly reactive ˙OH radicals which were known to be the most oxidizing species. The MO molecule would be oxidized into CO2 and H2O by the superoxide anion and hydroxyl radicals what have strong oxidative performance. Besides that, it is also worth mentioning that this structure of the rattle-type TiO2 was also offered an improved catalytic activity. Because the unique structure allows multiple reflections of UV light within the interior cavity, and the light source was effectively used.
 | ||
| Scheme 1 A schematic illustration of the photocatalytic mechanism of Ag/TiO2 catalyst. | ||
4. Conclusions
In summary, we demonstrate a template-free, simple, and environmentally benign route for preparing the rattle-type TiO2 microspheres and hollow TiO2 microspheres. The investigation of the reaction conditions indicated that the amount of water and the order of the added raw materials played a crucial role in determining the morphology and structure of the products. Based on the experimental results, the formation mechanism of porous TiO2 involved an oriented attachment process. The photocatalytic tests showed that the calcination temperature had a profound effect on the photocatalytic activity of the TiO2 products. The maximum photocatalytic activity was achieved for the materials calcined at 750 °C, which had a superior activity in comparison to the commercial P25. In addition, Ag-doped TiO2 photocatalyst exhibited higher photocatalytic activity than the pure TiO2 calcined at 550 °C. The enhancement was mainly attributed to their unique nanostructures and synergistic effect. Such yolk–shell TiO2 microspheres with improved photocatalytic performance may find wide-ranging applications in various fields including catalysis, electrochemistry, separation, purification, and so on.Acknowledgements
The work is financially support by the National Natural Science Foundation of China (11275121, 21241002, 61174011, 21371116), Science and Technology Commission of Shanghai Municipality (13DZ2295200), Innovation Program of Shanghai Municipal Education Commission (12YZ013), and Program for Innovative Research Team in University (IRT13078).Notes and references
- D. L. Shieh, Y. S. Lin, J. H. Yeh, S. C. Chen, B. C. Lin and J. L. Lin, Chem. Commun., 2012, 48, 2528–2530 RSC.
- H. Wang, F. Sun, Y. Zhang, L. Li, H. Chen, Q. Wu and J. C. Yu, J. Mater. Chem., 2010, 20, 5641–5645 RSC.
- X. Yang, A. Wolcott, G. Wang, A. Sobo, R. C. Fitzmorris, F. Qian, J. Z. Zhang and Y. Li, Nano Lett., 2009, 9, 2331–2336 CrossRef CAS PubMed.
- Y. Lin, S. Zhou, X. Liu, S. Sheehan and D. Wang, J. Am. Chem. Soc., 2009, 131, 2772–2773 CrossRef CAS PubMed.
- E. L. Ratcliff, B. Zacher and N. R. Armstrong, J. Phys. Chem. Lett., 2011, 2, 1337–1350 CrossRef CAS.
- T. Salim, Z. Yin, S. Sun, X. Huang, H. Zhang and Y. M. Lam, ACS Appl. Mater. Interfaces, 2011, 3, 1063–1067 CAS.
- J. Briscoe, D. E. Gallardo, S. Hatch, V. Lesnyak, N. Gaponik and S. Dunn, J. Mater. Chem., 2011, 21, 2517–2523 RSC.
- X. Chen, L. Liu, P. Y. Yu and S. S. Mao, Science, 2011, 331, 746–750 CrossRef CAS PubMed.
- X. Lang, H. Ji, C. Chen, W. Ma and J. Zhao, Angew. Chem., Int. Ed., 2011, 50, 3934–3937 CrossRef CAS PubMed.
- B. Liu and E. S. Aydil, J. Am. Chem. Soc., 2009, 131, 3985–3990 CrossRef CAS PubMed.
- H. Tong, S. Ouyang, Y. Bi, N. Umezawa, M. Oshikiri and J. Ye, Adv. Mater., 2012, 24, 229–251 CrossRef CAS PubMed.
- H. G. Yang, C. H. Sun, S. Z. Qiao, J. Zou, G. Liu, S. C. Smith, H. M. Cheng and G. Q. Lu, Nature, 2008, 453, 638–641 CrossRef CAS PubMed.
- S. Liu, E. Guo and L. Yin, J. Mater. Chem., 2012, 22, 5031–5041 RSC.
- M. Ye, Q. Zhang, Y. Hu, J. Ge, Z. Lu, L. He, Z. Chen and Y. Yin, Chem.–Eur. J., 2010, 16, 6243–6250 CrossRef CAS PubMed.
- Q. Zhang, J. B. Joo, Z. Lu, M. Dahl, D. Q. L. Oliveira, M. Ye and Y. Yin, Nano Res., 2010, 4, 103–114 CrossRef PubMed.
- C. Wang, L. Yin, L. Zhang, Y. Qi, N. Lun and N. Liu, Langmuir, 2010, 26, 12841–12848 CrossRef CAS PubMed.
- Y. Hu, H. L. Tsai and C. L. Huangk, J. Eur. Ceram. Soc., 2003, 23, 691–696 CrossRef CAS.
- H. J. Zhang, G. D. Du, W. Q. Lu, L. L. Cheng, X. D. Zhu and Z. Jiao, CrystEngComm, 2012, 14, 3793–3801 RSC.
- M. Zukalova, A. Zukal, L. Kavan, M. K. Nazeeruddin, P. Liska and M. Gratzel, Nano Lett., 2005, 5, 1789–1792 CrossRef CAS PubMed.
- X. Wang, L. Cao, D. Chen and R. A. Caruso, ACS Appl. Mater. Interfaces, 2013, 5, 9421–9428 CAS.
- Y. G. Guo, Y. S. Hu and J. Maier, Chem. Commun., 2006, 2783–2785 RSC.
- H. Li, Z. Bian, J. Zhu, D. Zhang, G. Li, Y. Huo, H. Li and Y. Lu, J. Am. Chem. Soc., 2007, 129, 8406–8407 CrossRef CAS PubMed.
- H. Li, Y. Zeng, T. Huang, L. Piao, Z. Yan and M. Liu, Chem.–Eur. J., 2012, 18, 7525–7532 CrossRef CAS PubMed.
- D. Chen, F. Huang, Y. B. Cheng and R. A. Caruso, Adv. Mater., 2009, 21, 2206–2210 CrossRef CAS PubMed.
- N. Tetreault, E. Horvath, T. Moehl, J. Brillet, R. Smajda, S. Bungener, N. Cai, P. Wang, S. M. Zakeeruddin, L. Forro, A. Magrez and M. Gratzel, ACS Nano, 2010, 4, 7644–7650 CrossRef CAS PubMed.
- U. Wurfel, J. Wagner and A. Hinsch, J. Phys. Chem. B, 2005, 109, 20444–20448 CrossRef CAS PubMed.
- S. J. Sun, W. Q. Yu, Y. L. Zhang, X. Q. Jiang and F. Q. Zhang, Cell Prolif., 2013, 46, 685–694 CrossRef CAS PubMed.
- M. Ye, J. Gong, Y. Lai, C. Lin and Z. Lin, J. Am. Chem. Soc., 2012, 134, 15720–15723 CrossRef CAS PubMed.
- D. Chen and R. A. Caruso, Adv. Funct. Mater., 2013, 23, 1356–1374 CrossRef CAS PubMed.
- H. J. Zhang, P. P. Xu, G. D. Du, Z. W. Chen, K. Oh, D. Y. Pan and Z. Jiao, Nano Res., 2010, 4, 274–283 CrossRef PubMed.
- J. B. Joo, I. Lee, M. Dahl, G. D. Moon, F. Zaera and Y. Yin, Adv. Funct. Mater., 2013, 23, 4246–4254 CrossRef CAS PubMed.
- J. B. Joo, Q. Zhang, I. Lee, M. Dahl, F. Zaera and Y. Yin, Adv. Funct. Mater., 2012, 22, 166–174 CrossRef CAS PubMed.
- S. Shang, X. Jiao and D. Chen, ACS Appl. Mater. Interfaces, 2012, 4, 860–865 CAS.
- H. G. Yang and H. C. Zeng, J. Phys. Chem. B, 2004, 108, 3492–3495 CrossRef CAS.
- G. J. Ke, H. Y. Chen, C. Y. Su and D. B. Kuang, J. Mater. Chem. A, 2013, 1, 13274–13282 CAS.
- Y. Zhao, F. Pan, H. Li, D. Zhao, L. Liu, G. Q. Xu and W. Chen, J. Phys. Chem. C, 2013, 117, 21718–21723 CAS.
- G. Benko, B. Skårman, R. Wallenberg, A. Hagfeldt, V. Sundstrom and A. P. Yartse, J. Phys. Chem. B, 2003, 107, 1370–1375 CrossRef.
- J. Zhong, F. Chen and J. Zhang, J. Phys. Chem. C, 2010, 114, 933–939 CAS.
- N. T. Nolan, M. K. Seery and S. C. Pillai, J. Phys. Chem. C, 2009, 113, 16151–16157 CAS.
- A. Fujishima, X. Zhang and D. A. Tryk, Surf. Sci. Rep., 2008, 63, 515–582 CrossRef CAS PubMed.
- J. B. Joo, M. Dahl, N. Li, F. Zaera and Y. Yin, Energy Environ. Sci., 2013, 6, 2082–2092 CAS.
- A. L. Linsebigler, G. Lu and J. T. Yates, Chem. Rev., 1995, 95, 735–758 CrossRef CAS.
- Z. Bian, J. Zhu, F. Cao, Y. Lu and H. Li, Chem. Commun., 2009, 3789–3791 RSC.
- Z. Bian, J. Zhu, J. Wang, S. Xiao, C. Nuckolls and H. Li, J. Am. Chem. Soc., 2012, 134, 2325–2331 CrossRef CAS PubMed.
- B. Liu and H. C. Zeng, Small, 2005, 1, 566–571 CrossRef CAS PubMed.
- C. C. Yec and H. C. Zeng, J. Mater. Chem. A, 2014, 2, 4843–4851 CAS.
- C. An, W. Jiang, J. Wang, S. Wang, Z. Ma and Y. Li, Dalton Trans., 2013, 42, 8796–8801 RSC.
- B. Jiang, Z. Hou, C. Tian, W. Zhou, X. Zhang, A. Wu, G. Tian, K. Pan, Z. Ren and H. Fu, CrystEngComm, 2013, 15, 5821–5827 RSC.
- H. Zhang, G. Wang, D. Chen, X. J. Lv and J. H. Li, Chem. Mater., 2008, 20, 6543–6549 CrossRef CAS.
- S. Wang, H. Qian, Y. Hu, W. Dai, Y. Zhong, J. Chen and X. Hu, Dalton Trans., 2013, 42, 1122–1128 RSC.
| This journal is © The Royal Society of Chemistry 2014 |