 Open Access Article
Creative Commons Attribution 3.0 Unported Licence
The effect of temperature on the dynamics of a homogeneous oscillatory system operated in batch and under flow
Paulo A.
Nogueira
a,
Bruno C.
Batista
a,
Roberto B.
Faria
*b and
Hamilton
Varela
*ac
aInstitute of Chemistry of São Carlos, University of São Paulo, PO Box 780, 13560-970, São Carlos, SP, Brazil. E-mail: varela@iqsc.usp.br
bInstituto de Química, Universidade Federal do Rio de Janeiro, Av. Athos da Silveira Ramos 149, CT, Bloco A, 21941-909, Rio de Janeiro, RJ, Brazil. E-mail: faria@iq.ufrj.br
cFritz Haber Institute of the Max Planck Society, Faradayweg 4-6, D-14195 Berlin, Germany
First published on 18th June 2014
Abstract
The effect of temperature on a network of chemical reactions is not obvious, especially when compared to the effect exerted on elementary steps. There are few reports regarding the estimation of parameters such as activation energies for oscillating chemical systems. Still less investigated is the importance of the relative distance from thermodynamic equilibrium on the way in which temperature influences the oscillators' dynamics – a crucial aspect for the understanding of chemical and bio-chemical oscillating networks. In this paper we use the bromate–oxalic acid–acetone–cerium oscillatory system to study the influence of temperature under close and far-from-equilibrium regimes. The research was carried out under identical conditions for batch and flow (in a continuous flow stirred tank reactor, CSTR) regimes, and the main oscillation features were preserved, so that it was possible to isolate the effect of flow. Overall, increasing the flow results in an increase of the oscillatory frequency. The apparent oscillatory activation energy was found to decrease from 72 ± 6 kJ mol−1, for the system operated in batch, to 50 ± 2 kJ mol−1, under the flow regime. The role of the distance from the thermodynamic equilibrium on the temperature dependence is generalized and discussed in connection with other systems. Numerical simulations using the Brusselator model under batch and flow regimes further helped the discussion of the main experimental results.
1. Introduction
A network of chemical reactions under oscillatory regime might display a rather unusual response to temperature changes. Examples include non-Arrhenius behaviors such as temperature compensation and overcompensation.1–5 These infrequent effects play a decisive role, for instance, in temporally organized patterns found in living systems which are commonly known to be rather insensitive to temperature and other parameters such as pH, etc. Temperature compensation is particularly important as part of the wide-ranging homeostatic mechanism, and it underlies many oscillatory mechanisms in living systems (cf. circadian, ultradian and some neuronal rhythms), cf.ref. 6 and references therein. In terms of individual reactions, temperature compensation results from the balance among the weighted activation energies of frequency-increasing and frequency-decreasing elementary steps in a reaction network.1,2,7Despite the comparable simplicity of chemical oscillators, results obtained in such designed in vitro systems can provide valuable information on some structural aspects of more complex and sometimes less tractable biochemical oscillators.8–10 Indeed, the observation of temperature compensation in comparable simpler (electro)chemical oscillators5,11,12 attests their importance as model systems. In most cases, the effect of temperature in these oscillators has been discussed in terms of the temperature dependence of the oscillatory frequency, as firstly suggested by Körös.13
One of the most prominent features of living systems is that their internal organization is kept at the expense of exporting entropy to the environment. In order to stay alive, these open systems import (or are fed with) high free energy materials and reject the degraded ones. Already in 1950, von Bertalanffy14 recognized that “from the physical point of view, the characteristic state of the living organism is that of an open system”, and as such, living systems can thrive by “maintaining themselves in exchange of materials with environment, and in continuous building up and breaking down of their components”. Therefore, the position with respect to the thermodynamic equilibrium is a key parameter to the understanding and description of the actual state of open systems. In chemical systems, the departure from the state of thermodynamic equilibrium can be tuned by the rate at which reactants are fed and products (and also unreacted species and intermediates) are removed from the reaction vessel. Tuning this parameter results on non-trivial changes in most reaction rates. Hence, the effect exerted by temperature is expected to depend on the distance from thermodynamic equilibrium.
A literature survey reveals a lack of reports dealing with the influence of the relative position with respect to thermodynamic equilibrium on the way in which temperature influences the oscillators' dynamics. In a seminal report, Rössler15 conjectured on the importance of flow when designing a temperature-compensated homogenous chemical oscillator. The discussion was carried out in terms of a theoretical model for a relaxation oscillator. Insofar, however, it seems that no verification of this expectation has been provided. Ruoff and co-workers16 studied the effect of temperature on the dynamics of some bromate oscillators catalyzed by cerium, and reported a considerable decrease in the activation energy when the system was operated in a continuous flow stirred tank reactor (CSTR), when compared with the batch regime. The effect of flow and/or temperature on the dynamics has been reported for some oscillatory systems such as the hydrogen peroxide–thiosulfate–sulfite flow system,11,17 pH oscillators,12 and the Bray reaction.18 We have recently studied19 the time evolution of the apparent oscillatory activation energy for a BZ-like oscillator operated in batch as it approaches the thermodynamic equilibrium. As the main result, we observed that the apparent oscillatory activation energy increases as reactants are consumed and products accumulate inside the reactor. A detailed investigation of formic acid electro-oxidation on platinum5 revealed the predominance of highly non-Arrhenius temperature dependence over a wide parameter window. The system was characterized in terms of the distance from the thermodynamic equilibrium and temperature compensation was found to prevail at considerably high applied currents or, equivalently, at the farthest distance from equilibrium.
The present contribution results from our interest to understand the combined effect of temperature and distance from the thermodynamic equilibrium. We decided to undergo such an investigation using the bromate–oxalic acid–acetone–cerium system20,21 as a model system. This system was chosen mainly because of its robustness and low sensitivity of its properties, such as the oscillation morphology, on temperature and flow rates. The constancy of such features might indicate that the underlying chemistry remains unchanged at distinct flow rates and temperatures. As far as the effect of temperature is concerned, this system has been studied under both batch and flow regimes.22,23,24,25 In contrast to previous reports by other authors, however, the systematic experiments reported here allowed at isolating as much as possible the contribution of the flow on the temperature dependence. We initially optimized the system in order to compare the effect of temperature in batch and flow. In this way, the open and closed systems were studied under identical conditions of stirring rate, temperature, and concentrations. In order to go deeper in the understanding of the role played by the distance from thermodynamic equilibrium on the system's dynamics, we carried out numerical simulations using the Brusselator model under batch and flow regimes. Finally, the results are discussed in connection with other processes in electro-, bio- and chemical systems.
2. Experimental section
The cylindrical glass reactor employed in all experiments is 90 mm high and 47 mm in diameter. The temperature was controlled by water circulation through its glass jacket, with the aid of a thermostatic bath (Microquimica, model MQBTC99-20) and monitored using a digital thermometer (Tec-Lab). The Teflon reactor cap contains the holes to allow the use of a platinum electrode and a reversible hydrogen electrode, filled with aqueous sulfuric acid solution with concentration identical to that found in the reactor. The potential difference was measured with a multimeter (Minipa, ET2201). Further experimental details can be found elsewhere.19,26 For open reactor experiments (CSTR) two peristaltic pumps (Milan, 640) were used. The system was fed with three aqueous H2SO4 solutions: solution A (CH3COCH3 and (COOH)2), solution B (NaBrO3), and solution C (Ce2(SO4)3). In this case, all solutions were placed in jacketed flasks and kept inside a thermostatic bath to assure the same temperature as that inside the reaction vessel. The solution inside the reactor was mixed by the use of a magnetic stirrer (Marconi, MA089) and a magnetic Teflon bar 15 mm long and 5.7 mm of diameter. All experiments were carried out with a stirring rate of 700 rpm.All chemicals were used as received: H2SO4 (Mallinckrodt, AR 96.0 wt%), oxalic acid (Sigma Aldrich, 99.0%), Ce(SO4)2 (Sigma Aldrich, 98%), Ce2(SO4)3 (Sigma Aldrich, 97%), sodium bromate (Sigma Aldrich, 99%), acetone (J. T. Baker, 99.7%). Ultrapure water (Millipore system, 18.2 MΩ cm) was used in all solutions and general cleaning.
The oscillating frequency, ω, for batch experiments was taken as an average for the high amplitude set of oscillations, eventually discarding the first or the last value, if it is discrepant. The frequency of low amplitude oscillations was not considered because this regime was shown to be irregular.
3. Results and discussion
3.1 Experiments
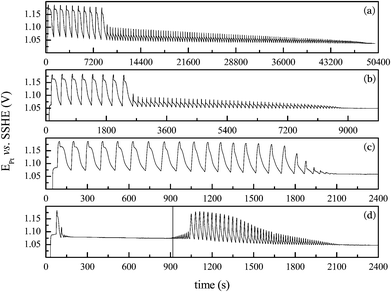
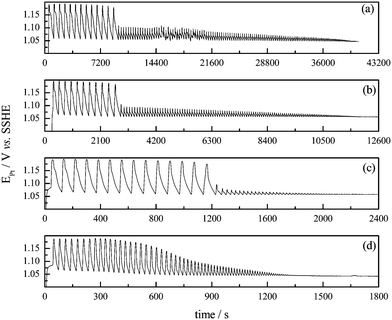
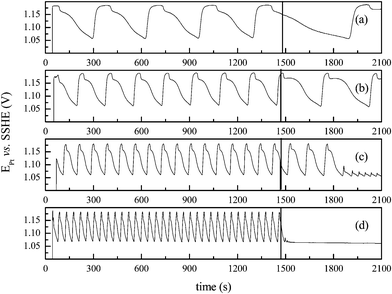
At 35 °C the system did not oscillate under the given conditions. The addition of a small aliquot (0.37 mL) of acetone at the instant indicated by the vertical line, produced the emergence of transient oscillations, as shown in Fig. 1(d). To circumvent the absence of oscillations at 35 °C, we performed experiments with slightly higher acetone concentration, namely 0.157 mol L−1, and the results are presented in Fig. 2.
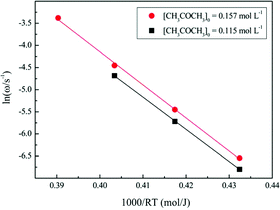
Overall, the high amplitude oscillations presented in Fig. 1 and 2 have comparable waveform and amplitude. Only a small change in the oscillatory frequency is observed for distinct acetone concentrations. The initial and uniform high amplitude oscillations were used to estimate the apparent oscillatory activation energy. Fig. 3 shows the Arrhenius plot for the data presented in Fig. 1 and 2, and illustrates the effect of temperature on the dynamics of the bromate–oxalic acid–acetone–cerium oscillatory system. The, apparent oscillatory activation energies, Eω, calculated in these plots13 were found to amount to 72 ± 2 kJ mol−1 (for [CH3COCH3] = 0.115 mol L−1), and to 74 ± 1 kJ mol−1 (for [CH3COCH3] = 0.157 mol L−1). Experiments were done in triplicate and these results represent the averaged values. Pastapur and Kulkarni22 studied the effect of temperature in the bromate–oxalic acid–acetone system in batch using Ce3+ and Mn2+, as catalysts. The study was performed at 25, 30, 35, and 40 °C and the activation energy obtained under oscillatory regime for the system with Ce3+ was 73 or 82 kJ mol−1, depending on the method used to estimate. The discrepancies between these values and the ones we found in the present work can be attributed to the differences in the concentrations and temperature range used in each case.
An important remark to be done at this point is that although no oscillations were found in batch at 35 °C for the lower acetone concentration used, the apparent oscillatory activation energy depicted in Fig. 3 (∼72–74 kJ mol−1) is representative of the system operated in batch in the temperature range investigated. The flow experiments were carried out with [CH3COCH3] = 0.115 mol L−1 and the main results are summarized in the following.
The observed oscillation periods in this figure were: 97 s (at k0 = 0.0059 s−1), 87 s (at k0 = 0.0104 s−1), 83 s (at k0 = 0.0150 s−1), and 78 s (at k0 = 0.020 s−1). Fig. 5 summarizes the effect of flow rate on the oscillatory frequency for all experiments. As can be seen, the oscillatory frequency increases, almost linearly, with the flow rate. Data points in batch, i.e. k0 = 0, account for three different experiments.
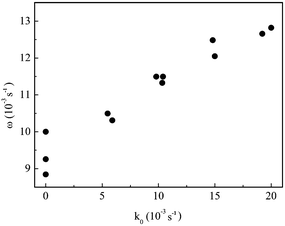 | ||
| Fig. 5 Oscillatory frequency as a function of the flow rate. Identical conditions as in Fig. 4. | ||
Our results are in line with that reported by Pereira and Faria,21 who observed a comparable behavior and reported a decrease of about 20% on the oscillation period for an increase in k0 from 0.0119 to 0.0352 s−1, for the oscillatory bromate–oxalic acid–acetone–cerium system. General increase of the oscillatory frequency when increasing flow rates has been also found for the hydrogen peroxide–thiosulfate–sulfite flow system.11 The difficulty in comparing previously published data is due to the commonly observed problem that the system is studied under different conditions (mainly concentration of chemicals) in batch and flow. As already mentioned, this is not a problem in the present case.
In homogeneous systems, the decrease in oscillatory frequency, which follows the reduction of flow rate can be tentatively interpreted as a damping caused by a decrease in the concentration of reacting species and the corresponding reduction of reaction rates of all reactions. As the flow rate increases, the concentrations of reacting species inside the reaction vessel are maintained high because of the efficient replenishment of fresh reactants, and also the removal of products.
For most of the homogeneous systems operated in batch, the degree of decrease of the oscillatory frequency in time reflects the strength of the damping; see below more on this aspect. We have explained this phenomenon before in somewhat different terms,19 but the concept is equivalent in both cases. This is a known effect that calls for a special care on the definition of the procedure for estimating the activation energy under oscillatory regime.27 Moreover, the damping in oscillatory frequency, observed under batch conditions, is also accompanied by a decrease in amplitude. This interpretation is valid for the same type of oscillations, and thus does not include sequential oscillations witnessed in batch.19,28–31 In fact, sequential oscillations are dynamic states located at different regions in the phase space that are visited as an uncontrollable parameter slowly varies.32,33 As such, there is no particular trend to be expected for the oscillations' frequency and amplitude in sequential oscillations.
When compared to chemical systems, the relative position with respect to the thermodynamic equilibrium in electrochemical systems can be controlled either via potentiostatic or galvanostatic mode.34 In both cases, the parameter, i.e. the potential or the current, respectively, readily informs on the distance with respect to the thermodynamic equilibrium. Nevertheless, the departure from the equilibrium is even more transparent since the flow of electrons through the interface is controlled. In agreement with the present findings, the oscillatory frequency also increases with the applied current for the electro-oxidation of formic acid on platinum5 and on platinum–tin surfaces.35 Again, these are examples of a situation where the same kind of oscillations are compared at different applied currents. As a final observation on the comparison between chemical and electrochemical systems in the context of the present discussion, it is remarkable the peculiarity of chemical systems in the sense that the situation for k0 = 0 cannot be obtained in electrochemical systems. Consequently, the range of k0 explored in Fig. 5 is in principle broader than that registered in electrochemical systems. Even considering the problem in properly normalizing the distance from thermodynamic equilibrium, this fact allows for further generalizations.
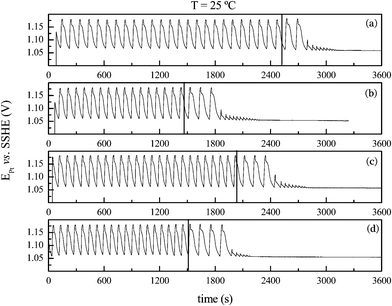
The effect of temperature was also investigated using a system with identical composition as in Fig. 4, but with k0 = 0.0098 s−1. Fig. 6 shows the effect of temperature on the time-series for the bromate–oxalic acid–acetone–cerium oscillatory system under flow regime. The vertical lines indicate when the flow was stopped. After interrupting the feeding, the system oscillates for a while, just as observed when operated in batch, vide supra. In agreement with the results at 35 °C for the system operated in batch for this acetone concentration, the oscillations cease earlier when the temperature is increased, and as shown in Fig. 6(d). As it was observed in batch, a regular, Arrhenius-like behavior is also found for the flow regime and both oscillations' waveform and amplitude remain very similar at all temperatures.
The effect of temperature on the oscillatory frequency under both batch and open regimes is summarized in Fig. 7(a). The missing point in the data for the batch system accounts for the fact that no oscillations are observed at 35 °C for the lower acetone concentration, cf.Fig. 3. The oscillatory frequencies at different temperatures taken from Fig. 6 were used to estimate the activation energy for the CSTR regime.19 The Arrhenius plots for the CSTR regime are presented in Fig. 7(b). An excellent linearity is observed and an apparent oscillatory activation energy of 50 ± 2 kJ mol−1 results.
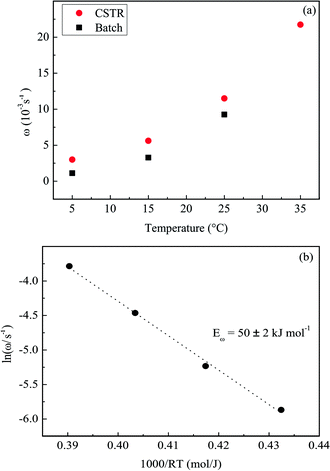 | ||
| Fig. 7 (a) The effect of temperature on the oscillatory frequency ω, for the bromate–oxalic acid–acetone–cerium system operated in batch and also in a CSTR. (b) Arrhenius plots using the oscillatory frequency, ω, for the system operated in a CSTR. Data for experiments in batch as in Fig. 1 and for the open system as in Fig. 6. | ||
As already anticipated in Fig. 5, it is clear from Fig. 7(a) that the open system oscillates faster than the one operated in batch, for the whole range of temperature studied. The apparent oscillatory activation energy decreases from 72 ± 2 kJ mol−1, in batch, to 50 ± 2 kJ mol−1 under flow. As the batch regime is virtually at k0 = 0, if other k0 values higher than 0.0098 s−1 were employed an oscillatory activation energy still lower should be find. These two aspects are central in the present study and will be further discussed below.
Experimental results for other systems are in line with our findings, as already mentioned in the Introduction.16,19 Nogueira et al.19 in particular, clearly show the increase of the apparent oscillatory activation energy as the system approaches the thermodynamic equilibrium. As already stressed, in order to isolate as much as possible the effects of interest, namely the operation mode and temperature, it is mandatory to keep, if possible, all the other parameters constant, as in the present case. In this respect, we are not aware of a comparable report. Taking specifically the work by Kulkarni and co-workers,22–25 who investigated the effect of temperature under comparable conditions for the same system studied here, besides the different concentrations used in some experiments in batch and under flow, the authors also used Ce4+ as the catalyst in some experiments, which may not be appropriate. In fact, we have shown that Ce3+ is the needed catalyst to observe oscillations in the bromate–oxalic acid–acetone–cerium system.21,26 In batch, no induction period is observed when Ce3+ is used, and in a CSTR, oscillations were found with Ce3+ and with aged solution of Ce4+, after partial conversion of Ce4+ to Ce3+ by reaction with acetone. The use of Ce4+ results in long induction times and leads to imprecision. In terms of the influence of temperature, we have observed that the Arrhenius plots are less linear when Ce4+ is used instead of Ce3+.
Back to the main results, in summary, we observed that, as the system is moved out from the state of thermodynamic equilibrium, its oscillatory frequency generally increases and its apparent oscillatory activation energy decreases. The first aspect, the frequency increasing with the distance from equilibrium was already discussed. We focus now on the temperature dependence, as discussed in terms of apparent activation energy for the oscillatory system. The activation energy of an elementary reaction step accounts for the energy barrier that molecules have to overcome in order to form products. For more complex processes, however, the presence of different steps and intermediates results in the existence of several energy barriers. In the case of an oscillating network consisting of many reactions and chemical species, the apparent oscillatory activation energy, as measured by the oscillatory frequency, informs on the temperature dependence of the oscillator, as it was based on a single reaction. As presented by Körös,13 the system can be regarded as ‘a series of autocatalytic reaction bursts occurring with a certain frequency’. In our case, the apparent activation energy decreases as the system is moved away from equilibrium, which is equivalent to saying that it becomes less sensitive to temperature changes. As a consequence, the relative independence of the physiological rhythms in living systems on the environmental temperature, known as temperature compensation, might indeed be favored under significantly far from equilibrium conditions. It is well-known that dynamic self-organization,36 such as temporally organized rhythms, that characterizes all living structures, occurs only in open and far from equilibrium systems. What our results reinforce is that the distance from equilibrium favors the decrease of temperature sensitivity.
Curiously enough, but also in line with our observations, our previous study on the electro-oxidation of formic acid on platinum and in acidic media,5 showed that, even for a system having a highly non-Arrhenius temperature dependence, temperature compensation is found under considerably far from equilibrium regime.
The role of flow in the temperature compensation has been explored by Otto Rössler in an often cited proceeding paper.15 The author discusses the temperature-sensitivity as resulting of a combination of kinetic and flow parameters and draw some particular conditions for achieving temperature compensation for the case studied, namely a relaxation oscillator. Importantly, the author mentions the role eventually played by membranes. In biological organisms, membranes are key components that control the inflow and outflow of chemicals and preserve the internal organization by keeping the system under far from equilibrium regime. However, besides the magnitude of flow itself, the selectivity, or its effect on particular species, is also a key aspect when discussing properties such as the temperature dependence on the oscillatory frequency. This aspect will be further discussed below.
In the following we present some numerical results that explore some aspects raised by our experiments. Given the lack of a well-established model for the studied system, we used a general and very simple model to investigate the effect of flow and temperature.
3.2 Numerical solutions of the Brusselator model
The chosen model to test the ideas just discussed was the Brusselator,37,38 a very simple, classical example of a limit cycle oscillator. The model consists of the following hypothetical steps:| A → X | (1) |
| B + X → Y + D | (2) |
| Y + 2X → 3X | (3) |
| X → E, | (4) |
 | (ODE 1) |
These equations describe how the concentrations of the two intermediate species X and Y change as a function of their concentration and that of the initial reactants A and B. In the original formulation of the Brusselator model,37,38 [A] and [B] are held constant which implies continuous inflow for those species, and the system represents, thus, a semi-batch oscillator. In our case, the original equations were modified to directly incorporate the effect of reactant inflow and outflow fluxes, as we shall describe in the following. Specific routines were built using the Mathematica® software to solve the resulting ODEs as well as analyze the resulting time series as a function of selected parameter changes. Runge–Kutta with variable step size was the preferred method for numerical integration.
 | (ODE 2) |
The final set of equations describing the CSTR system can be achieved with a minor intervention on the original ODEs to account for the removal of the intermediate species. The final set of equations for the CSTR oscillator then becomes:
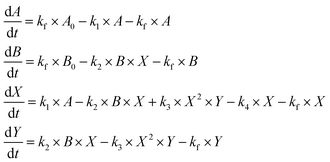 | (ODE 3) |
Oscillations may be found for this system of equations after numerical integration and a sensible choice of the parameters. In what follows, the values of A0 and B0 were fixed at 20, and the oscillatory frequency analyzed as a function of the flow rate, kf, for some selected sets of the constants {k1, k2, k3, k4} which were representative of the overall model behavior. Numerical results of the effect of the flux of reactants through the reactor on the oscillatory frequency are displayed in Fig. 8.
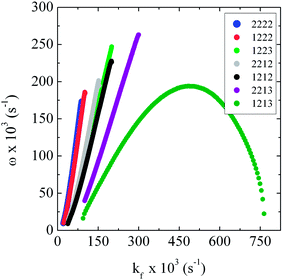 | ||
| Fig. 8 Simulated dependency of the oscillatory frequency on the parameter kf that represents the flux of reactants through the reactor (set ODE (3)). The curves were obtained for several sets of the rate constants {k1, k2, k3, k4}, indicated in the insert. | ||
The majority of curves presented in Fig. 8 reveal a general increase in the values of oscillatory frequency as the flow rate increases, in line with our experimental findings, cf.Fig. 5. This behavior was found for six combinations of the rate constants {k1, k2, k3, k4} and for the whole range of flow in which oscillations exist. One exception was found for the set {1, 2, 1, 3}, but the deviation occurs only for a very high kf, namely kf higher than 0.5 s−1, i.e. in an extreme parameter region. In terms of the mechanism, the decrease of oscillatory frequency when increasing the flow rate was found only for a combination of the smallest value for the rate of step 1 (A → X) with the highest value for the rate of step 4 (X → E), and only for very high flow rates. Under these conditions the decrease of the oscillatory frequency can be attributed to the small concentrations of X (low formation and fast removal) and also to its low residence time within the reactor. Finally, we observed that the range of flow rate in which oscillations can be found generally increases with the decrease of k3 and with the increase of k4. It was mentioned in the experimental section that, in batch, a possible explanation for the slower dynamics was the general decrease in the concentration of active species caused by their consumption in a closed system. This effect is absent in our simulations since we used constant concentrations for A and B in the simulations for the original Brusselator, which prevents any damping and produces only stable oscillations as for the system under explicit flow.
As seen in the set ODE (3), the flow rate parameter kf is found to impact several terms of the differential equations' set. It is possible to evaluate how each one of these terms affects the overall oscillatory frequency. To do so, we can discriminate each kf,i which appear in the set ODE (4):
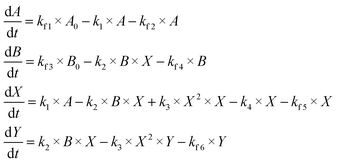 | (ODE 4) |
Altogether, there are six flow rate terms, four of them which increase (kf1 and kf3) and decrease (kf2 and kf4) the concentrations of A and B, and two related with the withdraw of the intermediate species X and Y (kf5 and kf6). We can vary each of those kf,i individually while keeping the remaining values constant at a control value. It is important to note, at this point, that this is merely a mathematical procedure, aiming to explore how these parameters, individually, influence the overall oscillatory dynamics for the model, and that there is no direct physical counterpart associated to a variation on a specific value of kf,i, since it would violate volume conservation. Still, one can see the variation in those parameters as a mean of increasing or decreasing the relative abundances of the reactants A, B, X, and Y. With this thought in mind, and the tool in hands, important insights can be achieved as of the role of availability of each of the reactant and its effect on oscillatory properties.
Fig. 9 shows the effect of the variation of each kf,i value on the oscillatory frequency for the CSTR version of the Brusselator. On panel (a) the results of such procedure are shown for values of kf,i starting from a low flow rate value (k0 = 40), while (b) displays the results for a high flow rate value (k0 = 200). The set of four ki values used were {1, 2, 1, 2}, but the general trend is similar for other sets of ki.
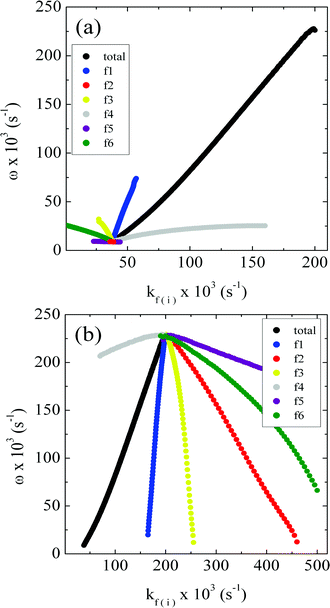 | ||
| Fig. 9 The curve in black shows how oscillatory frequency depends on the flow rate for the CSTR version of the Brusselator model using the {1, 2, 1, 2} rate constants set. The colorful lines indicate the dependency of the oscillatory frequency on the individual rate constants kf,i found in the set ODE (4), at low and high flow values, k0 = 40 in (a), and k0 = 200 in (b). A0 = B0 = 20. | ||
Fig. 9 shows that each different constant is associated with different effects on the oscillatory frequency. A common feature, however, is that a given rate constant plays the same role either at low or high flow rate. It is possible to quantify the magnitude of individual flow rate parameters kf,i on the overall behavior of frequency by introducing a sensitivity coefficient. Such coefficients have been used in biological contexts to evaluate the response of specific living organelles' functions for variations of important chemical species or physical parameters such as temperature.39 In our specific case, it is intuitive to introduce the sensitivity coefficient for the oscillatory frequency:
Table 1 presents the overall dependency of the oscillatory frequency on the increase in each of the kf,i constants as well as the specific control coefficients. It can be seen that parameters kf1 and kf2 related with the addition and removal of A, respectively, increase and decrease the oscillatory frequency. On the other hand, parameters kf3 and kf4, associated with the addition and removal of B, display the opposite effect. This result is in accordance with the simulated original Brusselator system where integration of the original ODE (1) set reveals that an increase in the concentration of A leads to higher oscillatory frequencies, while an increase for B promotes the opposite trend. Finally, Table 1 shows that an increase in the values of kf5 and kf6 promotes a decrease in oscillatory frequency, which means that depletion on the concentration of the intermediates X and Y has a negative effect on this property.
| Parameter | Effect on ω | S k f,i ω →40 | S k f,i ω →200 |
|---|---|---|---|
| k f1 | ↑ (+) | +3.6 | +4.0 |
| k f2 | ↓ (−) | −0.19 | −0.71 |
| k f3 | ↓ (−) | −2.7 | −1.5 |
| k f4 | ↑ (+) | +0.34 | +0.088 |
| k f5 | ↓ (−) | −0.33 | −0.19 |
| k f6 | ↓ (−) | −0.75 | −0.33 |
| k f,total | ↑ (+) | +0.99 | +1.4 |
We observe that the individual flow rate parameter operates on several terms of the set of differential equations and that each one of them has a particular effect on the oscillatory frequency, since it is specifically associated to the increase/withdraw of a particular reactant. Back to our specific results, a closer look in Fig. 9 reveals that the constants kf1 and kf3 related to the addition of reactants A and B, respectively, display the most pronounced effect on frequency, with kf1 promoting its increase while kf3 producing its decrease. Thus we can explain the overall increase of frequency as the flow rate is increased (curve in black in Fig. 9), as a function of a higher weight of the term related with kf1. In summary, the results shown in Fig. 9 can be rationalized as the net increase in the oscillatory frequency is a result of an increasingly surplus of the initial reactant A.
As represented by the black curve in Fig. 9, simple experiments in a CSTR would result in overall increase of the oscillatory frequency with the increase in the flow rate. The selective removal or addition of a given species in the reaction network would result in the increase or decrease of the oscillatory frequency. An interesting aspect that emerges from these results consists of the opposite effects exerted by the removal or addition of a given species. This feature opens the possibility of exploring the selective role of a given species to achieve properties such as temperature compensation. Indeed, the high selectivity of cellular membrane might play a role in keeping biological rhythms unaltered despite of changes in the environment. The importance of the interactions between membrane ion transport and ion concentration gradients in circadian rhythms has been discussed in the Njus–Sulzman–Hastings or membrane model.40 Despite the criticisms to some aspects of this earlier model, Nitabach et al.41 stressed the essential role that the ion fluxes through the membrane play in the mechanism of the core oscillator. Therefore, this discussion suggests that, instead of the robustness of a given biochemical network, it would be thus more adequate to consider the confined system (chemistry and membrane) as whole. The use of methods to investigate the reaction mechanism in complex systems42,43 is certainly of help in this direction.
 | (e1) |
The overall effect of temperature on frequency can be understood as the sum:
 | (e2) |
Through reference to Arrhenius' law, the following equation can be derived:
 | (e3) |
 | (e4) |
 | (e5) |
For the Brusselator model, this expression actually translates into:
| Eω = (Ck1ω × Ea1 + Ck2ω × Ea2 + Ck3ω × Ea3 + Ck4ω × Ea4), | (e6) |
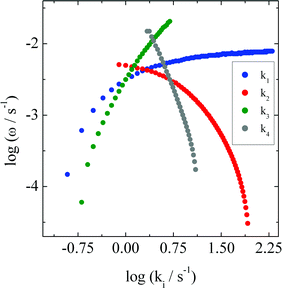 | ||
| Fig. 10 Influence of each ki on the oscillatory frequency for the CSTR version of the Brusselator model, set ODE (3) with kf = 0.10 s−1. Each rate constant was varied individually while the others would obey the following set {1, 2, 1, 2}. A0 = B0 = 20. | ||
Results in Fig. 10 describe the impact of the rate constants on the oscillatory frequency. Coefficients Ckiω were estimated and indicate that: steps 1 (A → X) and 3 (Y + 2X → 3X) contribute to increase the oscillatory frequency as the temperature increases, whereas steps 2 (B + X → Y + D) and 4 (X → E) belong to the frequency decreasing set. In short, steps that produce X increase the oscillatory frequency and the ones that consume X decrease the oscillatory frequency. In general, this trend was also found for almost all combinations of constants investigated.
According to eqn (e6), the apparent oscillatory activation energy for the Brusselator model would thus result of positive contributions of the activation energies of steps 1 and 3, and negative ones of steps 2 and 4. The impact of individual rate constants on the oscillatory frequency can be readily compared to the role of selective feeding of different species discussed above. For instance, saying that step 1 (A → X) contributes to increase the oscillatory frequency as the temperature increases, as evidenced by its positive control coefficient, is equivalent to the observation that the addition/removal of species A contributes to the increase/decrease of the oscillatory frequency, as discussed above.
4. Summary and conclusions
We investigate in this article the coupled effects of temperature and of the distance from thermodynamic equilibrium on the dynamics of a homogeneous oscillatory system. Experiments were carried out with the bromate–oxalic acid and acetone–cerium reaction under different temperatures and flow rates, by means of a continuous flow stirred tank reactor (CSTR). The conclusions on the effect of the distance from thermodynamics equilibrium were validated by the nearly identical oscillation's features under both batch and flow regimes. The experimental results were discussed in connection with numerical simulations using the Brusselator model, in its conventional formulation and also in a modified one to explicitly include the effect of flow.The experiments reveal a general increase of the oscillatory frequency when the flow rate is increased, in line with our previously published experiments in some homogeneous (chemical) and also heterogeneous (electrochemical) oscillators. Numerical simulations with the CSTR version of the Brusselator confirm this tendency but also disclose a tiny parameter region (for one specific set of rate constants and at extremely high flow rates) in which the increase of the flow rate results in a decrease in the oscillatory frequency. The effect of flow rate was also explored for each species of the Brusselator. Remarkably, we observed that, although the increase of the flow rate typically increases the oscillatory frequency, the feed concentration of each species impacts in a particular way the overall oscillatory frequency. This finding further stresses the role of flow rate in reacting systems, an important aspect for engineering artificial oscillators for specific applications.
The apparent oscillatory activation energy obtained via Arrhenius plots using the experimental oscillatory frequency, was found to amount to 72 ± 6 kJ mol−1, in batch, and to 50 ± 2 kJ mol−1, under flow. Unlike previous reports, these results were obtained under identical concentrations of all species and thus allowed to separate the effects of flow and temperature dependence. The decrease of the apparent oscillatory activation energy from batch to flow was interpreted as a result of the maintenance of the concentration of reactants, in contrast to their decrease caused by consumption in batch, which is in line with our previous results.19 Numerical simulations with the CSTR version of the Brusselator were explored in terms of the control coefficients, ∂ln![[thin space (1/6-em)]](https://www.rsc.org/images/entities/char_2009.gif) ω/∂ln
ω/∂ln![[thin space (1/6-em)]](https://www.rsc.org/images/entities/char_2009.gif) ki,1–4 for each reaction step i of the model. The results uncover the existence of two steps that are associated to the frequency-increasing set and two to the frequency-decreasing one, whose role remains unchanged despite the operational conditions. Furthermore, and as already mentioned, the particular manner at which the feeding rate of each species affects the oscillatory frequency further reinforces the role played by the selectivity of biological membranes in this respect.
ki,1–4 for each reaction step i of the model. The results uncover the existence of two steps that are associated to the frequency-increasing set and two to the frequency-decreasing one, whose role remains unchanged despite the operational conditions. Furthermore, and as already mentioned, the particular manner at which the feeding rate of each species affects the oscillatory frequency further reinforces the role played by the selectivity of biological membranes in this respect.
Acknowledgements
PAN, BCB (#141723/2009-2), RBF (#303988/2009-6, and #308497/2013-9), and HV (#306151/2010-3, and #479897/2010-7) acknowledge Conselho Nacional de Desenvolvimento Científico e Tecnológico (CNPq) for financial support. HV acknowledges São Paulo Research Foundation (FAPESP) for financial support (grants #2009/07629-6 and #2012/24152-1).References
- P. Ruoff, J. Interdiscip. Cycle Res., 1992, 23, 92–99 CrossRef.
- P. Ruoff, Naturwissenschaften, 1994, 81, 456–459 CrossRef CAS.
- P. Ruoff, Phys. D, 1995, 84, 204–211 CrossRef CAS.
- P. Ruoff, L. Rensing, R. Kommedal and S. Mohsenzadeh, Chronobiol. Int., 1997, 14, 499–510 CrossRef CAS.
- R. Nagao, I. R. Epstein, E. R. Gonzalez and H. Varela, J. Phys. Chem. A, 2008, 112, 4617–4624 CrossRef CAS PubMed.
- P. Ruoff and L. Rensing, J. Therm. Biol., 2004, 29, 445–456 CrossRef PubMed.
- L. Rensing, S. Mohsenzadeh, P. Ruoff and U. Meyer, Chronobiol. Int., 1997, 14, 481–498 CrossRef CAS.
- H. L. Heathcote, Z. Phys. Chem., Stoechiom. Verwandtschaftsl., 1901, 37, 368–373 Search PubMed.
- G. Bredig and J. Weinmayr, Z. Phys. Chem., Stoechiom. Verwandtschaftsl., 1903, 42, 601–611 Search PubMed.
- H. Varela, Cienc. Cult., 2011, 63, 23–25 Search PubMed.
- G. Rabai and I. Hanazaki, Chem. Commun., 1999, 1965–1966 RSC.
- K. M. Kovacs and G. Rabai, Phys. Chem. Chem. Phys., 2002, 4, 5265–5269 RSC.
- E. Körös, Nature, 1974, 251, 703–704 CrossRef.
- L. von Bertalanffy, Science, 1950, 111, 23–29 CAS.
- O. E. Rössler, Steps toward a temperature-compensated homogeneous chemical clock, Proc. San Diego Biomed. Symp., San Diego Biomedical Symposium, San Diego, 1975, pp. 99–104 Search PubMed.
- G. Nagy, E. Koros, N. Oftedal, K. Tjelflaat and P. Ruoff, Chem. Phys. Lett., 1996, 250, 255–260 CrossRef CAS.
- G. Rabai and I. Hanazaki, J. Phys. Chem. A, 1999, 103, 7268–7273 CrossRef CAS.
- K. Kovacs, L. L. Hussami and G. Rabai, J. Phys. Chem. A, 2005, 109, 10302–10306 CrossRef CAS PubMed.
- P. A. Nogueira, H. C. L. Oliveira and H. Varela, J. Phys. Chem. A, 2008, 112, 12412–12415 CrossRef CAS PubMed.
- Z. Noszticzius, Magy. Kem. Foly., 1979, 85, 330–331 CAS.
- J. A. M. Pereira and R. B. Faria, J. Braz. Chem. Soc., 2004, 15, 976–978 CrossRef CAS PubMed.
- S. M. Pastapur and V. R. Kulkarni, J. Indian Chem. Soc., 1991, 68, 293–294 CAS.
- C. Basavaraja and V. R. Kulkarni, J. Indian Chem. Soc., 2004, 81, 427–429 CAS.
- C. Basavaraja and V. R. Kulkarni, J. Indian Chem. Soc., 2006, 83, 85–86 CAS.
- C. Basavaraja, D. S. Huh, S. H. Park, U. J. Jeon, R. Pierson, T. K. Vishnuvardhan and V. R. Kulkarni, Bull. Korean Chem. Soc., 2007, 28, 1489–1492 CrossRef CAS.
- P. A. Nogueira, H. Varela and R. B. Faria, Chem. Phys. Lett., 2012, 530, 137–139 CrossRef CAS PubMed.
- S. Anic, L. KolarAnic and E. Koros, React. Kinet. Catal. Lett., 1997, 61, 111–116 CrossRef CAS.
- L. Adamcikova and P. Sevcik, React. Kinet. Catal. Lett., 1995, 56, 137–142 CrossRef CAS.
- M. Rachwalska, Z. Naturforsch., A: Phys. Sci., 2007, 62, 41–55 CAS.
- J. Li and J. C. Wang, Phys. Chem. Chem. Phys., 2011, 13, 15539–15545 RSC.
- J. G. Bell and J. Wang, Chaos, 2013, 23, 033120 CrossRef PubMed.
- R. Nagao, E. Sitta and H. Varela, J. Phys. Chem. C, 2010, 114, 22262–22268 CAS.
- M. F. Cabral, R. Nagao, E. Sitta, M. Eiswirth and H. Varela, Phys. Chem. Chem. Phys., 2013, 15, 1437–1442 RSC.
- H. Varela, ChemistryOpen, 2012, 1, 165–168 CrossRef CAS PubMed.
- N. Perini, E. Sitta, A. C. D. Angelo and H. Varela, Catal. Commun., 2013, 30, 23–26 CrossRef CAS PubMed.
- G. M. Whitesides and B. Grzybowski, Science, 2002, 295, 2418–2421 CrossRef CAS PubMed.
- I. Prigogine and R. Lefever, J. Chem. Phys., 1968, 48, 1695–1700 CrossRef PubMed.
- P. Gray, S. K. Scott and J. H. Merkin, J. Chem. Soc., Faraday Trans., 1988, 84, 993–1012 RSC.
- J. Wolf, S. Becker-Weimann and R. Heinrich, Syst. Biol., 2005, 2, 35–41 CrossRef CAS.
- D. Njus, F. M. Sulzman and J. W. Hastings, Nature, 1974, 248, 116–120 CrossRef CAS.
- M. N. Nitabach, T. C. Holmes and J. Blau, Methods Enzymol., 2005, 393, 682–693 CAS.
- A. Lemarchand, H. Berthoumieux, L. Jullien and C. Gosse, J. Phys. Chem. A, 2012, 116, 8455–8463 CrossRef CAS PubMed.
- X. Li and A. B. Kolomeisky, J. Chem. Phys., 2013, 139, 144106 CrossRef PubMed.
| This journal is © The Royal Society of Chemistry 2014 |

