DOI:
10.1039/C4RA03498H
(Paper)
RSC Adv., 2014,
4, 27979-27987
Reduced recombination and enhanced UV-assisted photocatalysis by highly anisotropic titanates from electrospun TiO2–SiO2 nanostructures†
Received
17th April 2014
, Accepted 13th June 2014
First published on 13th June 2014
Abstract
The surface areas of electrospun fibers/rice grain-shaped nanostructures of TiO2–SiO2 composites were further enhanced after transforming them into thorn or sponge shaped titanates via selective leaching of SiO2, which was reported by our group previously [RSC Adv., 2012, 2, 992]. In this study, we report on their application in photocatalytic activity (PCA) when juxtaposed with photoluminescence (PL). Two defect related bands are observed in PL and their origin is discussed in relation to calcination, crystallization and nucleation effects. The relative PL intensity for sponge shapes was the lowest and hence had the lowest radiative recombination, which suggests carrier trapping at defect centers. This enables the charge carriers to migrate to the surface and participate in the PCA. The results of PCA suggested that the sponge-shaped titanate exhibits the highest degradation rate among all samples. A plausible mechanism for the differences in PCA is proposed based on the variation in the defect-densities.
Introduction
Titanium dioxide (TiO2) is at the forefront of semiconducting oxides with application potential in fields of environmental remediation,1–3 decomposition of carbon gases,4 photocatalysis and generation of hydrogen gases5,6 without any dangerous byproducts. Various TiO2 nanostructures7,8 such as nanotubes,9 nanofibers,10,11 nanowires,12–14 nanoflowers,15 nanosheets16 and others have been extensively studied because of their unique physical and chemical properties. The above mentioned nanostructures possess their lower dimension around hundred nanometers, where their potential application is seen as catalysts,17 hydrogen gas sensors,18 hydrogen storage materials,19,20 Li-ion batteries,21–23 electrochromic properties24 and dye sensitized solar cells.25,26 When the size of the catalyst reaches down to nanoscale, the probability of recombination of photo-generated e/h pairs decreases due to the fast arrival to the reaction sites at surface27 where we note that the photocatalysis takes place at the surface of the catalyst.28–30 In this direction, it has been reported that TiO2 with small amounts of SiO2 inclusion can produce high surface area catalysts when the latter is selectively removed via alkali mediated chemical conversion31,32 and subsequent heat treatment. Besides, they combine the properties of conventional titanate (ion-exchange)33 and titania (photocatalyst).7,34 On the other hand, the wide band gap energy of these titanates (3.8 eV for nanosheets composed of sponges; and 3.2 eV of anatase TiO2),35,36 exhibit optical absorption in UV region and make them suitable in photocatalysis8 and photoelectric applications. Various studies on photocatalytic activity (PCA) and its enhancement is seen in literature for example, decomposition of acetic acid,37 organic/inorganic pollutants, heavy metal ions and dyes from water11,33,38 etc. Similar to other semiconductors, in the case of titanates, high surface area influences the optoelectronic properties where an explicit effect is reflected in photoluminescence (PL) attracting a lot of research attention. Recently,29,30 the optical emission properties of ZnO and ZnO–TiO2 nano/hetero-structures are juxtaposed with PCA which consider intrinsic defects. In contrast, the present study deals with the defects which are associated with extrinsic as well as intrinsic defects in titanates.
The synthesis of thorn and sponge shaped titanates from TiO2–SiO2 electrospun nanofibers/rice grain shaped structures were already been reported from our group previously.39,40 In continuation, here we report an important application in which we have employed the nanostructures as catalysts and tests their abilities. The emission intensity of e/h recombination is monitored across the samples (sponge and thorn shapes) and a correlation is obtained for the differences in PCA. TiO2–SiO2 nanofibers/rice grains shapes, upon alkali (NaOH) treatment yielded the structures with high surface area which facilitates the excellent photocatalytic properties for the degradation of an organic dye (Alizarin Red S). We anticipate that our investigations may help further understanding of various titanate nanomaterials and accelerate in the application potential.
Experimental
Materials
Titanium(IV) isopropoxide (TiP, 97%), poly(vinylacetate) (PVAc, Mw = 0.5 × 10⁶), poly(vinylpyrrolidone: PVP, Mw = 1.30 × 10⁶, Aldrich, Steinhseim, Germany), N,N-dimethyl acetamide (DMAc, anhydrous 99.8%), and tetraethoxysilane (TES, 99%) were obtained from Sigma-Aldrich (Steinheim, Germany). Acetic acid (99.7%) was obtained from LAB-SCAN Analytical Sciences, Thailand. Ethanol (absolute, Fischer scientific, Leicestershire, UK), Alizarin Red S dye (ARS) was obtained from Sigma-Aldrich, China. All the chemicals used without any further purification.
Preparation
TiO2–SiO2–PVP fibers. Methodology for the fabrication of the nanofibers is similar to our earlier reports.39,40 In brief, approximately 0.6 g of PVP, 14 mL of ethanol were thoroughly mixed for ∼6 h. About 4 mL of glacial acetic acid was added to the above solution under stirring. This step was followed by the addition of three different sets of TiP (1.75, 1.5 or 1 mL) and TES (0.25, 0.5 or 1 mL) solutions separately i.e. the three different solutions were (1) 1.75 mL of TiP + 0.25 mL of TES, (2) 1.5 mL of TiP + 0.5 mL of TES, and (3) 1 mL of TiP + 1 mL of TES. The total mixture was stirred continuously for ∼12 h to obtain homogeneity. The well mixed solution, (1), was taken into a 10 mL syringe with 27G × 1/2 needle. The optimized conditions for continuous electrospinning for the TiO2 was described in our previous reports.41–44 In the present context, the flow rate maintained as 0.8 mL h−1, the distance between the tip of the needle and collector was about 10 cm, and a high voltage of 30 kV is applied. The humidity levels approximately ∼50% were maintained inside the electrospinning chamber. From our previous findings,40 the solution (2) & (3) were unsuccessful to yield continuous nanofibers because of the high level of SiO2 precursor concentrations.
TiO2–SiO2–PVAc fibers. The preparation is similar to the earlier case, expect, PVP is replaced with PVAc. In a typical procedure, 2.4 g of PVAc was dissolved in 20 mL of DMAc. This was followed by the addition of 4 mL acetic acid and a mixture of 1.75 mL TiP + 0.25 mL TES. The mixture was stirred for ∼12 h for homogeneity and subjected to electrospinning. We have also attempted higher SiO2 concentrations as mentioned earlier, however, unsuccessful for (0.5 and 1 mL of TES in 1.5 or 1 mL of TiP, respectively).As-spun (TiO2–SiO2–PVP or TiO2–SiO2–PVAc) fibers were removed from the collector and the freestanding mat is subjected to calcination (500 °C for 1 h) to remove the polymer. Furthermore, TiO2–SiO2–PVAc composite nanofibers were calcined at 700 °C. About 500 mg of the composite nanostructures was treated with 100 mL of 5 M NaOH solution (in glass vials) at 80 °C in an oven for 24 h. This alkali treatment will etch the SiO2 while facilitating the structural rearrangement of TiO2. The treated material was washed several times with de-ionized water and finally with ethanol. This was then dried in an oven at 80 °C. The materials thus obtained were subjected to further characterization. Experiments have also been conducted with 10 M NaOH solution under similar condition; as a result, the nanostructures were disintegrated into nanoparticles. After NaOH treatment TiO2–SiO2–PVP/500 °C (thorn), TiO2–SiO2–PVAc/500 °C (sponge) and TiO2–SiO2–PVAc/700 °C samples are referred as S1, S2 and S3, respectively.
Characterization
Before and after the calcination the samples were analyzed under scanning electron microscopy (SEM: JEOL JSM-6701F). Prior to the observation, nominal 5 nm gold was coated. High-resolution transmission electron microscopy (HRTEM) and selected area electron diffraction (SAED) were performed using a JEOL 3010 TEM. The samples were dispersed in methanol, then a droplet of the solution is collected on carbon-coated copper grid and dried in vacuum. X-ray diffraction (XRD) patterns were recorded from Bruker-AXS D8 ADVANCE. PL was carried out using (Fluorolog, Horiba Jobin Yvon) at an excitation wavelength (λex) of ∼400 nm. The complete procedure is given in our previous publications.6,41 The dye is exposed to an UV irradiation (∼390 nm) in the presence of catalyst (∼5 mg) and the degradation rate is quantified via monitoring the optical absorption (UV-3600, Shimadzu) of the dye at different exposure times (SI-1†). X-ray photoelectron spectroscopy (XPS) and BET surface area measurements were already published by our group.39
Results and discussion
Fig. 1(a) shows the SEM images of TiO2–SiO2 nanofibers produced from the calcination of TiO2–SiO2–PVP precursor fibers. The fibers are found to be rather uniform throughout their lengths without any typical defects such as beads. The average diameter of the fiber is found to be 340 nm. Gaussian distribution is assumed and the fit is shown in Fig. 1(b). Fig. 1(c) shows the SEM images of the nanostructures obtained after the NaOH treatment followed by H2O and ethanol washing. During the NaOH treatment, SiO2 leaches from fibers forming thorn like structure. These thorn-like nanostructures can be seen more clearly at high magnification (Fig. 1(d)). The morphological evolution of thorn shaped nanostructures will be discussed latter in this section.
 |
| Fig. 1 SEM images of (a) TiO2–SiO2–PVP nanofiber (b) distribution of diameters with a Gaussian fit superimposed (c) titanates with thorn shaped structures on surfaces obtained by the leaching of SiO2 from TiO2–SiO2 composite nanofibers (5 M NaOH) and (d) high resolution images of thorn structures. | |
SEM image of rice grain-shaped structures and subsequent sponge shaped structures are shown in Fig. 2. From Fig. 2(a) the average diameter of rice grain is found to be ∼350 nm. The rice grain morphology was completely lost upon treatment of NaOH forming highly anisotropic nanostructures. The SEM image depicted in Fig. 2(b) and (c) shows sponge-shaped morphology (S2). Based on the earlier investigation39 it is the case that the selective leaching of SiO2 as well as reorganization of Ti atoms play a crucial role in the formation of the sponge like structures. It is also notable that this structure is rather uniform throughout the sample indicating the potentiality of this process. Furthermore, in the case of S3 the sponge structure is more or less disintegrated (Fig. 2(d)) where the porous structure was spotted in a few isolated regions of the sample and a closer examination resembles a sponge-shaped morphology.
 |
| Fig. 2 SEM images of (a) rice grain shapes (b) sponge like structures (c) sponge shapes at another location of the sample and (d) disintegrated shapes at few isolated spots after 700 °C calcination. | |
In the following we discuss the mechanism behind these structures. It is clear that the morphological differences are because of the polymer that is complexed with titanium and or silicon precursor. Here such interactions are considered while the bonding between PVP–TiO2 and PVAc–TiO2 are referred as Δ1 and Δ2, respectively; see the schematic diagram in Fig. 3. In both cases the dangling unsaturated oxygen is active for interaction, where we need to note the variance in the chemical environment. PVP is a well studied surfactant45 where its interaction not just limited to the oxygen, but also to the alkyl chain. In the case of PVP the oxygen attached to a heterocyclic compound (Fig. 3(a)), while in the case of PVAc it is to an alkyl chain (Fig. 3(a)). If we consider the strengths of Δ1 and Δ2 it is could be case that the former is stronger than the latter. During the calcination, Δ1 results in lower mobility of the molecules, in contrast Δ2 leaves comparatively higher mobility. Furthermore, it should be noted that the relatively higher Δ1 of PVP allows it to be distributed uniformly. Hence in the case of S1 sample, the fiber structure is retained even after calcination followed by leaching of SiO2. The case with PVAc of course is not similar to that of PVP, where we can expect microscale phase separation (solubility mismatch) for the former case causing non-uniform distribution of the polymer. This phase separation under limited interaction takes elongated shapes.46 Consequently, when the sample is subjected to calcination, PVAc is decomposed leaving behind TiO2 nanostructures in rice grain format. Under NaOH treatment, the rice grains transformed into sponge-like structures because of the leaching of SiO2. Hence, inherently, SiO2 assists the atomic rearrangement and has its role in the determining the morphology.
 |
| Fig. 3 Interaction between titanium dioxide with (a) PVP and (b) PVAc. | |
HRTEM is employed to reveal the local morphological and crystal structure. The results are shown in Fig. 4. Rice-grain structures (before NaOH treatment) are shown in Fig. 4(a). If we compare the diameters before and after NaOH treatment, we can see a dramatic increase. To be precise, the mean diameter is ca. 1.2 μm (from Fig. 4(b)) for the S1 and ca. 1.5 μm (from Fig. 3(c)) for the S2. This increase indicates that after the NaOH treatment TiO2–SiO2 nanostructures (fibers/rice grains) have gone through a structural reorganization. The thorn morphology (after NaOH treatment, S1) is consistent with the SEM observation. Fig. 4(c) shows sponge shaped morphology of S2, where the edges appear like nanosheets or ribbons. The ribbon like structure is a vital observation where we have correlated these structures with the existing literature and the optical properties are discussed. The SAED pattern from sample S2 is shown in Fig. 4(d). We have annotated the diffraction planes on the image. These patterns suggest anatase phase titania. The resultant nanostructures were found to include TiO2 based nanostructured products. If we look at the SAED pattern closely we can see the bright spots in addition to the rings, where the earlier suggests highly crystalline material embedded in relatively low crystalline matrix. We will see that this polycrystalline nature is well evidenced in the context of XRD.
 |
| Fig. 4 High resolution TEM (a) rice grains (b) thorn like structures (S1), (c) sponge like structure with ribbons on the edges (S2) and (d) SAED pattern from S2 with diffraction planes annotated. | |
XRD patterns were recorded to understand the overall crystal structure of the titanates. Representative patterns for the S1, S2 and S3 are presented in Fig. 5. Interestingly these samples have shown similar pattern with differences in the relative intensity of each reflection. Major peaks are identified with their reflection planes on the image. Based on the results from XPS (not shown here, please consult ref. 39 for the details) and XRD establish the composition of the titanates to be Na2−xHxTi2O4(OH)2. When such titanates are subjected to calcination above 450 °C the compound turns into Na2Ti2O4(OH)2 (ref. 34 and 47) by loosing water. Further increase in the calcination temperature viz 700 °C completely destroys the nanostructure while turning them into nanoparticles, however TiO2 will be take rutile phase. Orthorhombic phase is identified and the lattice parameters for the S2 are a = 18.84 Å, b = 3.72 Å and c = 2.88 Å. The curved edges of sponge has taken its toll on XRD, where the diffraction peaks along the Z axis ((301), (501), (002)) are relatively weaker than the other (Fig. 5). If we compare the lattice constant, a, of sponge sample with that of flat layered titanate Na4Ti9O20·xH2O (a = 17.2 Å)48 and Li1.81H0.19Ti2O5·2.2H2O (a = 16.66 Å),49 the distance between the adjacent sheets (a = 2 × d600) for the sponge sample is larger than the other. In the case of (110) plane S3 has shown compressive strain when compared to S1 and S2 samples. This might be because of relatively higher calcination temperature. Another notable difference is the shape of the peaks, especially for peak (600). This may be a result of Na+ replacement by H+ in Na2Ti2O4(OH)2.
 |
| Fig. 5 XRD patterns of S1, S2, and S3 titanates. The data from S1 and S3 are taken from our previous work.39 | |
In general, the morphology can be modified via a selective dissolution or precipitation. Ti(IV) nucleates and transforms into porous titanate structures on alkali treatment. The reaction is as follows:
|
2TiO2 + 2NaOH → Na2Ti2O4(OH)2
| (1) |
The open morphologies (or cavities), results in effective ion-exchange properties while maintaining the rigidity.34 Ion exchangeability is the ratio between Na and Ti atoms in the nanostructures as varied with synthesis methods.47,50 The perfect crystal structures of S1, S2, and S3 with concentrated NaOH can probably correspond to layered titanates; either H2Ti3O7 or H2Ti2O4(OH)2 where they belong to monoclinic and orthorhombic crystals, respectively. Depending on the above two forms, the ion (Na+, Men+) exchange with proton (H+) can be represented by the following equations:47,50
|
xMen+ + H2Ti3O7 → MexH2−xTi3Ox(n−1)+7 + xH+
| (2) |
|
xH+ + Na2Ti2O4(OH)2 → Na2−xHxTi2O4(OH)2 + xNa+
| (3) |
where Me
n+ or Na
+ are cations and
x varies from 0 to 2 depending on pH. Morphology differences may occur since, the Na
+–O–Ti bonds exist on the surface of the TiO
2 and the overall charge is balanced. Once the structures treated distilled water and ethanol, these charges disappear, resulting in the formation of granular particles; the Ti–O–Na bonds may connect between the ends of the sheets and thus the formation of the rod like structures
31 with thorn or sponges.
Carrier recombination–photoluminescence
PL spectra have widely been used to investigate the efficiency of charge carrier trapping and recombination. The emission spectra from S1, S2 and S3 samples are shown in Fig. 5. The PL spectra of titanate nanostructures may depict several bands resulting from shallow and deep trap transitions at shorter and longer wavelength regions, respectively.51 In contrast, here we observe only two bands above 450 nm. From Fig. 6(a), a band centred at ∼463 nm (2.67 eV) is clearly observed, which is smaller than the band gap energy of typical titanate (∼3.87 and 3.84 eV for nanotubes35 and nanosheets36 respectively). In literature, titanate nanostructures produced by hydrothermal alkali treatment is seen to depict peaks at different wavelengths35 where the trapped cation governs the emission. Hence the emission bands are highly dependent on the composition of the surrounding media.35,52 Hence this band is attributed to the defect level transition associated with trapped cation, where we can see that the spectral location is not dependent on the morphology. A broad emission band at ∼533 nm appeared primarily due to the recombination of defects such as oxygen vacancies or surface states.53 The high surface area of the samples can lead to the formation of surface defects. To quantify the density of defects, IUV/IDefect is generally employed where the relative PL intensities reflect the optical quality.30,54 This quantification helps to understand the PCA of the samples as shown earlier.29,30 Higher ratio values suggests that the UV emission is predominant where it can inferred that the band structure of the semiconductor is well established in terms of radiative recombination and the trap density is negligible. When the semiconductor is predominant with defects the UV emission is quenched similar to the present case where the interband transition is not observed. Hence, in order to compare the optical quality across these samples we have considered the ratio of defect emissions (I463nm/I533nm) and the values are plotted in Fig. 6(b). Although both the emission are defect related, by doing this approximation at least we will be able to compare the relative defect densities. It is notable that S3 has shown comparatively low ratio than the other two samples. Although it is observed that higher calcination temperatures produce samples with lesser oxygen related defects,51,55 the present context should be treated more carefully for two reasons. One of the two is that in those two cases, SiO2 is remains as a matrix in contrast to the present case where SiO2 is leached with NaOH treatment after the calcination. Hence the present effect is directly related to the leaching of SiO2 rather than a direct temperature effect. The second reasons is as follows. As discussed earlier, the sponge shaped titanates are produced after leaching with the background of a carrier polymer which shows relatively lower interaction. Due to the enhanced surface area the density of oxygen related defects are increased. On the other hand, we should note an exception in which S1 and S2 samples have been produced when calcined at the same temperature, the former sample has shown better optical quality. This discrepancy can be because of two reasons. First of all, the composition of the precursors is not the same for both the samples, where the former and latter use PVP and PVAc, respectively. The dynamics of both the polymers vary and hence a collective interaction among the precursors is expected. Furthermore, as discussed earlier, the differences in the interactions Δ1 and Δ2 caused severe effect on morphology so does the crystallinity. Note the variation in the relative intensities of various XRD peaks, which suggests that the average growth direction is not the same for all samples (Fig. 5). For example, (600) plane is predominant for S1 and S2, while (110) is for S3. The difference in the predominant growth direction exposes other planes of the crystals to the environment, in which case the density of surface defects vary under thermal treatment. Second of all, the differences in the surface area due to sample morphology would have caused the discrepancy, where the S1 has shown lower surface area than S2, cf. the surface area of S1 and S2 are 208 and 220 m2 g−1 respectively.39 As mentioned earlier, higher surface would cause higher density of defects. It is quite obvious that the defects are induced by thermal treatment up to a certain calcination temperature and above which they gradually disappear (e.g. 750 °C).51,56 Among the three samples, S2 has the lowest density of defects, see Fig. 6(b). These defect states generally trap either electron or hole which would delay the recombination thus higher PCA in the context of ZnO (ref. 30) so does the case with TiO2.29 Oxygen vacancies can be originated because of selective leaching of SiO2 through NaOH treatment. These defects states are found to delay the recombination process.28–30,57 In the present context of oxygen related defects could have arose due to the breakage of bonds shown in the following equations.51,56 |
M–OR + H2O → M–OH + HOR
| (4) |
where M is denotes either Ti or Si and –OR denotes alkoxyl group. For the low temperature calcination (viz 500 °C) large amount of
M–OR and
M–OH groups remain unchanged. In contrast, for high temperature calcination (viz 700 °C), these bonds might break and form TiO2 and SiO2 via nucleation and crystallization. The earlier partially oxidized or broken
M–OR and
M–OH groups react differently from the latter TiO2–SiO2 composite, which is reflected as an explicit contrast in the morphologies. In the process of selective etching, the broken bonds can induce defect centers of different degree, where we have seen different relative intensities in PL (Fig. 6(b)). Furthermore, the differences in the ionic radii, viz Ti+4 (∼0.68 Å) and Si+4 (∼0.41 Å) could cause distortion in the lattice. Concluding, the differences in the intensities of radiative recombination is due to nanosized titanate crystallites (along with trapped cations), where it is originated due to the variation in calcination temperature and subsequent non-similar leaching of SiO2.
 |
| Fig. 6 (a) Photoluminescence from thorn like structures (S1), low temperature derived sponge sample (S2, 500 °C) and high temperature derived disintegrated-sponge sample (S3, 700 °C) and (b) The relative PL intensity of the corresponding structures (S1, S2, and S3). | |
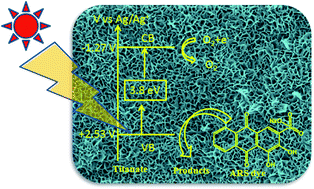
The band diagram of S2 in comparison with the anatase TiO2, with respect to the Ag/Ag+ potentials is schematized in Fig. 6. The band gap energy of the S2 titanate and the anatase TiO2 are 3.8 (ref. 35) and 3.2 eV,58 respectively. The valance band (VB) and conduction band (CB) edge positions of the titanates can be calculated from the following formulae (6) and (7)59
|
EVB = χ(semiconductor) − E(free electrons) + 0.5Eg
| (6) |
where
Eg is the band gap energy;
EVB and
ECB are the VB and CB band edge potentials respectively,
χ is the electronegativity (geometric mean) of the constituent atoms in a semiconductor,
E is the energy of free electrons with reference to the standard hydrogen electrode (SHE: 4.44 ± 0.02 V at 25 °C). The calculated band edge positions of the titanates are presented in
Fig. 6. With reference to the SHE the flat band potentials are −1.27, −1.15 V and 2.05, 2.53 V for TiO
2 and sponge–TiO
2 (S
3) respectively. From
Fig. 6, the difference in the band gap of 0.6 eV has spread in CB and VB of titanate sample, where the band edges for S
2 titanate is relatively higher than anatase TiO
2.
PCA depends on the surface properties, availability of the photogenerated charge carriers and the energetic location of the CB and VB.30 The relative CB and VB positions suggest that the photogenerated electron, hole exhibit stronger reduction and oxidation potentials in S2 than in anatase TiO2.
Application of titanates for ARS dye removal through photocatalysis
The titanate nanostructures have been potential for promising applications as adsorbents and photocatalysts for the removal of metal ions and dyes from wastewater. Titanates as nanostructures offer a large surface area, flexible interlayer distances50,60 high cation exchange capacity while providing channels for enhanced electron transfer.38 In general, the PCA of the photocatalyst depends on the particle size, surface area, defect density, optical quality and adsorbing ability.16,30 A high surface area can offer more active adsorption sites and photocatalytic reaction centers. The PCA of S1, S2, and S3 samples is performed and shown in Fig. 7. The normalized concentration of the solution is equivalent to the normalized absorbance,27 so A0/A can be replaced with that of C0/C. Clearly, the activity of the S2 is higher than the other samples. Nearly 72% of the dye degraded by S2 which is superior than S1 (53%) and the S3 (56%) for an illumination of 5 h. Rate constant for the degradation of dye is calculated using the equation [ln(C0/C) = Kt], where C0 is the initial concentration of the dye and C is the concentration of the dye at a time ‘t’, K is the rate constant of the degradation would derived from plots. The fitting of absorbance plot versus time indicates an exponential decay as shown in Fig. 7(b). From the figure, first order pseudo rate constant ‘K’ is derived and found to be 0.00513, 0.0104 and 0.0064 min−1 for S1, S2 and S3 respectively. The values are superior to that of earlier reported rate constant.16 The remarkable PCA for the sponge shaped titanates is attributed to their defective structure and high specific surface area. Surface area increases in the following order S2 > S1 > S3 which shows a correlation with the relative optical quality of titanate and morphology. The high surface area sponge shapes enable to adsorb ARS molecules onto the surface of the pores, thus favouring the photocatalytic degradation. Higher surface area allows large amount dye to adsorb and henceforth degradation reaction. It means that the sponge shaped titanates would be expected to show more activity. From the above results, the sponge shaped titanates (S3) will be promising for environmental and solar application.
 |
| Fig. 7 Schematic representation of band diagram for thorn/sponge (S1/S2) shaped titanate when compared with anatase TiO2. | |
The PCA of ARS dye mechanism is shown in Fig. 8. The pure ARS dye is adsorbed on the titanate catalyst. Photogenerated electrons transfer from VB to CB, leaving holes behind VB top of the ARS dye. Then the excited electrons react with the oxygen to form O2−. Then these oxygen radicals and holes can effectively oxidize the ARS dye. Thus, it can be assumed that there are two possible mechanisms involved in the degradation (Fig. 9) process.59
|
S(catalyst) + hv → h+ + e−
| (8) |
|
e− + O2 → ˙O2− (radical)
| (9) |
|
h+ + OH− → ˙OH (radical)
| (10) |
|
ARS(dye.ads)* + S(catalyst) → S(catalyst) (e−) + ARS(dye.ads)+
| (11) |
|
S(catalyst) (e−) + O2 → S(catalyst) + ˙O2− (radical)
| (12) |
|
S(catalyst) + ˙O2− + 2H+ → S(catalyst) + ˙OH (radical)
| (13) |
|
ARS(dye.ads) + ˙O2− → products
| (14) |
where S stands for S
1, S
2 or S
3, and dye.ads stands for adsorbed dye. Through
eqn (8–14) photocatalysis process takes place and consequently dye degradation.
 |
| Fig. 8 (a) Photocatalytic activity of thorn sample (S1), low temperature derived sponge sample (S2, 500 °C) and high temperature derived disintegrated sponge sample (S3, 700 °C). (b) Kinetic plots; for S1, S2, and S3. | |
 |
| Fig. 9 Schematic representation of oxidation and reduction process. | |
Conclusions
Electrospun fibers/rice grain-shaped nanostructures of TiO2–SiO2 composites are produced. Upon a treatment with conc. NaOH solution at 80 °C for 24 h results in highly anisotropic thorn and sponge shaped titanates with relatively high surface areas are reported. The as-obtained products were characterized by means of SEM, and TEM which confirmed their morphologies. Since the composition of precursor is not the same for both (thorn and sponge) samples, during calcination the dynamics of the polymers vary and the collective interaction between the precursors causes anisotropic crystal formation. This anisotropy is seen after NaOH treatment in terms of morphology, which also caused differences in the density of defects as seen in PL. Two emission bands are observed (∼463 and ∼533 nm) are assigned to defects induced from the calcination, crystallization and nucleation effects. The relative PL intensities are increasing with increasing calcination-temperature which is in good agreement with the earlier reports. The relative PL intensity for highly porous sponge shapes was the lowest. This indicates that the sponge like nanostructures delays the e/h recombination. The slower recombination rate is due to the abundant surface states when combined with high surface area results in enhanced PCA. Sponge shaped titanates exhibit higher degradation rate ∼0.01 min−1. A possible degradation mechanisms for the dye is proposed and discussed based on relative differences in the defect densities. We anticipate that our investigations may help further understanding of various titanate nanomaterials and accelerate in the application potential.
Acknowledgements
VJB, SV thanks The Scientific & Technological Research Council of Turkey (TUBITAK) (TUBITAK-BIDEB 2221, Fellowships for visiting scientists and scientists on sabbatical leave) for providing fellowship.
References
- E. Pelizzetti and C. Minero, Electrochim. Acta, 1993, 38, 47–55 CrossRef CAS.
- M. M. Khin, S. Nair, J. b. Veluru, M. Rajendiran and S. Ramakrishna, Enery Environ. Sci., 2012, 5, 8075–8109 RSC.
- V. J. Babu, S. Vempati, S. Sundarrajan, M. Sireesha and S. Ramakrishna, Sol. Energy, 2014, 106, 1–22 CrossRef CAS PubMed.
- A. Nishimura, Y. Okano, M. Hirota and E. Hu, Int. J. Photoenergy, 2011, 2011, 305650 CrossRef PubMed.
- V. J. Babu, M. K. Kumar, A. S. Nair, T. L. Kheng, S. I. Allakhverdiev and S. Ramakrishna, Int. J. Hydrogen Energy, 2012, 37, 8897–8904 CrossRef CAS PubMed.
- J. B. Veluru, K. K. Manippady, M. Rajendiren, K. M. Mya, P. R. Rayavarapu, S. N. Appukuttan and R. Seeram, Int. J. Hydrogen Energy, 2013, 38, 4324–4333 CrossRef CAS PubMed.
- D. V. Bavykin and a. F. C. Walsh, Eur. J. Inorg. Chem., 2009, 2009, 977–997 CrossRef.
- X. Chen and S. S. Mao, Chem. Rev., 2007, 107, 2891–2959 CrossRef CAS PubMed.
- B. C. Viana, O. P. Ferreira, A. G. S. Filho, J. M. Filhob and a. O. L. Alvesa, J. Braz. Chem. Soc., 2009, 20, 167–175 CrossRef CAS PubMed.
- H. Y. Zhu, Y. Lan, X. P. Gao, S. P. Ringer, Z. F. Zheng, D. Y. Song and a. J. C. Zhao, J. Am. Chem. Soc., 2005, 127, 6730–6736 CrossRef CAS PubMed.
- D. J. Yang, Z. F. Zheng, H. Y. Zhu, H. W. Liu and a. X. P. Gao, Adv. Mater., 2008, 20, 2777–2781 CrossRef CAS.
- B. Zhao, F. Chen, W. Qu and J. Zhang, J. Solid State Chem., 2009, 182, 2225–2230 CrossRef CAS PubMed.
- C.-Y. Xu, Q. Zhang, H. Zhang, L. Zhen, J. Tang and a. L.-C. Qin, J. Am. Chem. Soc., 2005, 127, 11584–11585 CrossRef CAS PubMed.
- A. Riss, T. Berger, S. Stankic, J. Bernardi, E. Knözinger and O. Diwald, Angew. Chem., Int. Ed., 2008, 47, 1496–1499 CrossRef CAS PubMed.
- J.-q. Huang, Z. Huang, W. Guo, M.-l. Wang, Y.-g. Cao and a. M.-c. Hong, Cryst. Growth Des., 2008, 8, 2444–2446 CAS.
- J. Huang, Y. Cao, Z. Deng and Hao Tong, J. Solid State Chem., 2011, 184, 712–719 CrossRef CAS PubMed.
- L. Torrente-Murciano, A. A. Lapkin, D. V. Bavykin, F. C. Walsh and K. Wilson, J. Catal., 2007, 245, 272–278 CrossRef CAS PubMed.
- C.-H. Han, D.-W. Hong, I.-J. Kim, J. Gwak, S.-D. Han and K. C. Singh, Sens. Actuators, B, 2007, 128, 320–325 CrossRef CAS PubMed.
- D. V. Bavykin, A. A. Lapkin, P. K. Plucinski, J. M. Friedrich and F. C. Walsh, J. Phys. Chem. B, 2005, 109, 19422–19427 CrossRef CAS PubMed.
- S. H. Lim, J. Luo, Z. Zhong, W. Ji and J. Lin, Inorg. Chem., 2005, 44, 4124–4126 CrossRef CAS PubMed.
- J. Li, Z. Tang and Z. Zhang, Chem. Mater., 2005, 17, 5848–5855 CrossRef CAS.
- H. Zhang, X. P. Gao, G. R. Li, T. Y. Yan and H. Y. Zhu, Electrochim. Acta, 2008, 53, 7061–7068 CrossRef CAS PubMed.
- Y. Lan, X. Gao, H. Zhu, Z. Zheng, T. Yan, F. Wu, S. P. Ringer and D. Song, Adv. Funct. Mater., 2005, 15, 1310–1318 CrossRef CAS.
- H. Tokudome and M. Miyauchi, Angew. Chem., Int. Ed., 2005, 44, 1974–1977 CrossRef CAS PubMed.
- G.-S. Kim, H.-K. Seo, V. P. Godble, Y.-S. Kim, O.-B. Yang and H.-S. Shin, Electrochem. Commun., 2006, 8, 961–966 CrossRef CAS PubMed.
- E. Enache-Pommer, J. E. Boercker and E. S. Aydil, Appl. Phys. Lett., 2007, 91, 123116 CrossRef PubMed.
- Q. Wan, T. H. Wang and a. J. C. Zhao, Appl. Phys. Lett., 2005, 87, 083105 CrossRef PubMed.
- M. R. Hoffmann, S. T. Martin, W. Choi and D. W. Bahnemann, Chem. Rev., 1995, 95, 69–96 CrossRef CAS.
- F. Kayaci, S. Vempati, C. Ozgit-Akgun, I. Donmez, N. Biyikliab and T. Uyar, Nanoscale, 2014, 6, 5735–5745 RSC.
- F. Kayaci, S. Vempati, C. Ozgit-Akgun, N. Biyikli and T. Uyar, Appl. Catal., B, 2014, 156–157, 173–183 CrossRef CAS PubMed.
- T. Kasuga, M. Hiramatsu, A. Hoson, T. Sekino and K. Niihara, Adv. Mater., 1999, 11, 1307–1311 CrossRef CAS.
- T. Kasuga, M. Hiramatsu, A. Hoson, T. Sekino and K. Niihara, Langmuir, 1998, 14, 3160–3163 CrossRef CAS.
- X. Sun and Y. Li, Chem.–Eur. J., 2003, 9, 2229–2238 CrossRef CAS PubMed.
- D. V. Bavykin, J. M. Friedrich and F. C. Walsh, Adv. Mater., 2006, 18, 2807–2824 CrossRef CAS.
- D. V. Bavykin, S. N. Gordeev, A. V. Moskalenko, A. A. Lapkin and F. C. Walsh, J. Phys. Chem. B, 2005, 109, 8565–8569 CrossRef CAS PubMed.
- N. Sakai, Y. Ebina, K. Takada and T. Sasaki, J. Am. Chem. Soc., 2004, 126, 5851–5858 CrossRef CAS PubMed.
- T. Kasuga, M. Hiramatsu, M. Hirano and A. Hoson, Chin. J. Mater. Res., 1997, 12, 607–609 CrossRef CAS.
- C.-K. Lee, S.-S. Liu, L.-C. Juang, C.-C. Wang, M.-D. Lyu and S.-H. Hung, J. Hazard. Mater., 2007, 148, 756–760 CrossRef CAS PubMed.
- A. S. Nair, Z. Peining, V. J. Babu, Y. Shengyuan, P. Shengjie and S. Ramakrishna, RSC Adv., 2012, 2, 992–998 RSC.
- A. S. Nair, P. Zhu, V. J. Babu, S. Yang, T. Krishnamoorthy, R. Murugan, S. Peng and S. Ramakrishna, Langmuir, 2012, 28, 6202–6206 CrossRef CAS PubMed.
- V. J. Babu, A. S. Nair, Z. Peining and S. Ramakrishna, Mater. Lett., 2011, 65, 3064–3068 CrossRef CAS PubMed.
- Z. Peining, A. S. Nair, Y. Shengyuan and a. S. Ramakrishna, Mater. Res. Bull., 2011, 46, 588–595 CrossRef PubMed.
- Y. Shengyuan, Z. Peining, A. S. Nair and a. S. Ramakrishna, J. Mater. Chem., 2011, 21, 6541–6548 RSC.
- V. J. Babu, V. S. P. Kumar, G. J. Subha, V. Kumari, T. S. Natarajan, A. S. Nair and S. Ramakrishna, J. Eng. Fibers Fabr., 2011, 6, 54–59 Search PubMed.
- S. Vempati, Y. Ertas and T. Uyar, J. Phys. Chem. C, 2013, 117, 21609–21618 CAS.
- S. M. Jo, M. Y. Song, Y. R. Ahn, C. R. Park and D. Y. Kim, J. Macromol. Sci., Part A: Pure Appl.Chem., 2005, 42, 1529–1540 CrossRef.
- J. Yang, Z. Jin, X. Wang, W. Li, J. Zhang, S. Zhang, X. Guo and Z. Zhang, Dalton Trans., 2003, 3898–3901 RSC.
- M. Sugita, M. Tsuji and M. Abe, Bull. Chem. Soc. Jpn., 1990, 63, 1978–1984 CrossRef CAS.
- T. Sasaki, M. Watanabe, Y. Komatsu and Y. Fujiki, Inorg. Chem., 1985, 24, 2265–2271 CrossRef CAS.
- D. V. Bavykin, A. A. Lapkin, P. K. Plucinski, J. M. Friedrich and F. C. Walsh, J. Catal., 2005, 235, 10–17 CrossRef CAS PubMed.
- C. F. Song, M. K. Lu, P. Yang, D. Xu and D. R. Yuan, Thin Solid Films, 2002, 413, 155–159 CrossRef CAS.
- H. Xin, R. Ma, L. Wang, Y. Ebina, K. Takada and T. Sasaki, Appl. Phys. Lett., 2004, 85, 4187 CrossRef CAS PubMed.
- J. Jun, C. Jin, H. Kim, J. Kang and C. Lee, Appl. Phys. A, 2008, 96, 813–818 CrossRef PubMed.
- S. Vempati, A. Shetty, P. Dawson, K. Nanda and S. B. Krupanidhi, J. Cryst. Growth, 2012, 343, 7–12 CrossRef CAS PubMed.
- C. F. Song, M. K. Lü, S. F. Wang, D. Xu, D. R. Yuan and G. J. Zhou, Inorg. Mater., 2003, 39, 1326–1328 CrossRef CAS.
- I. I. Hinic, G. M. Stanisic and Z. V. Popovic, J. Sol–Gel Sci. Technol., 1999, 14, 281–289 CrossRef CAS.
- S. Hu, F. Li and Z. Fan, Bull. Korean Chem. Soc., 2012, 33, 1895–1899 CrossRef CAS.
- D. O. Scanlon, C. W. Dunnill, J. Buckeridge, S. A. Shevlin, A. J. Logsdail, S. M. Woodley, C. R. A. Catlow, M. J. Powell, R. G. Palgrave, I. P. Parkin, G. W. Watson, T. W. Keal, P. Sherwood, A. Walsh and A. A. Sokol, Nat. Mater., 2013, 12, 798–801 CrossRef CAS PubMed.
- J. B. Veluru, R. R. S. Bhavatharini and S. Ramakrishna, RSC Adv., 2014, 4, 19251–19256 RSC.
- Q. Chen, G. H. Du and S. L. M. Z. Peng, Acta Crystallogr., Sect. B: Struct. Sci., 2002, 58, 587 CrossRef CAS PubMed.
Footnote |
† Electronic supplementary information (ESI) available. See DOI: 10.1039/c4ra03498h |
|
This journal is © The Royal Society of Chemistry 2014 |
Click here to see how this site uses Cookies. View our privacy policy here.