Hierarchical multiple peeling simulations

F. Bosia a, S. Colella a, V. Mattoli b, B. Mazzolai b and N. M. Pugno *cde
aDepartment of Physics and Nanostructured Interfaces and Surfaces Interdepartmental Centre, Università di Torino, Via P. Giuria 1, 10125, Torino, Italy. E-mail: federico.bosia@unito.it; Fax: +39 0116707200; Tel: +39 0116707889
bCenter for Micro-BioRobotics, Istituto Italiano di Tecnologia, Viale Rinaldo Piaggio 34, 56025 Pontedera, Italy
cLaboratory of Bio-Inspired & Graphene Nanomechanics, Department of Civil, Environmental and Mechanical Engineering, Università di Trento, via Mesiano, 77, I-38123 Trento, Italy. E-mail: nicola.pugno@unitn.it; Fax: +39 0461282599; Tel: +39 0461282525
dCenter for Materials and Microsystems, Fondazione Bruno Kessler, Via Sommarive 18, I-38123 Povo (Trento), Italy
eSchool of Engineering and Materials Science, Queen Mary University of London, Mile End Road, London E1 4NS, UK

Received 16th April 2014 , Accepted 27th May 2014

First published on 27th May 2014


Abstract

The phenomenon of the exceptional dry adhesion achieved by some natural biological materials has been widely investigated in recent years. In particular, the analysis of the terminal elements of gecko pads and their specific structure and topology has led to the development of bioinspired synthetic fibrillar adhesives, including mushroom-shaped tips. To model the expected adhesion and detachment behaviour of multiple contacts, only recently the last author has derived a theory of multiple peeling, extending the pioneering energy-based single peeling theory of Kendall, including large deformations and pre-stretching. In this contribution, we study the problem of the adhesion of single and multiple contacts using finite element analysis, with the aim of studying complex peeling geometries. Both non-hierarchical tape-like and hierarchical geometries are considered, and the adhesive properties are compared, showing a marked improvement in the latter case. Results are promising and the numerical approach can be exploited in future attempts to determine optimal configurations and improve the adhesion of artificial bioinspired structures.

Introduction

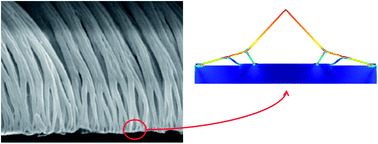
One of the most intriguing and widely studied phenomena in recent years in the field of biomaterials, is that of natural adhesives, due to their exceptional ability to adhere to various types of surfaces.1 In some cases, this is simply due to so-called “dry adhesion”, which depends on van der Waals and possibly capillary forces, and is not mediated by the release of chemical substances.2,3 Gecko adhesion is particularly remarkable, since adhesion strengths of up to 1 MPa are achieved, corresponding to adhesive forces about ten times the animal's body weight.4–6 Furthermore, this strong adhesion is combined with easy detachment, thanks to the variation of attachment angle, and self-cleaning.7 These properties are closely associated to the hierarchical structure of the gecko pads, which split up into micrometre-sized setae and sub-micrometre-sized spatulae (Fig. 1a).8,9 The same type of architecture is found in other insects that rely on strong adhesion, such as flies or spiders.1 Interestingly, the size of terminal contacts in the different organisms has been found to be inversely proportional to the their mass.2 In other terms, the number of terminal contacts increases with insect or animal mass, up to billions of contacts in the case of a single gecko pad. Various attempts have been made to imitate the gecko pad structure to fabricate artificial adhesives, typically using mushroom-shaped micrometric terminal elements manufactured using polymeric materials,10–13 although hierarchical architectures remain to be efficiently implemented. Climber robots have also been designed, exploiting these bioinspired adhesive films.14,15 The mushroom-shaped elements in artificial adhesives replicate the 2D profile of gecko spatulae,16,17 and the detachment mechanism of both is reminiscent of the peeling process of a tape-like film from a substrate.18
image file: c4ra03459g-f1.tif
Fig. 1 Examples of hierarchical structures for the optimization of adhesion found in nature: (a) gecko pad setae and spatulae (from ref. 9); and (b) attachment disc fibers from the black widow spider, L. hesperus at ×100 magnification, i.e. the larger side of the figure corresponds to about 50 μm (from ref. 23).

In previous work, Pugno addressed the problem of multiple peeling17 of a tape from a substrate, and then compared it to the case of conical peeling,19 generalizing the single peeling theory by Kendall20 and finding an optimal peeling angle, which is a function of tape rigidity and surface energy, at which adhesion is maximised.5 Also, it was shown that it is possible to consider a multiple peeling problem as a superposition of single peeling ones.17 The theory of multiple peeling can be extremely useful in the modelization of adhesion problems in nature, and has been numerically validated, e.g. in the case of spider web anchorages21 (e.g. see Fig. 1b). However, in the case of such complex, hierarchical architectures, a numerical approach can be more appropriate.22 The objective of this paper is thus to numerically calculate the predictions of multiple peeling theory using a finite element approach, and explore the effectiveness of hierarchical adhesive structures, in view of their exploitation in bioinspired structures.

Theory

As mentioned previously, the peeling of a single tape-like film from a surface can be treated using Kendall's theory,20 which for rigid tapes predicts a total peeling force F
 
image file: c4ra03459g-t1.tif(1)
where 2γ is the surface energy released at delamination, b is the total width of the tape, and α is the peeling angle. This indicates that contact splitting, such as that obtained by a hierarchical structure, can enhance the total adhesive force by increasing the total width of the terminal elements (“peeling line”). This was also experimentally verified by Varenberg et al.,16 who considered various different insect and animal species that exploit adhesion, and showed an increase in the total peeling line with their body mass. Again, geckos provide the highest adhesive values, with peeling lines extending to kilometres for a single pad detachment.6

Multiple peeling theory17 provides a generalization to Kendall's formulation for N adhesive tapes converging to a common point, determining the adhesive force in the case of symmetric tapes as:17

 
P = NYA[thin space (1/6-em)]sin[thin space (1/6-em)]αεC(2)
where Y is the tape Young's modulus, A its cross section area, α the common peeling angle, and
 
image file: c4ra03459g-t2.tif(3)
is the critical strain (in the absence of prestrain), with λ = γ/(tY), where t is the tape thickness.17Eqn (3) can be rewritten for two opposite limiting cases, namely17
 
image file: c4ra03459g-t3.tif(4)
for “soft” tapes (i.e. for λ ≫ 1), and
 
image file: c4ra03459g-t4.tif(5)
for “rigid” tapes (i.e. for λ ≪ 1).17 The computed force displays a maximum value for a specific peeling angle, as a function of the parameter λ, i.e. basically the ratio between surface energy and tape rigidity. A smart mechanism of angle optimization takes place in this type of anchorage problem, whereby the ideal angle before delamination is reached simply through a load increase.17 Moreover, as the detachment proceeds, the peeling angle is stabilized to a limiting value that only depends on tape geometry and material properties.17 The theory of multiple peeling has been previously verified in the case of axisymmetric peeling of a membrane,19 however not in the simple case of double peeling of a tape, which is addressed in the Sections below, including hierarchical architectures.

Numerical simulations

To evaluate hierarchical multiple peeling configurations, Finite Element Model (FEM) simulation are carried out using the Structural Mechanics module of the COMSOL Multiphysics® commercial code. The interface between the tape and substrate is modelled adopting a Cohesive Zone Model (CZM),24 based on a stress-softening constitutive law before delamination, schematically shown in Fig. 2. In the figure, σ represents the cohesive stress, σmax the peak cohesive stress, Δ the cohesive zone displacement, Δmax the displacement at peak stress, Δbreak the displacement at delamination. Both the loading and softening branches of the law are approximated to a linear behaviour, for simplicity.
image file: c4ra03459g-f2.tif
Fig. 2 Constitutive relation for the cohesive zone used in the finite element model. The plot shows a linear elastic behaviour up to peak stress, and then a linear softening behaviour up to delamination.

One of the main known problems with CZM in a finite element model is the size of the cohesive zone elements: if the mesh is too coarse, oscillations in the solution may occur and convergence problems may be encountered.25 Thus, extensive preliminary simulations were performed to evaluate convergence issues, and to assess the need for mesh refinement at the expense of computational cost. In the case of relatively simple 2-D geometries, such as those considered in the following sections, the approach is well suited, since typically models require less than 105 degrees of freedom, and computing times are limited to a few minutes for each simulation. For more complex 3D geometries, the CZM approach is probably not the best suited method, and other numerical techniques are under development.

Results and discussion

Double peeling simulations and comparison with theoretical predictions

To begin with, to verify the reliability and convergence conditions of the code, and also to further check the validity of the theory, FEM simulations are carried out on the simplest possible configuration, i.e. a double peeling geometry. As mentioned, a 2-D model is considered to simulate the peeling from a substrate of two tape-like thin films converging to a single point, and forming an initial angle α0 with the adhering surface (Fig. 3). A vertical displacement δ is applied to the mid-point and the corresponding reaction force P calculated, as well as strains and stresses in the tape.
image file: c4ra03459g-f3.tif
Fig. 3 Simulation configuration for symmetrical double peeling of a tape from a substrate, with the application of a vertical load P and an initial peeling angle α0. A typical FEM mesh is also shown.

The film geometry and material parameters are chosen consistently with previous works on multiple peeling,19i.e. b = 10−2 m, t = 10−3 m, Y = 3 MPa, ν = 0.45 (where ν is the Poisson's ratio), corresponding to a relatively “soft” biological or polymeric material. The parameters in the CZM (represented in Fig. 2) are chosen so as to obtain adhesion strengths in the range of σmax from 105 to 106 Pa, typical of gecko adhesion. Corresponding P vs. δ curves are shown in Fig. 4a, showing an initial load increase as the tapes deform, a peak load at which delamination occurs, and a subsequent plateau during the peeling phase. Fig. 4b documents the variation of the corresponding adhesive force as a function of Young's modulus Y: the force increase with Y can be approximated with a power-law behaviour with an exponent of about 0.25, i.e. in agreement with the intermediate prediction of eqn (4) and (5).


image file: c4ra03459g-f4.tif
Fig. 4 (a) Load vs. displacement curves relative to multiple peeling simulations of double tapes of increasing Young's modulus Y. (b) Delamination load vs. tape Young's modulus.

Load vs. displacement curves also strongly depend on the chosen adhesive strength parameters in simulations, corresponding to different surface energy γ values in the theory. This is shown in Fig. 5 for a constant tape Young's modulus value of Y = 3 MPa. From a qualitative point of view, increasing adhesive strength leads to a characteristic instability, or “stick-slip” behaviour (Fig. 5a), which has been previously reported in the literature,26 and is a feature that can be captured numerically. The increase in delamination load with increasing tape adhesive strength is shown in Fig. 5b, in a log–log plot. The data can be fitted with a power law with exponent ∼0.75. Observing that 2*γ = σmax*Δbreak/2, this exponent is qualitatively consistent with the two limits in eqn (4) and (5), predicting a dependency with respect to γ with exponent between 0.5 and 1.


image file: c4ra03459g-f5.tif
Fig. 5 (a) Load vs. displacement curves relative to multiple peeling simulations of double tapes for increasing adhesive strength σmax = 30, 300, 3000 kPa. (b) Delamination load vs. adhesive strength σmax in log–log scale.

Next, we compare more in detail the predictions of multiple peeling theory with simulation results. To do this, we adopt the same normalization as in ref. 19, namely P* = P/(Y*bt), where Y* = Y/(1 − ν2). We thus introduce h, the initial vertical displacement before loading, and a, the delaminated tape length, we use the normalized quantities a* = a/h and δ* = δ/h. The initial pulling angle α0 in Fig. 3 is therefore α0 = a tan(h/a). Multiple peeling theory predicts for the double peeling of a tape:

 
image file: c4ra03459g-t5.tif(6)
and
 
image file: c4ra03459g-t6.tif(7)

These equations predict the dependence of the dimensionless peeling force P* as a function of the peeling angle α as well as of the dimensionless detached length a*, as shown in Fig. 6(a) and (b), respectively. The numerical results, computed for various values of α0, compare very well with analytical ones calculated for γ/(Y*t) = 10−4 in P* vs. α curves shown in Fig. 6(a). Notice that good agreement is obtained also for α0 = 0, i.e. an initially full-adhered tape. This means that in FEM simulations, an initially fully-adhered film can be considered a valid equivalent configuration for multiple peeling analysis, including for the hierarchical structures considered in the following section. The peeling force vs. delaminated tape length shows good agreement between analytical and numerical calculations for small values of a*, but some discrepancies appear for larger a* values, with analytical calculations greater than the numerical saturation force values, but overall the good agreement between numerical and analytical values confirms the validity of the FEM approach.


image file: c4ra03459g-f6.tif
Fig. 6 (a) Dimensionless peeling force P* as a function of peeling angle α calculated analytically and numerically. (b) P* as a function of dimensionless delaminated tape length a*. Numerical values are calculated for various initial tape angles α0.

Finally, we calculated the adhesive force during delamination for the same symmetrical double tape as previously, in the case of a non-vertical imposed displacement, comparing load–displacement curves for varying application angles β with respect to the vertical direction (β = 0). Results are shown in Fig. 7. Absolute values of both the load P and the displacement δ are plotted, i.e. accounting for both vertical and horizontal components. We notice that the curves coincide up to the initial delamination point, after which they become clearly separated, i.e. a greater applied load is necessary to obtain the same displacement for increasing loading angles, also changing the stability of the system.


image file: c4ra03459g-f7.tif
Fig. 7 Load–displacement curves for double peeling of an initially fully adhered tape for various loading angles β from the vertical direction (β = 0).

Hierarchical peeling simulations

Next, we consider hierarchical peeling architectures and compare them to the afore-mentioned non-hierarchical multiple-peeling geometry. Again, we start from the simplest geometry to verify the influence of hierarchy only. We thus consider a first-level hierarchical geometry (“H1”), where the two tapes branch out in a self-similar manner into two further tapes each, so that there are 22 = 4 anchorage points, at equal distances from the centre. The second-level hierarchical geometry (“H2”) replicates this to a further level, so that there are 23 = 8 anchorage points, again at the same distance from the centre. These structures are shown in Fig. 8. The three configurations are compared for the same peeling line, length, and thickness, and all three start from a fully adhered tape.
image file: c4ra03459g-f8.tif
Fig. 8 FEM simulations of hierarchical peeling configurations, pictured for different imposed displacement δ values. H0: non-hierarchical configuration; H1 = first-level hierarchy; H2: second-level hierarchy. Colour scale represents Von Mises stresses in Pa (scale bar shown on the right).

The different delamination mechanisms are pictured in Fig. 8, and the corresponding load–displacement curves are shown in Fig. 9. It is apparent that increasing hierarchy increases the number of delamination points in the tape, thus distributing and reducing the stresses at the interface. This helps in avoiding stress concentrations and an early onset of tape delamination. On the other hand, tape deformation and internal stresses are generally greater. This is reflected in sample load–displacement curves reported in Fig. 9. The resulting variation in adhesive properties of the three structures is documented in Table 1. There is an increase in adhesive force Pmax with hierarchy, i.e. the geometry with the highest hierarchical level achieves the best adhesion. The effect is considerable, with an increase in the adhesive force of over 3 times for H1 and over 4 times for H2. The corresponding increase in the imposed displacement at which the first delamination occurs, δdelam, is even more marked, reflecting the possibility of achieving greater reversible deformations in hierarchical geometries. On the other hand, the displacement at full delamination is slightly smaller for hierarchical configurations with respect to the non-hierarchical tape, though the decrease is small. Finally, dissipated energy, which can be obtained as the area underlying the load–displacement curves, also increases for H1 and H2, showing how hierarchy favours an increase in both the strength and toughness of the adhesive interface (Table 1).


image file: c4ra03459g-f9.tif
Fig. 9 Load–displacement curves for H0, H1 and H2 configurations in the peeling simulations shown in Fig. 8.
Table 1 Variation in adhesive properties of hierarchical adhesive structures (H1, H2) with respect to a non-hierarchical tape (H0) (see text for details)
  P max δ delam δ max E diss
H1 +313% +50% −29% +26%
H2 +414% +1400% −20% +161%


Conclusions

Preliminary FEM simulations have proven to be a valuable tool for the analysis of hierarchical multiple peeling experiments. The numerical approach has been validated and we have shown that our FEM results confirm analytical predictions in simplified geometries, and predict an improvement of adhesion in hierarchical configurations. The present theoretical–numerical comparison is all the more justified, since preliminary experimental data, acquired for standard adhesive tapes on a smooth flat PMMA surface subjected to a central vertical force, confirm theoretical multiple peeling predictions (see ref. 19).

A number of papers in the literature have considered the hypothesis that tapes can undergo frictional sliding before detaching (see e.g.ref. 27). This would cause some modification to predictions: in particular, we would expect the predicted peeling loads after the initial delamination to be greater, especially for small peeling angles, both in single and multiple peeling, and also the energy dissipation to increase. The hypothesis of sliding friction has been invoked in the literature to treat adhesion of biological and bioinspired materials (ref. 28). Future work on this topic will include these tribological aspects in numerical simulations. Moreover, in future we will also evaluate the effect of additional substrate parameters (e.g. surface roughness), study complex 2-D and 3-D geometries, and perform specific case studies, e.g. the case of spider web anchorages. The long term objective is to derive optimization criteria for tailor-made design of artificial materials with smart adhesion and additional functional properties.

Acknowledgements

NMP acknowledges support from the European Research Council, ERC Ideas Starting grant no. 279985 “BIHSNAM: Bio-inspired Hierarchical Super Nanomaterials” and ERC Proof of Concept grants no. 619448 “REPLICA2” and “KNOTOUGH”. FB acknowledges support from BIHSNAM. FB and NMP are supported by the COST action TD0906 on Biological Adhesives.

Notes and references

  1. A. M. Smith and J. A. Callow, Biological adhesives, Springer, Berlin, New York, 2006 Search PubMed.
  2. E. Arzt, S. Gorb and R. Spolenak, Proc. Natl. Acad. Sci. U. S. A., 2003, 100, 10603–10606 CrossRef CAS PubMed.
  3. A. K. Geim, S. V. Dubonos, I. V. Grigorieva, K. S. Novoselov, A. A. Zhukov and S. Y. Shapoval, Nat. Mater., 2003, 2, 461–463 CrossRef CAS PubMed.
  4. K. Autumn, Y. A. Liang, S. T. Hsieh, W. Zesch, W. P. Chan, T. W. Kenny, R. Fearing and R. J. Full, Nature, 2000, 405, 681–685 CrossRef CAS PubMed.
  5. E. Lepore, F. Pugno and N. M. Pugno, J. Adhes., 2012, 88, 820–830 CrossRef CAS.
  6. K. Autumn and A. M. Peattie, Integr. Comp. Biol., 2002, 42, 1081–1090 CrossRef PubMed.
  7. W. R. Hansen and K. Autumn, Proc. Natl. Acad. Sci. U. S. A., 2005, 102, 385–389 CrossRef CAS PubMed.
  8. H. Yao and H. Gao, J. Mech. Phys. Solids, 2006, 54, 1120–1146 CrossRef PubMed.
  9. N. M. Pugno and E. Lepore, J. Adhes., 2008, 84, 949–962 Search PubMed.
  10. G. Carbone, E. Pierro and S. N. Gorb, Soft Matter, 2011, 7, 5545–5552 RSC.
  11. M. Piccardo, A. Chateauminois, C. Fretigny, N. M. Pugno and M. Sitti, J. R. Soc., Interface, 2013, 10, 20130182 CrossRef PubMed.
  12. A. E. Kovalev, M. Varenberg and S. N. Gorb, Soft Matter, 2012, 8, 7560–7566 RSC.
  13. N. M. Pugno, Nano Today, 2008, 3, 35–41 CrossRef.
  14. M. R. Cutkosky and S. Kim, Proc. R. Soc. A, 2009, 367, 1799–1813 CrossRef CAS PubMed.
  15. K. Autumn, A. Dittmore, D. Santos, M. Spenko and M. Cutkosky, J. Exp. Biol., 2006, 209, 3569–3579 CrossRef CAS PubMed.
  16. M. Varenberg, N. M. Pugno and S. N. Gorb, Soft Matter, 2010, 6, 3269–3272 RSC.
  17. N. M. Pugno, Int. J. Fract., 2011, 171, 185–193 CrossRef PubMed.
  18. R. Spolenak, S. Gorb, H. Gao and E. Arzt, Proc. R. Soc. A, 2005, 461, 305–319 CrossRef.
  19. L. Afferrante, G. Carbone, G. Demelio and N. Pugno, Tribol. Lett., 2013, 52, 439–447 CrossRef CAS.
  20. K. Kendall, J. Phys. D: Appl. Phys., 1975, 8, 1449 CrossRef.
  21. N. M. Pugno, S. W. Cranford and M. J. Buehler, Small, 2013, 9, 2747–2756 CrossRef CAS PubMed.
  22. E. Blasingame, T. Tuton-Blasingame, L. Larkin, A. M. Falick, L. Zhao, J. Fong, V. Vaidyanathan, A. Visperas, P. Geurts, X. Y. Hu, C. La Mattina and C. Vierra, J. Biol. Chem., 2009, 284, 29097–29108 CrossRef CAS PubMed.
  23. Y. H. Craig Vierra, E. Gnesa, S. Tang and F. Jeffery in Metal, Ceramic and Polymeric Composites for Various Uses, ed. J. Cuppoletti, In Tech, 2011, pp. 303–324 Search PubMed.
  24. M. Elices, G. V. Guinea, J. Gomez and J. Planas, Eng. Fract. Mech., 2002, 69, 137–163 CrossRef.
  25. A. Shukla, G. Ravichandran and Y. Rajapakse, Dynamic failure of materials and structures/Arun Shukla, ed. G. Ravichandran and Y. D. S. Rajapakse, Springer, New York, 2010 Search PubMed.
  26. R. De, A. Maybhate and G. Ananthakrishna, Phys. Rev. E: Stat., Nonlinear, Soft Matter Phys., 2004, 70, 046223 CrossRef.
  27. M. R. Begley, R. R. Collino, J. N. Israelachvili and R. M. McMeeking, J. Mech. Phys. Solids, 2013, 61(5), 1265–1279 CrossRef PubMed.
  28. Y. Tian, N. Pesika, H. Zeng, K. Rosenberg, B. Zhao, P. McGuiggan, K. Autumn and J. Israelachvili, Proc. Natl. Acad. Sci. U. S. A., 2006, 103(51), 19320–19325 CrossRef CAS PubMed.

This journal is © The Royal Society of Chemistry 2014
Click here to see how this site uses Cookies. View our privacy policy here.