DOI:
10.1039/C4RA03133D
(Paper)
RSC Adv., 2014,
4, 28156-28164
Ultrasonic-assisted synthesis of aminated lignin by a Mannich reaction and its decolorizing properties for anionic azo-dyes
Received
8th April 2014
, Accepted 29th April 2014
First published on 29th April 2014
Abstract
Aminated lignin (AL) was synthesized by a Mannich reaction between hexane-diamine (HD) and lignin with the assistance of ultrasound. The structure and properties of AL were characterized by Fourier transform-infrared spectroscopy (FT-IR) and thermogravimetric analysis (TGA). The effect of AL content, initial dye concentration, pH and settling time on the dye decolorization, and chemical oxygen demand (COD) removal were studied. The decolorization efficiency and flocculation capacity of AL were obviously better than that of lignin. Coagulation–flocculation models of AL were studied. The adsorption isotherms of AL for Congo red and EBBR in aqueous solutions could be fitted by the Langmuir model, and the adsorption kinetics were closer to a pseudo second-order equation. Its performance as a cationic flocculant in removing two anionic azo-dyes (Congo red and Eriochrome blue black R (EBBR)) from simulated wastewater was studied. There was a different optimal dose of flocculant for each dye in wastewater, at which dye removal could reach 96%.
1. Introduction
Azo dyes are a class of organic compound that contain azo groups connecting aryl groups, and are most widely used in printing and dyeing processes in textiles and clothing manufacture. Therefore, azo-dyes extensively exist in the industrial wastewater from textiles and clothing manufacture. Some studies have suggested that azo dyes can generate toxic degradation products.1,2 Under specific conditions, azo dyes can be decomposed to produce more than 20 kinds of carcinogenic aromatic amines. Hence, the removal of toxic anionic azo-dyes from printing and dyeing wastewater has become an issue of great interest and significant effort.
Adsorption,3,4 degradation5,6 and coagulation–flocculation7,8 were conventional methods applied in the treatment process of wastewater. Nevertheless, many small organic molecules remain in the water after degradation, which may be harmful to human beings. Coagulation–flocculation can avoid this problem by precipitating dye molecules. As is well known, inorganic and organic coagulants are two main coagulants used in coagulation–flocculation treatment, however, the application of inorganic coagulants is limited because of the remaining metal ions in the water. Organic coagulants like cyclodextrin,9 protein10 and lignin11 are attracting growing attention due to their easy obtainment and renewability.
Lignin is the by-product of the pulp and paper industry. It is generally considered to be of low value and limited commercial potential.12 To solve these problems, the conversion of low-cost lignin waste into other valuable products is extremely attractive.13 Lignin is non-toxic, cheap and eco-friendly, and has already been used as a water treatment agent,14 asphalt emulsifier,15 surface-active agent,16 etc. Lignin separated from black liquor can be applied as a flocculant, for example, low-molecular-weight lignosulfonate reacts with protein to form a complex which is insoluble in acid solution, and lignosulfonate with high molecular weight can turn protein into floccules.17 However, a lower molecular weight and poorly activated adsorption point weaken its flocculating performance. To address this problem, a Mannich reaction and a polymerization reaction have been applied to modify lignin, thus transforming its spatial structure, introducing new functional groups, increasing its molecular weight and improving its flocculating properties.18,19 Short-chain amines, such as dimethylamine and ethylenediamine, are often applied to synthesize AL, nevertheless, longer chain polyamines, like HD, for use in the synthesis process of AL are rarely reported. In this study, cationic AL was obtained by a Mannich reaction between HD and lignin with ultrasonic assistance. An orthogonal experiment was applied to study the influence of the formaldehyde dosage, amine dosage and temperature on the degree of amination of the lignin to get the optimum technological conditions. The decolorization behavior of anionic azo-dyes in simulated wastewater was investigated by cationic AL. The influence of the flocculant dose, pH and settling time was discussed as well as COD removal and a possible mechanism for the coagulation–flocculation process.
2. Experimental
2.1 Materials
Lignin contains aryl groups, phenolic hydroxyl groups, alcoholic hydroxyl groups, carbon conjugated double bonds, and so on. The alkali lignin used in our experiment was obtained from the black liquor of a kraft pulp mill in the Guizhou Province, and can be described as; molecular weight: 1000–100![[thin space (1/6-em)]](https://www.rsc.org/images/entities/char_2009.gif) 000, water insoluble matter: ≤3.0%, pH: 10–12, moisture: ≤5.0%. The black liquor was treated by the following steps: acidification, coagulation of the sedimentation, washing with deionized water, and drying in air and the results of elemental analysis show that there is no S in this lignin. All of the other chemicals were of analytical grade and used without further purification.
000, water insoluble matter: ≤3.0%, pH: 10–12, moisture: ≤5.0%. The black liquor was treated by the following steps: acidification, coagulation of the sedimentation, washing with deionized water, and drying in air and the results of elemental analysis show that there is no S in this lignin. All of the other chemicals were of analytical grade and used without further purification.
2.2 Preparation of AL
In this study, lignin, formaldehyde and HD were used to synthesize cationic AL by a Mannich reaction. Three factors and three levels of orthogonal experiment (L9 (33)) were applied to determine the relationship between modification of the lignin and HD (A1, A2, and A3), formaldehyde (B1, B2, and B3), and temperature (C1, C2, and C3). The factors and levels of the orthogonal experiment are shown in Table 1 (ki (i = 1, 2, 3): mean values of each factor at different levels, R: extremum of each factor).
Table 1 L9 (3)3 orthogonal test results of the modification experiments
| No. |
Factors |
N content/% |
Relative viscosity/mPa s |
| HD/g |
Formaldehyde/mL |
Temperature/°C |
| A |
B |
C |
| 0# |
|
|
|
0.023 |
1.010 |
| 1# |
A1 (2.0) |
B1 (1.0) |
C1 (60) |
6.862 |
1.375 |
| 2# |
A1 (2.0) |
B2 (2.0) |
C2 (75) |
6.980 |
1.384 |
| 3# |
A1 (2.0) |
B3 (3.0) |
C3 (90) |
7.220 |
1.391 |
| 4# |
A2 (4.5) |
B2 (2.0) |
C1 (60) |
8.886 |
1.490 |
| 5# |
A2 (4.5) |
B3 (3.0) |
C2 (75) |
7.862 |
1.403 |
| 6# |
A2 (4.5) |
B1 (1.0) |
C3 (90) |
5.322 |
1.309 |
| 7# |
A3 (7.0) |
B3 (3.0) |
C1 (60) |
7.800 |
1.399 |
| 8# |
A3 (7.0) |
B1 (1.0) |
C2 (75) |
6.184 |
1.347 |
| 9# |
A3 (7.0) |
B2 (2.0) |
C3 (90) |
7.675 |
1.402 |
| 10# |
|
|
|
8.181 |
1.429 |
| |
| k1 |
7.021 |
6.123 |
7.849 |
| k2 |
7.357 |
7.853 |
7.009 |
| k3 |
7.285 |
7.627 |
6.739 |
| R |
0.336 |
1.730 |
1.110 |
| |
| Best quality level |
A2 |
B2 |
C1 |
|
| Optimal combination |
A2 B2 C1 |
|
| Primary and secondary order |
B > C > A |
|
4.0 g lignin and 5.5 mL 0.4 mol L−1 NaOH were added to a 250 mL three-necked flask. The mixture was vigorously stirred at room temperature for about 10 minutes to ensure that the lignin was fully dissolved. Specified amounts of formaldehyde, HD and deionized water were then successively added into the flask to form a 100 mL solution with continuous stirring. After ultrasonic treatment (with a KQ-250 ultrasonic device (Kunshan, China), P = 250 W, output frequency = 40 kHz) for a specified time, the flask was heated in a water bath with refluxing and stirring for 3 h. 9 samples were prepared by the orthogonal design.
2.3 Measurement and characterization of AL
The nitrogen content of the lignin samples was determined with a PerkinElmer 2400II elemental analyzer (US) in this study. The viscosity of the samples was measured using an Ubbelohde viscometer at 25 °C. FT-IR spectra were recorded on a Nicolet Nexus 470 Fourier transform IR spectrophotometer (Thermo Electron. Corp., MA, USA). The samples were thoroughly ground with exhaustively dried KBr. Ultraviolet spectra of the lignin samples were obtained in the range 200–800 nm with a UV-2450 ultraviolet and visible spectrophotometer (UV-Vis) (Shimadzu, Japan). Thermogravimetric analysis (TGA) was performed on a TA 2449C thermal analyzer (NETZSCH, Germany), using 10 mg of the material sample. The samples were heated from room temperature to 700 °C at a heating rate of 10 °C min−1 under a highly purified nitrogen atmosphere.
2.4 Coagulation–flocculation experiments
50 mL aqueous Congo red solution of a known concentration was poured into a beaker, and then a specified weight of AL was added into the solution in the beaker and after 5 min of magnetic stirring, the mixture was left for 48 hours. The resultant supernatant of the solution was subsequently extracted and centrifuged for 5 minutes. 50 mL EBBR solution was tested by the same process.
An ultraviolet absorption spectrophotometer was used to determine the absorbance. λm was set at 499 nm for Congo red and 511 nm for EBBR. The decolorization efficiency, α = (C0 − C)/C0 × 100% (C0 is the initial concentration of the dye solution and C is the concentration of the dye solution after decolorization), was determined.
3. Results and discussion
3.1 Orthogonal experimental results
Among the current methods, the viscosity method is the most commonly used method for determining the viscosity average molecular weight of a polymer. For an infinitely dilute solution, the intrinsic viscosity, [η], can be measured by the following formula:  , where ηr is the relative viscosity, and c is the concentration of the polymer solution.20 Experimental plots of lnηr/c against c are usually very nearly linear for ηr < 2. When extrapolated to infinite dilution, (i.e., c → 0), by the intercept value, [η] can be confirmed.
When the operating fluid is an infinitely dilute polymer solution, ηr can be inferred from the simple equation of the form ηr = η/η0 = t/t0, where η, η0, t and t0 represent the solution viscosity, the pure solvent viscosity, the flow time for the solution and the solvent in a given Ubbelohde viscometer, respectively. According to the formula 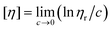 , if the ηr value of the solution is greater, correspondingly, [η] is also greater for the different kinds of polymer solutions with the same concentration. The viscosity average molecular weight of a polymer can be calculated from the Mark–Houwink equation: [η] = KMα. In the formula, K and α are two parameters which depend on the variety of the solvent, the temperature of viscosity determination and the type of polymer.21 According to the Mark–Houwink equation, the higher the molecular weight (M) of a given polymer, the greater the intrinsic viscosity ([η]) produced by a given weight concentration of polymer. That is, [η] increases with M. Therefore, the molecular weight of different polymers can be compared by the relative viscosity.
HD was successfully grafted onto lignin by a Mannich reaction. The raw lignin used in this study has a very low nitrogen content. The nitrogen content of the AL has a dependence on the grafting ratio of AL. A better grafting modification result leads to a higher nitrogen content. The nitrogen content and viscosity data of the samples synthesized by the orthogonal experiment are shown in Table 1. The nine samples, 1# to 9#, have HD weights of 2.0, 4.5 and 7.0 g (A1, A2 and A3, respectively), volumes of formaldehyde of 1.0, 2.0 and 3.0 mL (B1, B2 and B3, respectively), and temperatures of 60, 75 and 90 °C (C1, C2 and C3, respectively). From Table 1, sample 4# has the highest nitrogen content and relative viscosity, therefore, modification of sample 4# is favoured. In Table 1, sample 0# is raw lignin and samples 1–10# are ALs synthesized from lignin. Sample 10# is AL synthesized according to the proportions used in sample 4#. The ultrasonic activation process for sample 10# was omitted. The nitrogen content of sample 10# is 8.181%, which is lower than that of sample 4#. It is therefore apparent that an ultrasound-assisted process is propitious to the amination of lignin.
As seen from Table 1, it has been found that the influence of AL on the nitrogen content decreases in this order: B > C > A according to the R values. The dosage of formaldehyde was found to be the most important determinant of nitrogen content in the AL. The optimal combination parameters of the processing technology are A2, B2 and C1, namely, a weight of HD of 4.5 g, a volume of formaldehyde of 2.0 mL, and a temperature of 60 °C.
The effect of ultrasonication time on the nitrogen content of the products is shown in Fig. 1, where it can be seen that the nitrogen content of the samples increased with the passage of time. It shows that the effect of ultrasound on the activation of lignin increased as time passed. When the ultrasonication time was more than 30 minutes, the nitrogen content of AL increased slowly and gradually stabilized. Therefore, an ultrasound-assisted time of 30 min was selected as the optimal ultrasonication time.
 |
| | Fig. 1 The effect of ultrasonic pretreatment time on the nitrogen content of the samples. | |
3.2 FT-IR spectroscopy and TGA
The FT-IR spectra of lignin (red) and AL (black) are shown in Fig. 2a and b. The trend and characteristic peaks of AL are in good agreement with that of lignin, which indicates that the skeleton structure of lignin remained basically intact after amination. Nonetheless, there are obvious differences between the two curves, such as a new absorption peak appearing at 2040 cm−1 on the AL curve, which can be attributed to the vibration of primary amine salts. The spectra of lignin shows a syringyl absorbance at 1334 cm−1 and a typical syringyl band at 834 cm−1.22 However, syringyl absorbance bands are not found in the IR spectrum of AL, indicating that the syringyl units dissolved and separated from lignin after the modification. The peak at 1659 cm−1 was assigned to the N–H bending vibration of –NH2, and the peak at 1480 cm−1 was assigned to the C–N bending vibration of quaternary ammonium. The peak at 1363 cm−1 is associated with the stretching vibration of the aromatic amine; bending vibrations of aromatic compounds appear in the range 2000 cm−1 to 1660 cm−1, however the absorption peak is shifted to a higher frequency in the presence of –NHR or –NH2 electron withdrawing groups. In conclusion, an aromatic amine was generated after the modification. It demonstrated that the raw material had reacted with HD successfully.
 |
| | Fig. 2 (a) and (b) FT-IR spectra of the samples. TGA (c) and DTG analysis (d) indicate the traces of (black) AL and (red) lignin. WLR: weight loss rate. | |
TGA curves of the solid powder samples of lignin (red) and AL (black) under a nitrogen atmosphere are shown in Fig. 2c. The weight loss of lignin (Fig. 2c, red) was merely about 8% when it was heated to 150 °C, which can mostly be attributed to water loss in the lignin. The weight loss of lignin was 45% when lignin was heated from 150 °C to 500 °C, due to low-molecular-weight lignin fragment volatilization and lignin decomposition. As with lignin, the weight-loss curve of AL shows a consistent trend (Fig. 2c, black). Nonetheless, the weight loss of AL is more obvious. During the process of modification, the syringyl units dissolved and separated from lignin, which created low-molecular-weight lignin fragments in the AL samples. Therefore, although the molecular weight of AL is greater, the wider molecular weight distribution and the higher proportion of low-molecular-weight parts resulted in the larger weight loss of AL at the same temperature. Accordingly, it shows a larger weight loss with temperature in TGA analysis (Fig 2c).
Differential thermogravimetric (DTG) analysis of AL showed a higher thermal decomposition temperature and larger weight loss than lignin, and its DTG curve shows three endothermic peaks at 60, 118, and 440 °C (Fig. 2d, black). The peak occurring at 60 °C corresponds to the absorbed heat due to moisture volatilization and the peak occurring at 118 °C indicates the loss of low-molecular-weight organic molecules that absorb heat at this temperature. The third endothermic peak occurring at 440 °C indicates the decomposition of higher molecular weight AL and the generation of volatile small molecules under the heating conditions. Furthermore, the initial decomposition temperature and valley temperature of AL are higher than those of lignin with weight loss appearing in the TGA curve. The decomposition step yielded a broad peak, and the weight-loss rate of AL reached a maximum value of 27.2% min−1 at 440 °C, which was larger than that of lignin, which was 21.7% min−1 at 313 °C. The weight of AL decreased slowly in the temperature range 500 °C to 700 °C, which corresponded to the gradual carbonization of AL.
3.3 Coagulation–flocculation experiment
3.3.1 Effect of flocculant dose and inorganic salts. The effect of flocculant dose on the removal of Congo red and EBBR is shown in Fig. 3a and b, respectively. The results indicated that for Congo red and EBBR, the efficiency of dye removal generally increased with the addition of AL. When the dose of AL was small, the increase in the removal percentage from different kinds and concentrations of simulated wastewater under the different flocculant doses was nonlinear. The removal percentage rose very quickly when the amount of AL increased from 100 mg L−1 to 200 mg L−1 for both Congo red and EBBR, and then the dye removal rate remained stable with the addition of more flocculant. This may be attributed to the change in the number of active sites of AL in the solution. At the beginning, the number of active sites increased with the addition of flocculant, which increased the removal percentage, while a reduction in the concentration difference to the simulated wastewater slightly lowered the removal percentage at the end. There was an optimal flocculant dose for every type of simulated wastewater, at which a higher percentage of dye removal could be reached; when C = 10 mg L−1 and Cdose = 200 mg L−1 for Congo red and when C = 30 mg L−1 and Cdose = 200 mg L−1 for EBBR, the dye removal reached 95.5% and 96.2%, respectively. Correspondingly, these data were chosen as the optimum conditions for further experiments. The dye removal results are quite close to some previous reports.5,23 What is more, removal rate data from simulated wastewater for EBBR as a type of azo environmental contaminant have not been previously reported.
 |
| | Fig. 3 The effect of flocculant dose and inorganic ions. Plots a and b show the effect of flocculant dose (C is the concentration of dye solution, C3a = 10 mg L−1, C3b = 30 mg L−1, Cdose = 200 mg L−1, t = 48 h) and c and d show the effect of inorganic ions (C3c = 10 mg L−1, C3d = 30 mg L−1, Cdose = 200 mg L−1, t = 48 h). | |
Inorganic salts, acting as exhausting and retarding agents, play an important role in the application of a variety of dyes in textiles. This led to the idea that inorganic ions may influence the decolorization efficiency of the flocculants. Thus, the effects of sulfate, nitrite and chloride ions on dye removal were investigated. In these experiments, the concentration of the salt ions was 0.01 mol L−1 and the dye concentration was 10 mg L−1 and 30 mg L−1 for Congo red and EBBR, respectively. The dose of flocculant was 200 mg L−1 for both dyes. One experiment was implemented using tap water (which contains SO42−, Cl−, NO2−, ions) instead of deionized water and the settling time was 48 h. From Fig. 3c and d, it can be concluded that these ions have no significant influence on dye removal. Therefore, it can be assumed that Na+ and K+ cations and SO42−, Cl− and NO2− anions do not react with AL during the coagulation–flocculation process.
3.3.2 The influence of pH. Firstly, the influence of pH on λm was investigated. The concentration of both HCl and NaOH used to adjust the pH was 0.1 mol L−1. The initial pHs of Congo red (C = 10 mg L−1) and EBBR (C = 30 mg L−1) were 6.52 and 6.85, respectively. After adjusting to a certain pH, UV curves of the solutions were recorded on an ultraviolet spectrograph. λm of Congo red red shifted with the addition of HCl, while it remained stable in an alkaline environment as shown in Fig. 4a. For EBBR, the λm of the curve was red shifted after the pH was adjusted to alkaline. However, under acidic conditions, λm appeared to be stable as shown in Fig. 4b.
 |
| | Fig. 4 The effect of pH on the dye removal percentage (C4a = 10 mg L−1, C4b = 30 mg L−1, t = 48 h). Plots a and b show the influence of pH on the λm of Congo red and EBBR, respectively and c and d show the influence of pH on the dye removal of Congo red and EBBR, (C4c = 10 mg L−1, C4d = 30 mg L−1, Cdose = 200 mg L−1), respectively. The red spots indicate the initial pH of the dye solution. | |
The pH influence on the dye removal of Congo red and EBBR was also studied, as shown in Fig. 4c and d. The removal percentage of Congo red and EBBR reduced under both acidic and alkaline conditions. The introduction of hydrogen and hydroxyl ions may cause interference to the charge neutralization between cationic AL and anionic azo-dyes.
3.3.3 Effect of settling time. Fig. 5a and b show the effect of settling time on the percentage of dye removal. It can be summarized that the coagulation–flocculation process was slow as most of the flocs didn't settle for 10 h. Large quantities of flocs could be observed at the bottom of the beaker after 24 h. The settling velocity of the dyes was relatively slow in the first 5 h, and they then descended a little faster in the next 5 h due to the appearance of flocs. The ABS curves show a gradual trend with floc precipitation, which means the removal percentage is close to the maximum. Fig. 5e and f are photographs of the Congo red and EBBR solutions, respectively, before (t = 0 h) and after (t = 48 h) decolorization, and it is obvious that AL was used for the treatment of dyeing wastewater, as it is effective with most dye flocs settling at the bottom of the beakers. Because of the low-dose of AL used, there was correspondingly less sludge production, but a high removal efficiency was achieved.
 |
| | Fig. 5 The effect of settling time. Plots a and c show the effect of settling time on the dye removal of Congo red (C5a = C5c = 10 mg L−1, Cdose = 200 mg L−1, t = 48 h), and b and d show the effect of settling time on the dye removal of EBBR (C5b = C5d = 30 mg L−1, Cdose = 200 mg L−1, t = 48 h). The flocculant used in c and d is lignin without further treatment. e and f are photographs of the Congo red and EBBR solutions from a and b before (t = 0 h) and after (t = 48 h) decolorization. | |
From Fig. 5c and d, it can be illustrated that lignin had a poor effect on the removal of these two anionic azo-dyes. This may be attributed to the fact that most of the functional groups of lignin are hidden in its three-dimensional network structure,24–26 which resulted in a lack of cationic active sites in lignin, and thus the anionic dye molecules remained separated because of the repulsive forces between the charges.
3.3.4 COD removal. Chemical oxygen demand (COD) is a very important index to evaluate water pollution. The COD value of the chosen samples was also measured by the Chinese national standard GB11914-89; concentrated phosphoric acid (84%) and concentrated sulfuric acid (98%) were used as catalysts in this experiment. The COD values of Congo red (10 mg L−1) and EBBR (30 mg L−1) were 21.6 mg L−1 and 64 mg L−1, respectively, and after decolorization, the COD values of these two dyes reduced to 8.1 mg L−1 and 6.1 mg L−1, respectively. Therefore the COD removal percentages of Congo red and EBBR are 62.9% and 90.4%, correspondingly, which are close to or even better than in some similar coagulation processes.7,27
3.3.5 Discussion of the coagulation–flocculation mechanism. Charge neutralization and micro-bridging are two main mechanisms affecting the coagulation–flocculation process.27,28 During this experiment, charge neutralization occurred between cationic AL and the anionic azo-dyes, so the less charged dye molecules were confined to the cationic active spots of AL. Due to micro-bridging of AL, these molecules connected with each other to form larger molecules and generated flocs. Step by step, the flocs increased in size and eventually precipitated out. In this experiment, the coagulation–flocculation process is quite slow. To explain this, a hypothesis that charge neutralization might be the controlling mechanism was proposed. Although sample 4#, which has a nitrogen content of 8.836%, is the best aminated sample, its nitrogen content is still too low. The nitrogen content is directly related to the number of cationic active sites. Furthermore, lignin itself is short of cationic active spots (discussed in Section 3.3.3). Therefore, a lack of cationic active sites will slow down the coagulation–flocculation process by slowing down the charge neutralization procedure. A schematic drawing has been produced to clarify the whole process (Fig. 6).
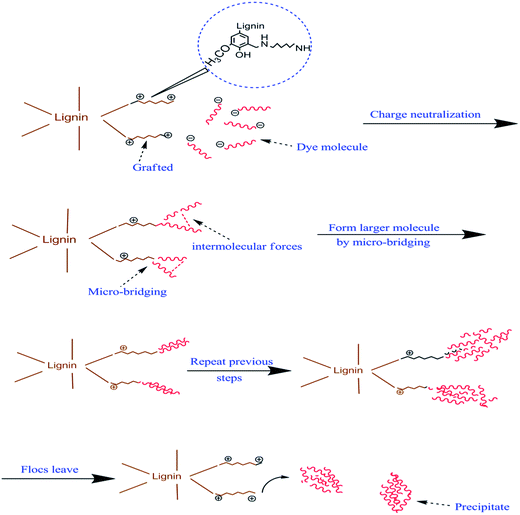 |
| | Fig. 6 A schematic drawing of the coagulation–flocculation process. | |
3.4 Coagulation–flocculation models
4. Conclusion
Cationic AL was obtained by a Mannich reaction between HD and lignin. Ultrasonic processing contributed to improving the reactivity of lignin. The molecular weights of the ALs are higher than that of lignin. After settling for 48 h, the anionic dye removal rate was close to 96% and adjustment of the pH had a negative effect on dye removal. When biodegradable AL is used in the treatment of organic dye wastewater, the advantages are quite obvious: low-dose, low sludge production and a high removal efficiency, making AL a promising flocculant for commercial application in the field of wastewater treatment.
Acknowledgements
We gratefully acknowledge the National Natural Science Foundation of China (21075054, 21004031), the Open Project Program of State Key Laboratory of Analytical Chemistry for Life Science (Nanjing University) (KLACLS1010), the Program of Department of Education of Jiangsu Province (12KJD610003), the National Postdoctoral Foundation of China (20090461065), the National Postdoctoral Foundation of Jiangsu Province (1001034B) and the Natural Science Foundation of Jiangsu Province (BK20131249, BK2011459) for financial support of this research.
References
- V. M. A. S. Grinevicius, R. Geremias, R. Laus, K. F. Bettega, M. C. M. Laranjeiras, V. T. Favere, D. Wilhelm and R. C. Pedrosa, Arch. Environ. Contam. Toxicol., 2009, 57, 307–314 CrossRef CAS PubMed.
- G. Mezohegyi, F. P. van der Zee, J. Font, A. Fortuny and A. Fabregat, J. Environ. Manage., 2012, 102, 148–164 CrossRef CAS PubMed.
- J. L. Figueiredo, J. P. S. Sousa, C. A. Orge, M. F. R. Pereira and J. J. M. Orfao, Adsorption, 2011, 17, 431–441 CrossRef CAS.
- S. Pirillo, M. L. Ferreira and E. H. Rueda, Ind. Eng. Chem. Res., 2007, 46, 8255–8263 CrossRef CAS.
- M. S. Khehra, H. S. Saini, D. K. Sharma, B. S. Chadha and S. S. Chimni, Dyes Pigm., 2006, 70, 1–7 CrossRef CAS PubMed.
- J. He, Q. Z. Cai, Q. Luo, D. Q. Zhang, T. T. Tang and Y. F. Jiang, Korean J. Chem. Eng., 2010, 27, 435–438 CrossRef CAS PubMed.
- F. El-Gohary and A. Tawfik, Desalination, 2009, 249, 1159–1164 CrossRef CAS PubMed.
- J. B-Heredia and J. S. Martin, Color. Technol., 2008, 124, 310–317 Search PubMed.
- E. Yilmaz, S. Memon and M. Yilmaz, J. Hazard. Mater., 2010, 174, 592–597 CrossRef CAS PubMed.
- A. Mittal, V. Thakur and V. Gajbe, Environ. Sci. Pollut. Res., 2013, 20, 260–269 CrossRef CAS PubMed.
- M. N. Mohamad Ibrahim, W. S. Wan Ngah, M. S. Norliyana, W. R. Wan Daud, M. Rafatullah, O. Sulaiman and R. Hashim, J. Hazard. Mater., 2010, 182, 377–385 CrossRef PubMed.
- A. L. Korich, A. B. Fleming, A. R. Walker, J. F. Wang, C. B. Tang and P. M. Iovine, Polymer, 2012, 53, 87–93 CrossRef CAS PubMed.
- Y. R. Guo, F. D. Yu, G. Z. Fang and Q. J. Pan, J. Alloys Compd., 2013, 552, 70–75 CrossRef CAS PubMed.
- D. Yang, L. X. Zhong, T. Q. Yuan, X. W. Peng and R. C. Sun, Ind. Crops Prod., 2013, 43, 141–149 CrossRef CAS PubMed.
- L. I. Tolosa, A. J. Rodriguez-Malaver, A. M. González and O. J. Rojas, J. Colloid Interface Sci., 2006, 294, 182–186 CrossRef CAS PubMed.
- B. Kosikova, M. Duris and V. Demianova, Eur. Polym. J., 2000, 36, 1209–1212 CrossRef CAS.
- B. L. Henry, J. N. Thakkar, A. Y. Liang and U. R. Desai, Biochem. Biophys. Res. Commun., 2012, 417, 382–386 CrossRef CAS PubMed.
- N. E. El Mansouri and J. Salvado, Ind. Crops Prod., 2006, 24, 8–16 CrossRef CAS PubMed.
- H. Sadeghifar, C. Z. Cui and D. S. Argyropoulos, Ind. Eng. Chem. Res., 2012, 51, 16713–16720 CrossRef CAS.
- J. Yamanaka, H. Matsuoka, H. Kitano, M. Hasegawa and N. Ise, J. Am. Chem. Soc., 1990, 112, 587–592 CrossRef CAS.
- P. J. Flory, Principles of polymer chemistry, Cornell University Press, Ithaca, New York, 1953 Search PubMed.
- J. R. Obst, Holzforschung, 1982, 36, 143–152 CrossRef CAS.
- A. L. Xue, S. Y. Zhou, Y. J. Zhao, X. P. Lu and P. F. Han, J. Hazard. Mater., 2011, 194, 7–14 CrossRef CAS PubMed.
- J. L. Wen, B. L. Xue, F. Xu, R. C. Sun and A. Pinkert, Ind. Crops Prod., 2013, 42, 332–343 CrossRef CAS PubMed.
- M. Funaoka, React. Funct. Polym., 2013, 73, 396–404 CrossRef CAS PubMed.
- M. Foston, G. A. Nunnery, X. Z. Meng, Q. N. Sun, F. S. Baker and A. Ragauskas, Carbon, 2013, 52, 65–73 CrossRef CAS PubMed.
- F. Boumechhour, K. Rabah, C. Lamine and B. M. Said, Water Environ. J., 2013, 27, 114–119 CrossRef CAS PubMed.
- K. E. Lee, N. Morad, T. T. Teng and B. T. Poh, Chem. Eng. J., 2012, 203, 370–386 CrossRef CAS PubMed.
- I. Langmuir, The constitution and fundamental properties of solids and liquids, J. Am. Chem. Soc., 1916, 38, 2221–2295 CrossRef CAS.
- H. J. Butt, K. Graf and M. Kappl, Physics and chemistry of interfaces, Wiley-VCH, Weinheim, 2003, pp. 185–193 Search PubMed.
- Y. S. Ho, J. F. Porter and G. McKay, Water Air Soil Pollut., 2002, 141, 1–33 CrossRef CAS.
- Y. S. Ho and G. McKay, Chem. Eng. J., 1998, 70, 115–124 CrossRef CAS.
- V. Vadivelan and K. V. Kumar, J. Colloid Interface Sci., 2005, 286, 90–100 CrossRef CAS PubMed.
|
| This journal is © The Royal Society of Chemistry 2014 |
Click here to see how this site uses Cookies. View our privacy policy here. 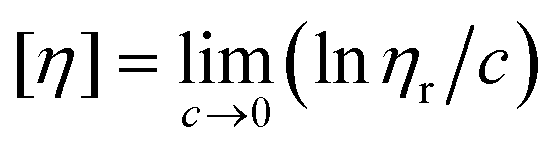 , where ηr is the relative viscosity, and c is the concentration of the polymer solution.20 Experimental plots of ln
 , if the ηr value of the solution is greater, correspondingly, [η] is also greater for the different kinds of polymer solutions with the same concentration. The viscosity average molecular weight of a polymer can be calculated from the Mark–Houwink equation: [η] = KMα. In the formula, K and α are two parameters which depend on the variety of the solvent, the temperature of viscosity determination and the type of polymer.21 According to the Mark–Houwink equation, the higher the molecular weight (M) of a given polymer, the greater the intrinsic viscosity ([η]) produced by a given weight concentration of polymer. That is, [η] increases with M. Therefore, the molecular weight of different polymers can be compared by the relative viscosity.


