DOI:
10.1039/C4RA02958E
(Paper)
RSC Adv., 2014,
4, 27946-27954
Effect of solution pH on the performance of three electrolytic advanced oxidation processes for the treatment of textile wastewater and sludge characteristics†
Received
3rd April 2014
, Accepted 21st May 2014
First published on 27th June 2014
Abstract
Comparative removal of COD and color from real textile wastewater using three different electrolytic advanced oxidation processes, namely, electro-Fenton (EF), peroxicoagulation (PC) and pH-regulated peroxicoagulation (PC-pH) processes were analyzed in the present study. Graphite plates were used as both electrodes in the EF process, while an iron plate replaced the graphite anode in the PC and PC-pH processes; moreover, the effect of voltage and solution pH on the performance of these processes was compared. Sludge production was observed in peroxicoagulation processes, indicating that the removal of pollutants took place by both degradation and electrocoagulation processes. The sludge production increased with an increase in solution pH, indicating that the electrocoagulation process dominates the degradation process at higher pH. A reduction of 97% in color was observed in the EF and PC-pH processes, while in the PC process was 82% after 60 min of electrolysis. At the same time, 64%, 70% and 75% of COD was removed by the EF, PC-pH and PC processes, respectively. Moreover, 47.7% of organic pollutant was mineralized via the EF process, and the sludge produced was characterized using the SEM, XRD and FTIR techniques. Furthermore, the sludge produced from the peroxicoagulation process was used as a heterogeneous EF catalyst for the degradation of textile wastewater, and removal of 97% of color, 47% of COD and 33.2% of TOC was observed.
Introduction
Textile industries have played a major role in the Indian economy from the olden days. Tiruppur, a city in Tamil Nadu, emerged as a leading cotton knitwear industrial cluster in south India both for the overseas market and the domestic market, primarily because the climatic conditions facilitate the easy processing of yarn.1 On the other hand, the textile industries cause severe pollution to the Noyyal river and thousands of people are affected due to this pollution, because the textile dyeing processes employ a variety of chemicals such as enzymes, detergents, dyes, acids, sodas and salts.2 The highest rate of soil pollution occurred due to the supply of polluted water from the Noyyal river. The fertility of the land was reduced due to irrigation with this polluted water and the land became unsuitable for cultivation. Therefore, the government has issued orders to treat this textile wastewater before discharging into water bodies, especially into the Noyyal river.
Considering both the volume generated and the effluent composition, the textile industry wastewater is rated as the most polluting amongst all industrial sectors.3 Dyes are the most toxic and hazardous compounds in textile wastewater.2 Most of the dyes used in textile industries are synthetic and usually contain aromatic rings that make them harmful and biologically antagonistic compounds.4 This makes the treatment of textile wastewater a great environmental challenge.
Electrolytic advanced oxidation processes (EAOPs), especially electro-Fenton (EF)-related processes, have received great attention during recent years, due to their simplicity in operation and higher pollutant degradation efficiency. After the great invention of Fenton in 1894, the Fenton process was established as a principal example among all the advanced oxidation processes. Over 2500 scientific articles on the Fenton process have been published since 1945.5 This process included the production of hydroxyl radicals (which have the highest oxidizing capacity next to fluorine) by the reaction between ferrous ions and hydrogen peroxide as in eqn (1).6 Hydroxyl radicals have the ability to non-selectively react with most persistent organics to yield dehydrogenated or hydroxylated derivatives until total mineralization is reached.7 However, handling of hydrogen peroxide, low regeneration of ferrous ions from ferric ions, and requirement for higher ferrous ion concentrations, are some of the drawbacks of the Fenton process.8–10 The EF process nullifies these drawbacks of the Fenton process by electro-generation of ferrous ions at the cathode as in eqn (2),11 in situ generation of hydrogen peroxide at the cathode in the presence of dissolved oxygen as in eqn (3),12 and smaller amounts of Fe ions required for the degradation of pollutants than in the Fenton process.9
| | |
Fe2+ + H2O2 → Fe3+ + OH− + HO˙
| (1) |
| | |
O2 + 2H+ + 2e− → H2O2
| (3) |
The EF process was first reported by Brillas group and Oturan group.12–14 Based on these results, various researchers worked on the EF process and now this process has become a popular electrolytic process among various advanced processes.6–14 During the last decade, other forms of EF process such as peroxicoagulation and the Fered-Fenton process have also received great attention. In the peroxicoagulation (PC) process, a sacrificial anode produces Fe ions as in eqn (4), instead of external addition of iron salts in the EF process. These ferrous ions generated from the anode undergo Fenton reactions as in the EF process. The PC process is a combination of the EF process and the electrocoagulation process, because enhancement of solution pH and coagulation of pollutant occurs in the PC process with an increase in electrolysis time and is mainly due to an increase in ferrous ion concentration with electrolysis time.15 The electrocoagulation of a pollutant can be controlled by regulating the pH at regular intervals and this is known as a pH-regulated peroxicoagulation (PC-pH) process.
Therefore, the present study focused on color and COD removal from real textile wastewater using EAOPs. Comparison of the color and COD removal efficiencies of EF, PC and PC-pH was carried out. Ferric ion was selected as a suitable Fenton catalyst for the treatment of textile wastewater using the EF process, because, in our previous study,16 we demonstrated that ferric ion has the maximum dye removal efficiency at low concentrations among EF and EF-like reagents. The performance of these processes at various solution pH values was analyzed. The effect of catalyst concentration on the EF process and the effect of applied voltage on all the processes were also examined.
Experimental
Materials
High-purity ferric chloride supplied by Merck was used as a source of ferric ions throughout the experiments. H2SO4 obtained from Merck was used for reducing the pH of textile wastewater. Graphite plate was supplied by Anabond Sainergy Fuel Cell India Private Limited, Chennai, Tamil Nadu, India. Iron plate used as the anode in the PC and PC-pH processes was obtained from the local market.
Textile wastewater
Textile wastewater was collected in 10 L plastic containers from a textile industry situated in Karur, close to Tiruppur, and stored in a laboratory freezer. The color of the textile wastewater was monitored at 516 nm using a UV-vis spectrophotometer (Lambda 25, PerkinElmer, USA). pH of the solution, conductivity and TDS of the textile wastewater were analyzed using a Eutech PC 510 model (Singapore) bench top pH/EC/TDS/temperature apparatus. COD and BOD analysis of the textile wastewater was carried out as per standard methods.17 Total organic carbon (TOC) reduction for the samples was monitored using a multi N/C 3100 TOC analyzer (Analytik Jena, Germany). The characteristics of raw textile wastewater are listed in Table 1.
Table 1 Characteristics of textile wastewater
| Properties |
Values |
| pH |
11.76 |
| Conductivity |
6.4 mS |
| TDS |
3.19 ppt |
| BOD |
220 mg L−1 |
| COD |
1555 mg L−1 |
| BOD/COD |
0.14 |
| TOC |
721.1 mg L−1 |
Electro-Fenton experiments
Electrolysis of the textile wastewater was carried out in a 750 mL glass beaker and a working volume of 500 mL was selected for all the experiments. Graphite plates with an effective area of 25 cm2 were employed as both anode and cathode. Both electrodes were placed vertically and parallel to each other at a 3 cm inter-electrode spacing. The pH of the solution of textile wastewater was reduced to the required level using 1 N H2SO4 solution. Air was purged into the solution near the cathode using a commercially available fish aerator. This ensured the production of hydrogen peroxide at the cathode due to enrichment of oxygen in the acidic solution. The required amount of ferric chloride was added to the acidified textile wastewater and a constant DC power supply was ensured using a digital DC power supply (make: Beetech, 0–5 A and 0–30 V). Samples were withdrawn at regular intervals and residual color and COD were monitored. Color removal efficiencies of all the electrolytic methods were expressed as percentages. Reduction in COD was expressed as the ratio of residual COD at a time “t” (Ct) to initial COD (C0).
Peroxicoagulation experiments
The electrolytic cell used in the EF process was used for peroxicoagulation experiments. Instead of a graphite anode in the EF process, an iron plate of the same area was used and the clear spacing between anode and cathode kept constant at 3 cm. The initial pH of the solution was maintained at the desired level using the 1 N H2SO4 solution. Bubbling of air near the cathode was ensured using the aerator and a constant voltage was applied across the electrodes using a digital DC power supply. Samples were withdrawn at equal intervals and monitored for pH and COD. After the electrolysis, the solution was kept standing for 30 min to settle the sludge produced during electrolysis, and the supernatant was analyzed for residual color of the solution. In the PC-pH process, the pH of the solution was regulated to its initial pH at regular intervals using sulphuric acid solution.
Characterization of sludge
Sludge produced from the peroxicoagulation process at various pH values was analyzed using Fourier transform infrared (FTIR) and X-ray diffraction (XRD) analysis. An FTIR spectroscope (FTIR-2000, Perkin Elmer) using the KBr pellet method was used for recording the spectra in the range of 4000 to 550 cm−1. The XRD spectrum of sludge was obtained using a Rigaku X-ray diffractometer (D-Max/Ultima III). The sludge was exposed to X-rays with the 2θ angle varying between 0° to 80° with Cu Kα radiation at an applied voltage and current of 40 kV and 30 mA, respectively. Scanning electron microscopy (SEM) investigations of the samples were conducted in a JEOL JMT-300 operated at 15 kV.
Results and discussion
Effect of ferric ion dosage in the EF process
The ratio of Fe concentration to hydrogen peroxide concentration affects the Fenton system significantly. If the ratio is very high, both the reactants are consumed within minutes and the organic compound concentration only affects the behaviour of the concentration of ferrous ion.18 However, in the case of lower ratios, hydroxyl radicals produced in the system react with excess H2O2 and form hydroperoxyl radicals.18 Therefore, in this case, the degradation of organic pollutants occurs mainly due to hydroperoxyl radicals. In the case of EF-related processes, the concentration of H2O2 is constant at constant electrolytic conditions. Therefore, the concentration of Fe ion is an important factor affecting the rate of Fenton chain reactions, especially in the EF process.
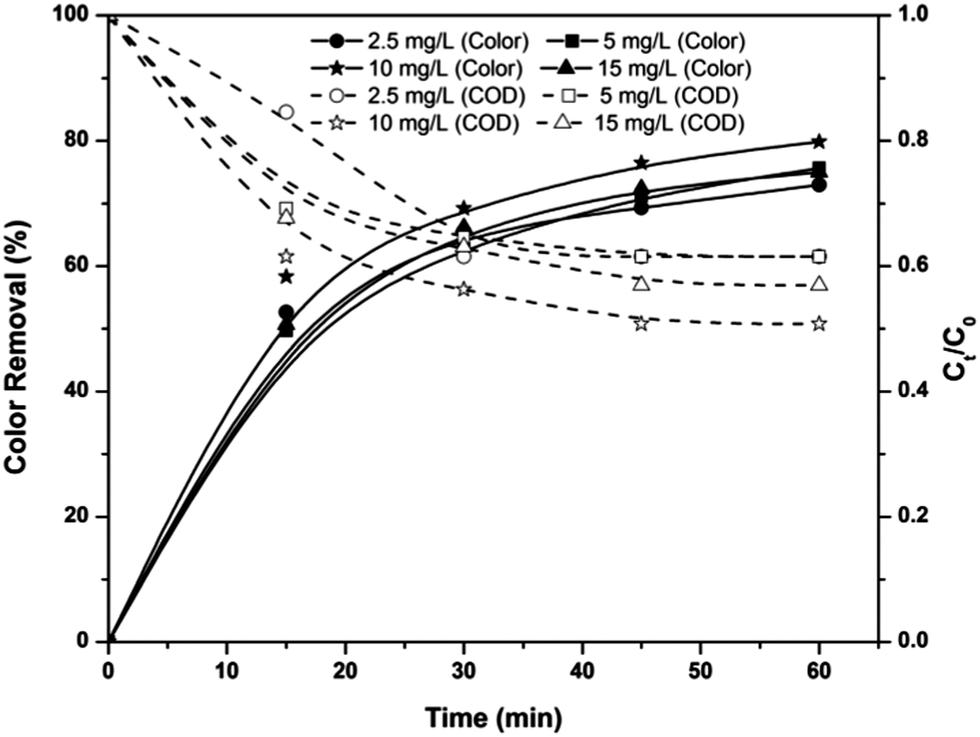
Fig. 1 shows the effect of ferric ion concentration on COD and color removal from textile wastewater. COD and color reduction from the textile wastewater in acidic conditions increased with an increase in ferric ion concentration from 2.5 to 10 mg L−1. With an increase in ferric ion concentration from 2.5 to 10 mg L−1, color removal increased from 72% to 80% and COD reduction was increased from 39% to 50% after 60 min of electrolysis. This is mainly due to the increase in the in situ hydroxyl radical generation rate. However, a further increase in ferric ion concentration from 10 mg L−1 decreased the efficiency of the EF system. This reduction in the efficiency of the electrolytic system is mainly due to the reaction between excess ferrous ions and hydroxyl radicals as in eqn (5).19 Moreover, the reaction (eqn (6)) that occurs between ferric ions and hydrogen peroxide also retards the efficiency of the EF system at higher Fe ion dosages.20 Therefore, 10 mg L−1 was considered as the optimal ferric ion concentration in the EF process and selected for further experiments.
| | |
Fe2+ + HO˙ → Fe3+ + HO−
| (5) |
| | |
Fe3+ + H2O2 → FeO–OH2+ + H+ → HO2˙ + Fe2+ + H+
| (6) |
 |
| | Fig. 1 Effect of ferric ion concentration on color and COD removal in the EF process at solution pH 3 and applied voltage of 3.5 V. | |
Effect of applied voltage
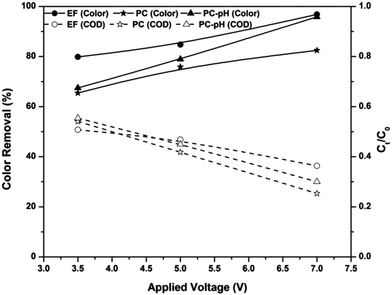
Applied voltage determines the efficiency of all electrolytic systems. Fig. 2 shows the effect of applied voltages on the color and COD removal efficiencies of the EF, PC and PC-pH processes at pH 3, after 60 min of electrolysis. Color and COD removal efficiencies of the EF process increased with an increase in applied voltage. With the increase in applied voltage from 3.5 to 7 V, color and COD removal efficiencies were increased by 17% and 14%, respectively. This increase in efficiency is mainly due to the increase in hydrogen peroxide concentration at the cathode surface with an increase in applied voltage.21 Moreover, the regeneration rate of ferrous ions from ferric ions increased with an increase in applied voltages, leading to an increase in the rate of Fenton chain reactions.
 |
| | Fig. 2 Effect of applied voltage on COD and color removal efficiencies of the EF, PC and PC-pH processes at pH 3, ferric ion dosage of 10 mg L−1, electrode area of 25 cm2. | |
In the case of the PC and PC-pH processes, the same trends of an increase in efficiency with an increase in applied voltage were noticed. Color removal efficiencies of PC at 3.5 and 7 V were observed as 62% and 85%, respectively. At the same time, color removal efficiencies of the PC-pH process were observed as 67% and 95%, respectively, for applied voltages of 3.5 and 7 V. With an increase in voltage from 3.5 to 7 V, the COD removal efficiencies of the PC and PC-pH processes were increased to 29 and 25%, respectively. With the increase in applied voltage, the amount of Fe ions entering from the anode also increases. For example, in the case of the PC process, 0.27 and 0.74 g of iron were dissolved in the acidic medium with an increase in voltage from 3.5 to 7 V. This enhances the Fenton reactions, resulting in higher removal efficiency. However, the dissolution rate of iron is higher for the PC process than that of the PC-pH process; moreover, the dissolution of iron species from the anode in the PC process follows a linear relation with applied voltage at 0.1 g V−1 constant rate with a correlation coefficient of 0.93. At the same time, the dissolution rate and coefficient of correlation for the PC-pH process were observed as 0.09 g V−1 and 0.9, respectively. However, the dissolution of Fe ions was very high and caused an increase in solution pH with electrolysis time. This increase in pH was also increased with an increase in applied voltage. Due to this increment in pH, coagulation occurred during the electrolysis and sludge was developed in the electrolytic medium. With the increase in applied voltage from 3.5 to 7 V, the sludge volume increased from 29 to 140 mL in the PC process.
The COD removal efficiency of the EF process was higher than that of the PC and PC-pH processes at 3.5 V. At this voltage, the coagulation occurring in the textile wastewater was much less. However, at a higher applied voltage the COD removal efficiency of the PC process was higher, and this is mainly due to the coagulation process. In contrast, at an applied voltage of 7 V, the color removal efficiencies of the three processes follow the order of EF > PC-pH > PC. The lower color removal efficiency of the PC process is mainly due to the additional color generated in the system by the excess amount of iron species generated from the anode.
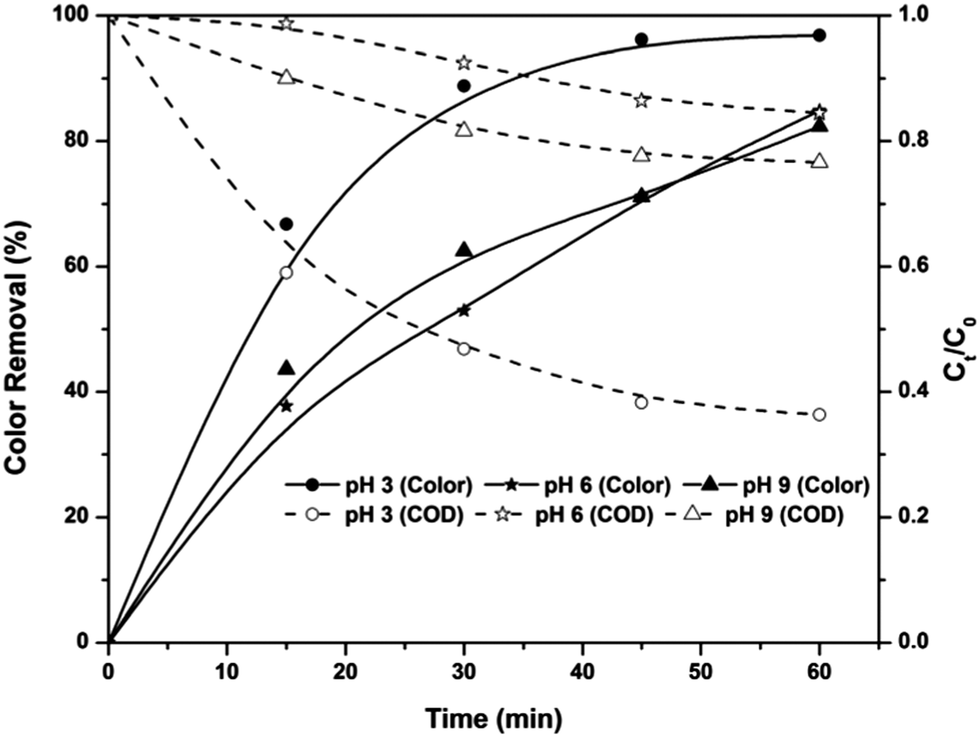
Effect of solution pH in the EF process
The EF process is known as a highly pH-dependent process and this is mainly due to the change in the in situ production rate of hydroxyl radicals. Fig. 3 shows the pH-dependent color and COD removal behavior of the EF process. It can be seen from the figure that EF is highly pH-dependent and the maximum color and COD removal were obtained at pH 3: 97% of color and 64% of COD were removed from the textile wastewater at pH 3. Speciation of iron at various pH values is the main factor affecting the formation of hydroxyl radicals at these pH values. At pH 3, the ferric ion added to the solution exists predominantly as Fe(H2O)63+.5 Because of the absence of complexing ligands, Fe ions exist as hexa-coordinated complexes22 and this hexa–aqua ferric ion complex undergoes further hydrolysis as in eqn (7) and (8).18 For simplicity, these complexes are considered as Fe3+ and, in the presence of a DC supply, this ion is attracted towards the cathode and reduced to Fe2+.| | |
[Fe(H2O)6]3+ + H2O → [Fe(H2O)5OH]2+ + H3O+
| (7) |
| | |
[Fe(H2O)5OH]2+ + H2O → [Fe(H2O)4(OH)2]+ + H3O+
| (8) |
 |
| | Fig. 3 Effect of solution pH on color and COD removal kinetics of the EF process at an applied voltage of 7 V and ferric ion concentration of 10 mg L−1. | |
The ferrous ions also exist as a hexa–aqua complex and undergo hydrolysis as explained earlier. As a result, complexes of ferrous ions like Fe(H2O)62+, Fe(H2O)5(OH)+ and Fe(H2O)4(OH)2 are formed in the solution, and they are referred to as Fe2+, FeOH+ and Fe(OH)2, respectively.5,22 Among these species, Fe2+ is the predominant form of ferrous ion at solution pH < 3.23,24 Therefore, a higher amount of Fenton reactions occur at pH 3 and result in higher color and COD removal efficiencies.
With an increase in the pH from 3, the above ferric complexes become [Fe2(H2O)8(OH)2]4+, [Fe2(H2O)7(OH)3]3+ and [Fe2(H2O)7(OH)4]2+.18 These complexes are almost completely insoluble25 and cause coagulation of organic pollutants rather than production of hydroxyl radicals in the electrolytic system. Oxidation of ferrous ions to ferric ions in the presence of oxygen supplied with the system also retards the efficiency of the EF system at pH > 3. At pH > 4, oxidation of ferrous ions occurs as in eqn (9),5,22 which reduces the total amount of ferrous ions required for the Fenton reactions. At solution pH 9, ferric ions are in the forms of Fe(OH)3 precipitate and Fe(OH)4− complex. Moreover, hydrogen peroxide is also unstable in basic solutions, and it may decompose to give oxygen and water and lose its oxidation ability.26 Therefore, the amounts of reagents required for the in situ production of hydroxyl radicals are insignificant and cause lower removal efficiency at solution pH 9.
| | |
Fe2+ + O2 → Fe3+ + O2˙−
| (9) |
In the cases of pH 6 and 9, the COD removal efficiency of the EF process is very much less than the color removal efficiency. Although 85% of color was removed from the system, the COD removal was observed to be 15%. This indicates that the COD caused by textile wastewater is mainly due to the organic compounds other than dyes.
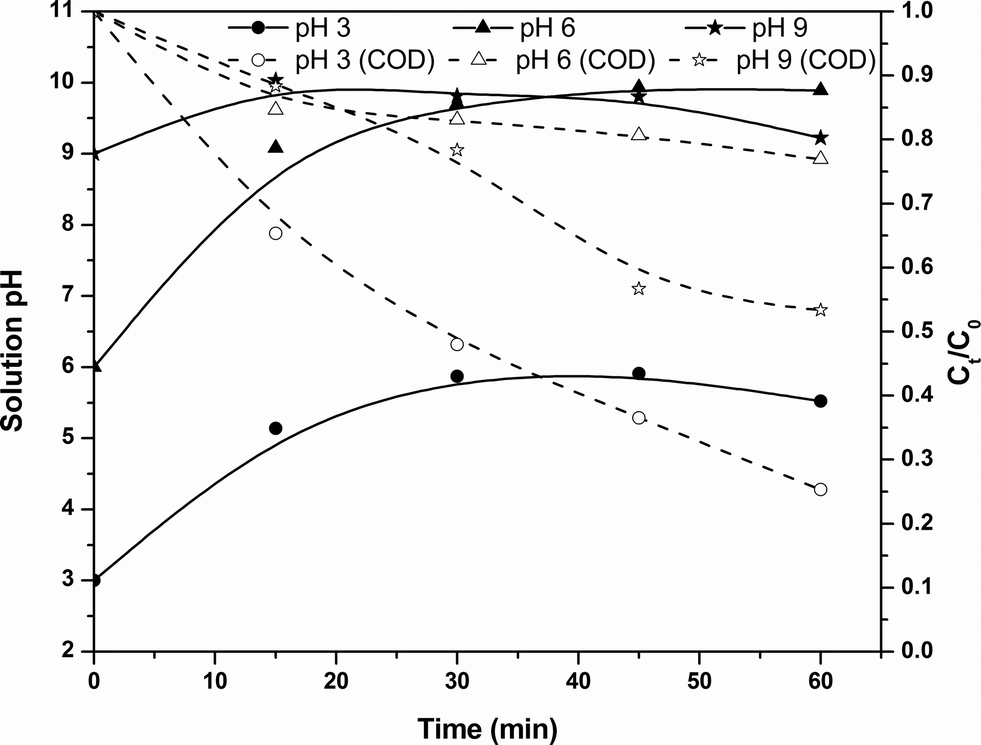
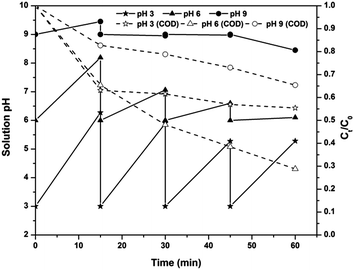
Effect of solution pH on the PC-pH process
The effect of solution pH on the COD removal kinetics of the PC-pH process, along with the change in solution pH, is shown in Fig. 4. Experimental results indicated an increase and decrease in solution pH from 6 decreased the efficiency of the electrolytic system. However, in the initial stages of the PC-pH process at pH 3, the COD removal rate was higher than that at pH 6. Moreover, the rate of COD removal was slightly less than that of the EF process for up to 15 min of electrolysis. This indicates that for up to 15 min of electrolysis, removal of COD is mainly due to degradation, but an insignificant change in COD was observed with a further increase in electrolysis time. As the time elapses, the concentration of Fe ions coming into the solution increases. At this stage, most of the Fe species are in Fe3+ or Fe2+ form as the pH of the solution is maintained at 3. This excess Fe2+ causes a scavenging effect on the production of hydroxyl radicals as in eqn (5) (ref. 27) and decreases the COD removal efficiency. At pH 9, most of the Fe ions are in the forms of Fe(OH)4− complex and Fe(OH)3 precipitate, as indicated earlier. At this stage, the removal of COD is mainly due to Fe(OH)3 precipitate rather than Fe(OH)4− complex. Moreover, the COD-causing compounds may be negatively charged species because, except for pH 9, in all the cases the COD removal efficiency is very high. All the forms of Fe ions are positively charged at pH less than 9. This will cause repulsion between Fe(OH)4− complex and COD-causing compound, results in lower removal efficiency.
 |
| | Fig. 4 Effect of solution pH on residual pH changes and COD removal kinetics of the PC-pH process at an applied voltage of 7 V. | |
The change in solution pH after each 15 minutes of electrolysis was also monitored (Fig. 4). An increase in solution pH was observed in all the cases, and the pH reduced to the required value using H2SO4. This increase in pH is mainly due to the increase in hydroxyl ion concentration by water reduction at the cathode surface as in eqn (10).28 The rate of increase in pH was higher at lower pH and this rate decreased with an increase in solution pH.
| | |
2H2O + 2e− ⇔ H2 + 2OH−
| (10) |
Color removal of the PC-pH process was examined after 60 min of electrolysis and 30 min of sludge settling. Higher color removal was observed at pH 3 (95%) than at pH 6 (88%) and pH 9 (90%).
Effect of solution pH in the PC process
The solution pH dependence of the PC process for the COD removal kinetics is shown in Fig. 5. An increase in pH during the electrolysis was also observed. From the figure, it can be observed that the PC process has optimal COD removal efficiency at pH 3. In the case of initial solution pH 3, both degradation and coagulation of pollutants occur due to the increase in pH from 3. After the electrolysis, the solution pH increased to 6 and at these stages the solution contains more positively charged iron complexes, resulting in coagulation of organic pollutants. Moreover, in situ produced hydrogen peroxide is in a stable form, since the solution pH is acidic. This causes degradation of contaminants at the initial stages. In the case of pH 6, the solution pH increased with electrolysis time and reached 9.8 after the electrolysis. This results in a lower COD removal efficiency of the PC process due to Fe(OH)4− complex formation. In the case of initial pH 9, the solution pH increased to 10 within 15 min of electrolysis and resulted in the lowest COD removal efficiency, but a further increase in electrolysis time caused a decrease in pH to 9.2. This decrease in pH is mainly attributed to the oxidation of hydroxide ions at the anode.29 This decrease in pH causes an increase in the concentration of Fe(OH)3 and a decrease in the concentration of Fe(OH)4− complex, resulting in an increase in COD removal at the later stages of electrolysis. Reduction in color after the electrolysis and 30 min of sludge settling was monitored and a maximum of 85% color removal was observed at an initial pH 3.
 |
| | Fig. 5 Effect of pH of the solution on residual pH changes and COD removal kinetics of the PC process at an applied voltage of 7 V. | |
Spectral changes of textile wastewater during the EF process
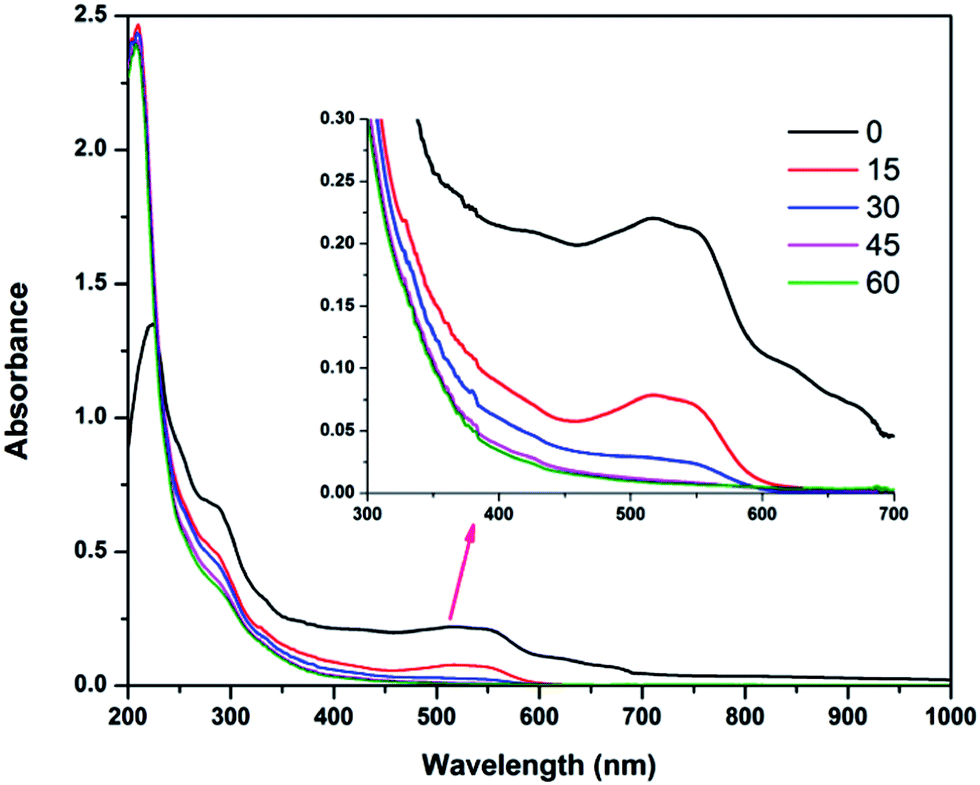
Changes in the UV-visible spectra of the electrolyzed textile wastewater at pH 3 in the EF process are shown in Fig. 6. From the figure, it can be observed that the peak at 516 nm decreased suddenly with increasing electrolysis time, especially after 15 min of electrolysis. This indicates rapid color removal at the initial stages of electrolysis. This color removal rate decreased with electrolysis time, mainly due to passivation of the electrodes. In a similar way, the peaks observed at 290 nm also decreased with electrolysis time, but the peak at 210 nm increased rapidly within 15 min of electrolysis and reduced slightly with further electrolysis. The first rapid increase in the peak represents by-product formation in Fenton oxidation and the decrease in the peak represents the oxidation of these by-products.
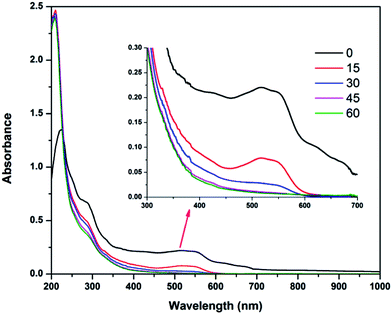 |
| | Fig. 6 Changes in UV-visible spectra of textile wastewater at applied voltage of 7 V, pH 3 and ferric ion concentration of 10 mg L−1. | |
Mineralization study
The absence of sludge production in the EF process shows that the removal of COD and color from textile wastewater is mainly due to the mineralization of organic contaminants. In the case of the PC and PC-pH processes, separation and mineralization processes control the removal of color and COD. Therefore, the amount of mineralization was quantified by analyzing the TOC removal in the electrolyzed samples of the EF process. The TOC removal efficiency of the EF process increased with an increase in applied voltage, as expected earlier. For example, with an increase in applied voltage from 5 V to 7 V, the TOC values of the 60 min electrolyzed samples were found to be 471.5 (34.6% TOC removal) and 376.6 mg L−1 (47.7% TOC removal), respectively. Similarly, the TOC values of 60 min electrolyzed samples increased from 376.6 mg L−1 at pH 3 to 549.8 mg L−1 (23.7% TOC removal) at pH 6. This indicates that the degradation of organic contaminants occurs more effectively at pH 3 than at pH 6; however, a further increase in solution pH from 6 to 9 increased the mineralization capacity of the EF process. Moreover, the TOC value of 60 min electrolyzed samples was found to be 499.9 mg L−1 (30.6% TOC removal). TOC in textile wastewater is mainly produced by the dyes and contaminants producing COD. At pH 9, the color removal was the same as that at pH 6, but the COD removal was slightly higher than that at pH 6. This increase in TOC removal at pH 9 is mainly due to the degradation or removal of COD-producing compounds. Overall, TOC removal was highest at pH 3, indicating that mineralization of pollutants occurs at the optimal rate at this pH.
Characterization of sludge
Production of sludge was observed in both PC and PC-pH processes and was not observed in the EF process even at alkaline pH, due to lower Fe concentration. The sludge production increased with an increase in solution pH from 3 to 6, and then remained constant. In all the pH ranges, the sludge production in the PC process was higher than that in the PC-pH process. With an increase in solution pH from 3 to 6, the sludge concentration was increased from 67 mL to 90 mL in the PC-pH process, whereas it was increased from 140 to 160 mL in the PC process.
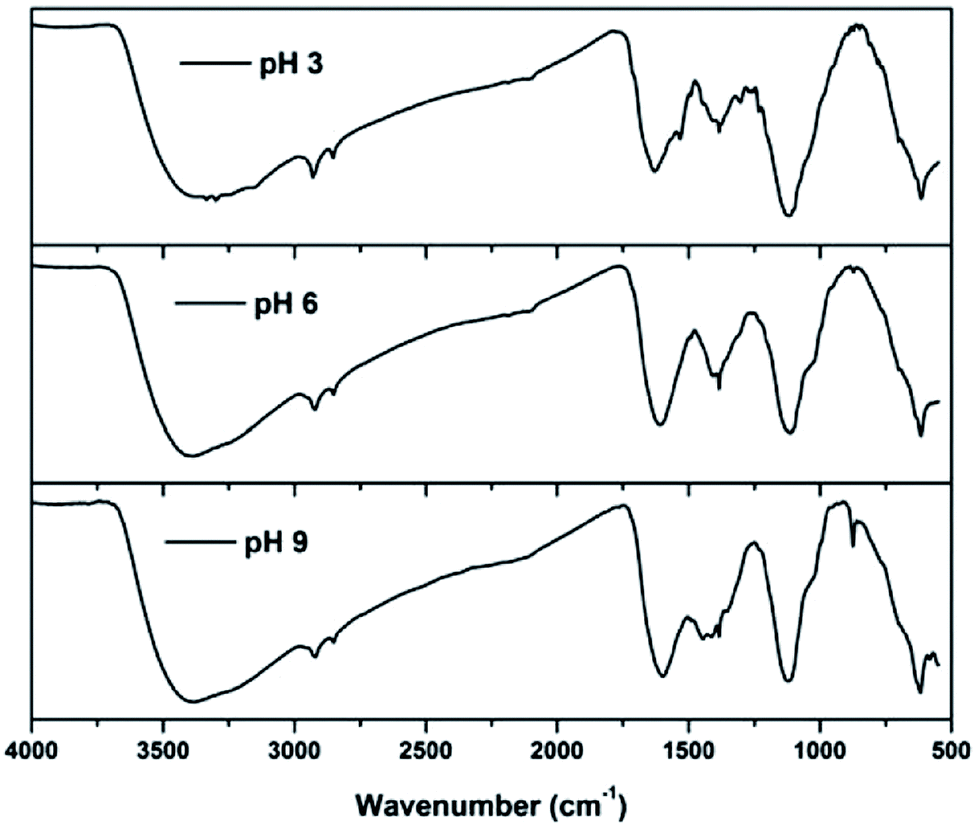
FTIR spectra of sludge produced at various pH values are shown in Fig. 7. The spectra showed peaks at 3386, 2921, 2853, 1608, 1384, 1113 and 615 cm−1 in all the pH ranges. The broad band near 3386 cm−1 could be attributed to the stretching vibration of O–H bonds.30 From the figure, it can be observed that the hydroxyl concentration at pH 3 and 9 is higher than that at pH 6, because in the acidic range the solution contains a higher amount of Fe(OH)2+, indicating that the sludge produced has twice the amount of hydroxide ions than iron ions. This is the same for the sludge produced at pH 9; however, the sludge produced at pH 6 contains equal amounts of iron and hydroxyl ions, indicating the lower OH concentration than that at pH 3 and 9. Asymmetric and symmetric C–H stretching vibrations of methylene groups were observed at 2921 and 2853 cm−1, respectively.31 The peak at 1608 cm−1 indicates the C![[double bond, length as m-dash]](https://www.rsc.org/images/entities/char_e001.gif) C stretching vibrations of aromatic compounds.32 This may also be due to CO stretching of the aromatic compounds.33 An N–O stretching vibration of nitrate was observed at 1384 cm−1.34 The strong band produced around 1113 cm−1 can be attributed to C–O–C vibrations35 and bands at 615 cm−1 are related to vibrations of the Fe–O bonds in iron oxide.30 This is mainly due to the formation of iron oxides produced during the dewatering process. In addition to this, peaks at 1446 and 875 cm−1 were also observed for sludge produced at pH 9 and are due to the C–H deformation mode of methylene groups and the C–O out-of-plane vibration due to carbonate.36,37 Investigations proved that the carbonates are precipitated only above solution pH 8;38 thus, they are observed in sludge produced at pH 9.
C stretching vibrations of aromatic compounds.32 This may also be due to CO stretching of the aromatic compounds.33 An N–O stretching vibration of nitrate was observed at 1384 cm−1.34 The strong band produced around 1113 cm−1 can be attributed to C–O–C vibrations35 and bands at 615 cm−1 are related to vibrations of the Fe–O bonds in iron oxide.30 This is mainly due to the formation of iron oxides produced during the dewatering process. In addition to this, peaks at 1446 and 875 cm−1 were also observed for sludge produced at pH 9 and are due to the C–H deformation mode of methylene groups and the C–O out-of-plane vibration due to carbonate.36,37 Investigations proved that the carbonates are precipitated only above solution pH 8;38 thus, they are observed in sludge produced at pH 9.
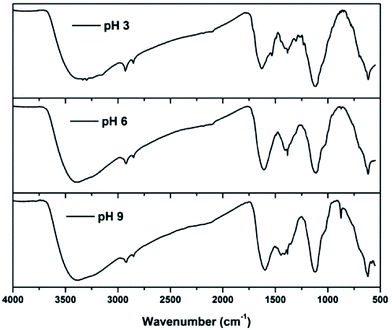 |
| | Fig. 7 FTIR spectra of sludge produced at various solution pHs. | |
The XRD patterns of the sludge produced at various pH values are shown in Fig. 8. Sludge produced at various pH values showed peaks commonly at 2θ = 18.96°, 27.34°, 31.84°, 45.4°, 56.36°, 66.56° and 75.22°, confirming the presence of NaCl in the sludge (JCPDS file no. 88-2300). The presence of sodium and chloride was also monitored from the EDS spectra of the sludge (Fig. S1†). The peaks observed at 27.34° are due to the presence of Fe(OH)3 and iron oxide hydroxide (JCPDS file no. 46-1436; 896096). In addition to this, two common peaks were observed at 29°, 33.8° and 35.52° for the sludge produced at pH 3 and 6. The peaks at 29° and 35.52° indicated the presence of FeCl2 (JCPDS file no. 89-3732). The presence of iron hydroxide oxide (JCPDS file no. 76-0182) was observed in the peaks at 33.8°, 35.52° and 56.36°. The peaks at 33.8° and 35.52° were also due to Fe2O3 (JCPDS file no. 89-8104). Moreover, sludge produced at pH 3 showed the presence of δ-FeOOH at 35.24°, 53.8° and 61.74° (JCPDS file no. 770247). An additional peak at 13.08° was observed for the sludge produced at pH 9, showing the presence of carbonate (JCPDS file no. 290305) as shown in FTIR study.
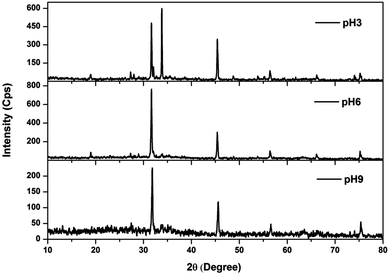 |
| | Fig. 8 XRD spectra of sludge produced at various solution pHs. | |
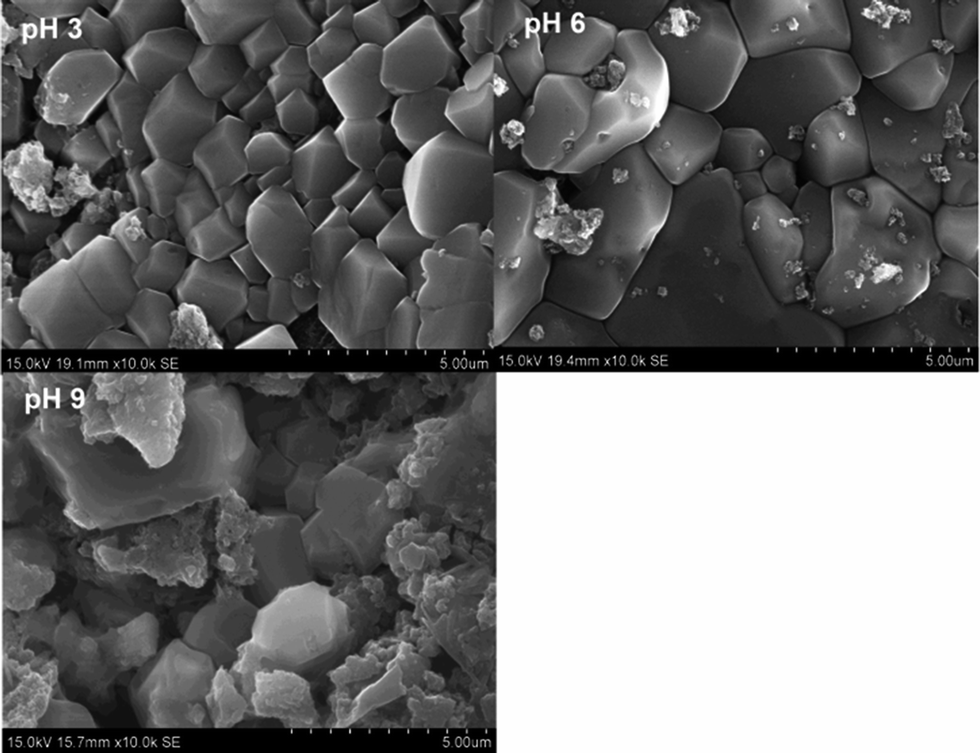
The SEM images of the sludge produced at various pH values are shown in Fig. 9. The sludge produced at pH 3 had different sizes and all the minerals were highly ordered. With the increase in pH from 3 to 6, the size of the material increased. However, the sludge produced at pH 9 showed a mixture of particles having various sizes. Most of the particles had irregular shapes and were arranged in an irregular manner.
 |
| | Fig. 9 SEM images of sludge produced at various solution pHs. | |
Reuse of sludge as a heterogeneous EF catalyst
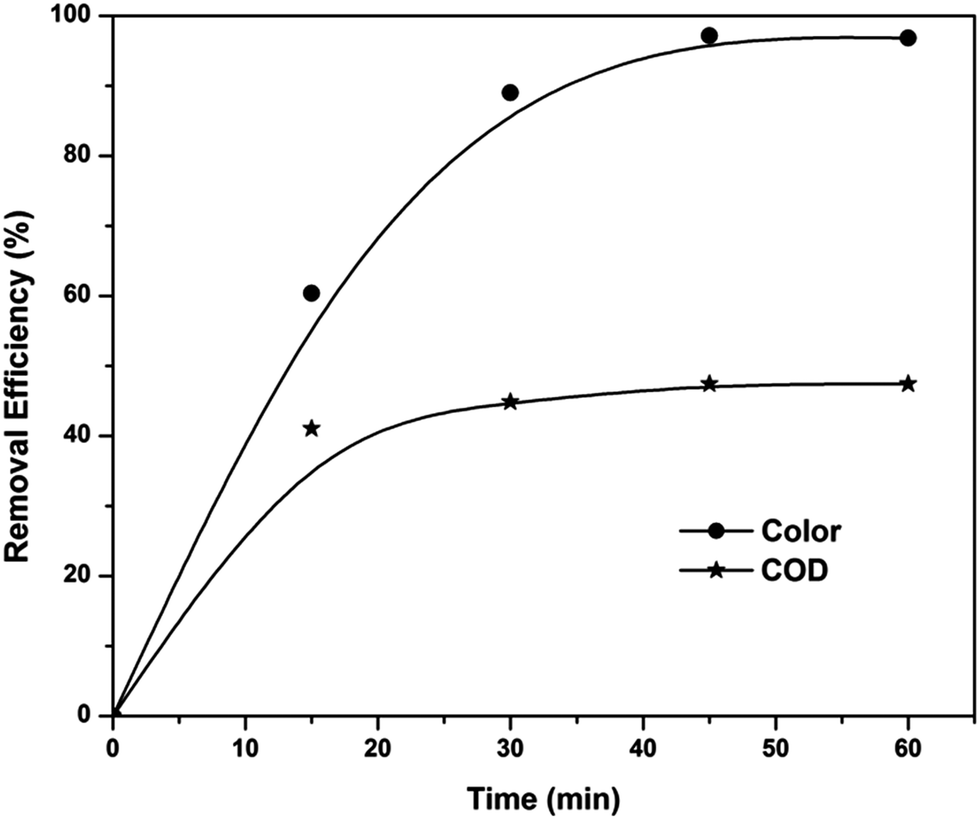
The sludge produced from the peroxicoagulation process was reused as a heterogeneous EF catalyst for the treatment of textile wastewater. Filtered and washed sludge was dried in an oven for 24 h at 100 °C. The suitability of sludge as a heterogeneous EF catalyst was tested at pH 3, applied voltage of 7 V and catalyst concentration of 10 mg L−1. The obtained results (Fig. 10) indicated that sludge produced from the peroxicoagulation process is also a good catalyst for the treatment of textile wastewater in acidic conditions. Color reduction of 97% and COD reduction of 47% were observed after 60 min of electrolysis. The color removal efficiency of the sludge is the same as that of ferric ions, but the COD removal efficiency of sludge was 17% less than that of ferric ions. The TOC value of a 60 min electrolyzed sample was also monitored and found to be 481.4 mg L−1 (33.2% TOC removal), which is also less than that of the homogeneous EF process.
 |
| | Fig. 10 Color and COD removal kinetics of the EF process in the presence of sludge as heterogeneous catalyst at pH 3 and applied voltage of 7 V. | |
Cost analysis
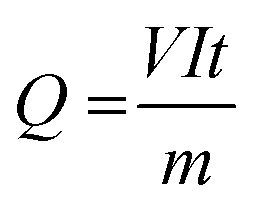
Based on the COD removal at the optimal conditions, the cost analysis of the three EAOPs was carried out, by considering the energy and material costs. The specific energy consumption (Q) was calculated using eqn (11).| |
 | (11) |
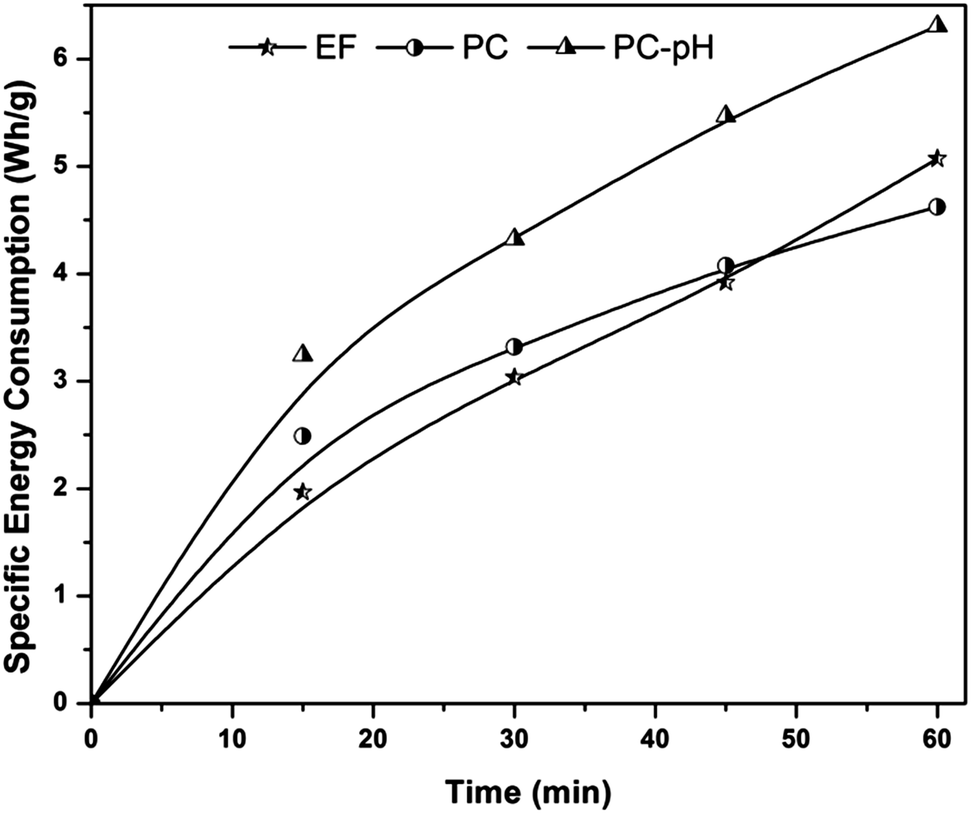
where V is the applied voltage (V), I is the current (A), t is the electrolysis time (h) and m is the change in COD during the electrolysis (g). The change in specific energy consumption as a function of electrolysis time for the three EAOPs is depicted in Fig. 11. Compared to the EF and PC processes, the energy required for the operation of the PC-pH process is very high. In all cases, the value of Q increased with an increase in electrolysis time. The operational cost for these EAOPs was calculated as per eqn (12) after 60 min of electrolysis and compared. In eqn (12), Q is the specific energy consumption, ‘a’ the cost of energy, E the consumption of electrodes, b the cost of the electrode, C the chemical consumption and ‘c’ the cost of chemicals. Costs of electrical energy, graphite plate, iron plate and ferric chloride were considered as 0.06 US$ per W h, 0.07 US$ per cm2, 1.58 US$ per kg and 0.008 US$ per g, respectively. The total operational cost required for the EF, PC and PC-pH processes was found to be 331.04 US$ per kg, 301.28 US$ per kg and 409.65 US$ per kg, respectively. The cost required for the PC-pH process is very high compared to the EF and PC processes. Although the cost of the EF process is a little higher than that of the PC process, the absence of sludge production in the EF process makes it a valuable tool for the treatment of textile wastewater.| | |
Operating cost = aQ + bE + cC
| (12) |
 |
| | Fig. 11 Specific energy consumption of three EAOPs at the optimal conditions. | |
Conclusions
Color and COD were effectively removed from real textile wastewater using the EF, PC and PC-pH processes. The efficiency of these EAOPs depends more on pH of the solution and applied voltage. Oxidation of pollutants is the main color and COD removal mechanism of the EF process, while that of the PC and PC-pH processes is a combination of both oxidation and separation processes. At higher pH values, the separation process dominated the oxidation process, resulting in higher sludge formation. Color removals of 97%, 97% and 82% were observed after 60 min of electrolysis for the EF, PC-pH and PC processes at optimal conditions. At the same conditions, 64%, 70% and 75% of COD were removed by the EF, PC-pH and PC processes, respectively. At the optimal conditions, 47.7% of organic pollutant was mineralized via the EF process. Recycling of sludge as a heterogeneous EF catalyst showed that 97% of color, 47% of COD and 33.2% TOC can be removed from textile wastewater.
References
- N. Jayanth sarathi, R. Karthik, S. Logesh, K. Srinivas Rao and K. Vijayanand, Environmental issues and its impacts associated with the textile processing units in Tiruppur, Tamilnadu, 2nd International Conference on Environmental Science and Development IPCBEE, IACSIT Press, Singapore, 2011, vol. 4 Search PubMed.
- H. P. Srivastava, G. Arthanareeswaran, N. Anantharaman and V. M. Starov, Desalination, 2011, 282, 87–94 CrossRef CAS PubMed.
- S. Sandhya, K. Sarayu and K. Swaminathan, Bioresour. Technol., 2008, 99, 5793–5797 CrossRef CAS PubMed.
- M. Panizza and M. A. Oturan, Electrochim. Acta, 2011, 56, 7084–7087 CrossRef CAS PubMed.
- J. J. Pignatello, E. Oliveros and A. Mackay, Crit. Rev. Environ. Sci. Technol., 2006, 36, 1–84 CrossRef CAS.
- M. A. Oturan, N. Oturan, C. Lahitte and S. Trevin, J. Electroanal. Chem., 2001, 507, 96–102 CrossRef CAS.
- N. Oturan, E. Brillas and M. A. Oturan, Environ. Chem. Lett., 2012, 10, 165–170 CrossRef CAS.
- E. Brillas, I. Sires and M. A. Oturan, Chem. Rev., 2009, 109, 6570–6631 CrossRef CAS PubMed.
- P. V. Nidheesh, R. Gandhimathi and S. T. Ramesh, Environ. Sci. Pollut. Res., 2013, 20, 2099–2132 CrossRef CAS PubMed.
- P. V. Nidheesh and R. Gandhimathi, Desalination, 2012, 299, 1–15 CrossRef CAS PubMed.
- S. Hammami, N. Oturan, N. Bellakhal, M. Dachraoui and M. A. Oturan, J. Electroanal. Chem., 2007, 610, 75–84 CrossRef CAS PubMed.
- M. A. Oturan, J. Peiroten, P. Chartrin and A. J. Acher, Environ. Sci. Technol., 2000, 34, 3474–3479 CrossRef CAS.
- M. A. Oturan, J. Appl. Electrochem., 2000, 30, 475–482 CrossRef CAS.
- E. Brillas, E. Mur and J. Casado, J. Electrochem. Soc., 1996, 143, L49–L53 CrossRef CAS PubMed.
- B. Boye, E. Brillas and M. M. Dieng, J. Electroanal. Chem., 2003, 540, 25–34 CrossRef CAS.
- P. V. Nidheesh and R. Gandhimathi, Clean: Soil, Air, Water, 2014, 42, 779–784 CrossRef CAS.
- APHA, Standard methods for the examination of water and wastewater, American Public Health Association, Washington, D.C., 17th edn, 1998 Search PubMed.
- E. Neyens and J. Baeyens, J. Hazard. Mater., 2003, B98, 33–50 CrossRef.
- B. Lodha and S. Chaudhari, J. Hazard. Mater., 2007, 148, 459–466 CrossRef CAS PubMed.
- A. Özcan, M. A. Oturan, N. Oturan and Y. Şahin, J. Hazard. Mater., 2009, 163, 1213–1220 CrossRef PubMed.
- A. Özcan, Y. Sahin, A. Savas Koparal and M. A. Oturan, J. Electroanal. Chem., 2008, 616, 71–78 CrossRef PubMed.
- I. Magario, F. S. García Einschlag, E. H. Rueda, J. Zygadlo and M. L. Ferreira, J. Mol. Catal. A: Chem., 2012, 352, 1–20 CrossRef CAS PubMed.
- C. F. Wells and M. A. Salam, Nature, 1965, 205, 690–692 CrossRef CAS.
- C. F. Wells and M. A. Salam, J. Chem. Soc. A, 1968, 24–29 RSC.
- U. Bali and B. Karagözoğlu, Dyes Pigm., 2007, 74, 73–80 CrossRef CAS PubMed.
- S. Wang, Dyes Pigm., 2008, 76, 714–720 CrossRef CAS PubMed.
- Y. W. Kang and K. Hwang, Water Res., 2000, 34, 2786–2790 CrossRef CAS.
- P. Drogui, M. Asselin, S. K. Brar, H. Benmoussa and J. F. Blais, Sep. Purif. Technol., 2008, 61, 301–310 CrossRef CAS PubMed.
- N. Daneshvar, H. Ashassi-Sorkhabi and A. Tizpar, Sep. Purif. Technol., 2003, 31, 153–162 CrossRef CAS.
- G. Absalan, M. Asadi, S. Kamran, L. Sheikhian and D. M. Goltz, J. Hazard. Mater., 2011, 192, 476–484 CrossRef CAS PubMed.
- J. Coates, Interpretation of Infrared Spectra, A Practical Approach, in Encyclopedia of Analytical Chemistry, ed. R. A. Meyers, JohnWiley & Sons Ltd, Chichester, 2000, pp. 10815–10837 Search PubMed.
- A. Ouatmane, M. R. Provengano, M. Hafidi and N. Senesi, Compost Sci. Util., 2000, 8, 124–134 CrossRef.
- J. Zhang, H. L. Zou, Q. Qing, Y. L. Yang, Q. W. Li, Z. F. Liu, X. Y. Guo and Z. L. Du, J. Phys. Chem. B, 2003, 107, 3712–3718 CrossRef CAS.
- E. Smidt, P. Lechner, M. Schwanninger, G. Haberhauer and M. H. Gerzabek, Appl. Spectrosc., 2002, 56, 1170–1175 CrossRef CAS.
- S. Dietrich, S. Chandra, C. Georgi, S. Thomas, D. Makarov, S. Schulze, M. Hietschold, M. Albrecht, D. Bahadur and H. Lang, Mater. Chem. Phys., 2012, 132, 292–299 CrossRef CAS PubMed.
- F. Bosch Reig, J. V. Gimeno Adelantado and M. C. M. Moya Moreno, Talanta, 2002, 58, 811–821 CrossRef.
- G. Devi, T. S. Renuga Devi and S. Gunasekaran, Int. J. Chem. Res., 2010, 1, 9–17 Search PubMed.
- J. A. Wojtowicz, J. Swimming Pool Spa Ind., 2001, 3, 18–23 Search PubMed.
Footnote |
| † Electronic supplementary information (ESI) available. See DOI: 10.1039/c4ra02958e |
|
| This journal is © The Royal Society of Chemistry 2014 |
Click here to see how this site uses Cookies. View our privacy policy here.