Bottom-up nanoarchitectonics of two-dimensional freestanding metal doped carbon nanosheet
Hicham Hamoudi*ab
aInternational Center for Young Scientists (ICYS), International Center for Materials Nanoarchitectonics (WPI-MANA), National Institute for Materials Science (NIMS), 1-1 Namiki, Tsukuba, 305-0044, Japan. E-mail: Hamoudi.hicham@nims.go.jp; Fax: +81-29-860-4706; Tel: +81-29-851-3354 ext. 8672
bInternational Center for Materials Nanoarchitectonics (WPI-MANA), National Institute for Materials Science (NIMS), 1-1 Namiki, Tsukuba, 305-0044, Japan
First published on 30th April 2014
Abstract
Through appropriate engineering of the 5,5′-bis(mercaptomethyl)-2,2′-bipyridine self-assembled monolayer (BPD-SAM) on a gold surface, ultrathin sulfur functionalized freestanding carbon–metal nanosheets (CMNS) have been produced. The BPD-SAM was used to encapsulate Ni+2. The resulting BPD–Ni+2 SAM was cross-linked by high-energy electrons. The nanomembrane was realized by dissolving the gold substrate. The chemical and physical properties of the CMNS were investigated using X-ray photoelectron spectroscopy (XPS), UV-vis reflection spectroscopy, atomic force microscopy (AFM), scanning electron microscopy (SEM), energy dispersive X-ray (EDX), and electrical two-point probe measurements.
Introduction
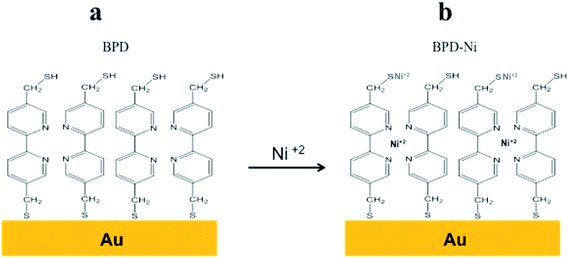
As early as 1930, Langmuir and Blodgett assembled molecules on a water surface to form membranes known as Langmuir–Blodgett films.1 Molecular monolayer self-assembly is an experimental approach to form highly ordered monolayers on various substrates.2–4 Self-assembled monolayers (SAMs) show similarities to the biological membranes, where the lipids self-organize via intramolecular interaction. SAMs containing aromatic groups show a high degree of order. They can be useful as building blocks to create new hybrid materials with novel functionalities out of the scope of traditional solid-state devices.5–8 It has been shown recently that modification of the aromatic SAMs on different solid surfaces by electron beams enables fabrication of carbon nanomembranes (CNM) through crosslinking of the aromatic SAM.9–13 Low-energy electron beams are necessary to create the crosslinked molecular network. Exposure of the conjugate SAMs to high-energy electron beams enables the fabrication of sheets of nanometer size, which also provides evidence that the aromatic self-assembled monolayer acts as a negative electron resist for high-energy electron beams.9 These carbon nanofilms are separable from their substrates and are transferred onto new holders.10 The CNM can be biofunctionalized with anchoring molecules, which enable their use for widely various biological applications. Moreover, CNM annealing has a strong impact on the electrical and electronic properties of these materials.11Engineering the band gap of the 2D materials such as graphene by metal doping is an important challenge confronting scientists. In the literature, no attempt has been made to dope carbon nanosheets with metals. Engineering the carbon nanosheets by adsorbates such as transition metal can modify the ground state and the magnetic properties of the nanosheets. A redox-active center such as (Ni) has been incorporated into the organic backbones to improve the charge-transfer processes. Different studies of molecular redox center immobilized on metallic substrate indicate them as good conductors.29 This report describes a simple method to build a new material regarded as sulfur functionalized freestanding carbon–metal nanosheet (CMNS), based on a crosslinked self-assembled monolayer SAM of (5,5′-bis(mercaptomethyl)-2,2′-bipyridine)–Ni+2 (BPD–Ni) as shown in Fig. 1. The BPD SAM was crosslinking by high-energy electron irradiation. Dissolving the Au underlying substrate releases the CMNS.
 | ||
| Fig. 1 Scheme of sequential reactions to prepare BPD–Ni monolayer. (a) Self-assembly monolayer (SAM) of the BPD on Au (111). (b) Proposed configuration of BPD–Ni SAM after Ni encapsulation. | ||
The membrane was characterized by various complementary techniques such as X-ray photoelectron spectroscopy, UV-vis reflection spectroscopy, atomic force microscopy, scanning electron microscopy, energy dispersive X-ray (EDX), and electrical two-point probe measurements.
The dithiols molecules provide an active interface to the nanosheet, and can be tailored to adsorb a various materials, such as metals. In biological applications this nanosheet can be used as biocompatible interfaces for surface immobilization of, e.g., cells and proteins.
Experimental section
5,5′-Bis(mercaptomethyl)-2,2′-bipyridine was purchased from Aldrich and used as received. The gold substrates were prepared by thermal evaporation of 150 nm of gold (99.99% purity) onto either polished single-crystal silicon (100) wafers primed with a 10 nm titanium adhesion layer or on freshly cleaved mica at 340 °C. The SAM of the 5,5′-bismercaptomethyl-2,2′-bipyridine (BPD) (Fig. 1) was prepared by immersing the gold support into a freshly prepared 1 mM solution of n-hexane for 1 h at about 60 °C. Solutions that had been well-degassed by Ar, and all preparation steps were performed in the absence of ambient light, following the same protocol as in our previous studies.14 Subsequently, the gold wafer, modified with a layer of BPD, was held for 3 h in contact with a concentrated aqueous solution of NiCl2.XPS spectroscopy measurements were conducted at the MANA Foundry using an XPS spectrometer (XPS version Alpha 110 mm Analyser; Thermo Fisher). The XPS spectra were recorded in the Au 4f, S 2p, C 1s, N 1s, and Ni 2p regions. The spectra acquisition was performed in normal emission geometry using Al Kα radiation. The binding energy (BE) scale of each spectrum was calibrated individually to the Au 4f7/2 emission at 83.95 eV.
The AFM topographical and phase images were collected using a SPM microscope (diMultimode; Veeco Instruments) in tapping mode. To measure the film thickness, the freely suspended membranes were placed on the silicon wafer. Its edge area was scanned. The morphology of the membranes was investigated with a scanning electron microscope (S-4300; Hitachi Ltd.) equipped with a W tip cold-FE electron emitter. The 3 × 3 mm square patterns were created using an electron beam lithography system (50 kV, 70 mC cm−2; Elionix Inc.). The morphology and the energy dispersive X-ray (EDX) analysis of CMNS were conducted at MANA using a transmission electron microscope (TEM, JEM-2100F; JEOL). The UV/Vis transmission mode was measured using a UV/Vis/NIR spectrophotometer (V-570; Jasco Corp.)
Results and discussion
S 2p XPS spectra of the BPD SAMs are presented in Fig. 2c. The fits of the S 2p BPD SAM (Fig. 2c) was performed setting a 1.2 eV 2p1/2,3/2 splitting and introducing two doublets: the first doublet was at 162 eV S1 commonly assigned to the thiolate species, this BE value corresponds to the thiolate species bonded to Au metal surfaces. The second doublet at about ∼163.7 eV S2 corresponding to sulfur of the free thiol (SH) groups or S–S bonds.14–19The N 1s XPS spectra of the BPD SAM are presented in Fig. 2b. A single symmetric peak at 399 eV is assigned to the nitrogen in the pyridine rings. The BPD film thickness calculated from the carbon to Au XPS signal ratio using the dodecanethiol (DDT) SAM as reference is ∼2 nm, which shows good agreement with the BPD molecule height.
The C 1s spectra of the BPD film and the reference dodecanthiol (DDT) SAM are displayed in Fig. 2a. The main peak at 285.5 eV is a superposition of the contribution from different carbons: the aliphatic moieties (CH2) and the meta, para C in the pyridine unit, and the ortho C in the rings bound directly to the nitrogen atoms.20
The exposure of the DBP SAM to NiCl2 produced a significant change in the N 1s and S 2p spectra. The S 2p spectra (Fig. 2c) show a clear change in the relative intensity of both components S1 and S2 after exposure to Ni, which is probably attributable to the partial formation of the Ni thiolate species at the SAM-ambient interface.21,22 Indeed, the intensity of the free S (S2 peak) at the SAM interface decreases in intensity with respect to the Au (/metal) bound S (S1 peak), indicating partial linkage to Ni.26 In addition, it is noteworthy that the dithiols SAMs are extremely sensitive to photo-oxidation.4,6 Solutions that are well-degassed by Ar and the absence of ambient light during the preparation steps can minimize oxidation. The peak at 168 eV was assigned to the partial formation of the sulfonate at the interface, which was probably produced during the cleaning and transfer of the samples. It should be noted that they have no Cl contaminant in the SAM.
In the case of N 1s spectra (Fig. 2b), The addition of Ni produces a splitting of the main peak, the first moiety (unaffected by Ni) at the same energy as N 1s of the BPD SAM, the second component towards a higher binding energy by 1.2 eV, which is a fingerprint of the binding of the bipyridine to the Ni+2 moiety.27,28
Fig. 2d shows the Ni 2p3/2 region. The peak at 856.6 eV is assigned to Ni+2. A diagram of the final SAM is shown in Fig. 1.
The exposure of the BPD–Ni SAM to electron beams engenders the formation of a crosslinked SAM, as described earlier. In Fig. 3a, the BPD–Ni/Au template was patterned using electrons (50 kV, 70 mC cm−2) and using a metal mesh as a mask. The patterned template was etched in an I2/KI-etch bath and rinsed with N,N-dimethylformamide DMF. As Fig. 3b shows, the optical microscope image shows that the underlying gold substrate within the irradiation areas was unaffected by the etching process. Fig. 4a shows similar behavior for the BPD–Ni/Au-mica template after patterning and I2/KI-etch treatment. This constitutes evidence that the crosslinked mechanism took place in the BPD–Ni SAM after radiation because the crosslinked SAM is more resistant to etching, although it was etched within the non-irradiated region.
 | ||
| Fig. 4 SEM images of Au patterns fabricated by proximity printing lithography with (a) square pattern of a monolayer of BPD–Ni and (b) BPD–Ni nanomembrane (after DMF ultrasonic treatment). | ||
Fig. 4b displays sheets of BPD–Ni/Au that were released from gold after I2/KI-etch and DMF ultrasonic treatment. This release occurs by the scission of the anchor group-substrate bonds using I2/KI and rinsing with N,N-dimethylfomamide DMF.13 Small flakes of the nanomembrane are also visible in Fig. 4a.
The CMNS are released by dissolution of the underlying substrate according to well-established protocols described in an earlier report.10 In brief, a 300 nm-thick PMMA was spin-coated onto a 3 × 3 mm square of the crosslinked film and baked at 180 °C for 3 min on a hotplate. The gold film was cleaved from the mica in hydrofluoric acid solution and etched away in an I2/KI bath. In the next step, the nanomembrane/PMMA was transferred onto a SiO2 substrate followed by dissolution of the PMMA in acetone to release a CMNS.
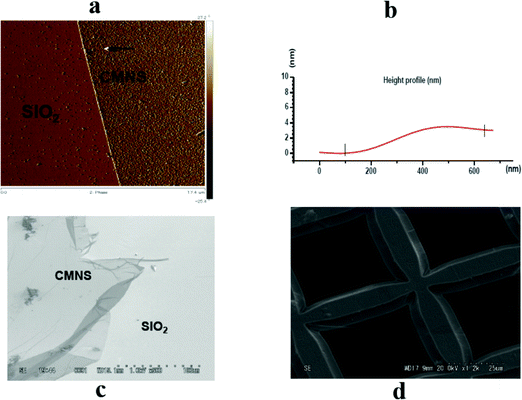
The morphologies of the fabricated nanosheet were initially investigated using scanning electron microscopy (SEM) and atomic force microscopy (AFM). Fig. 5 shows AFM and SEM images of the CMNS that has been transferred from gold onto a silicon wafer (Fig. 5a and c) and a TEM grid (Fig. 5d). The SEM image shows that the CMNS was flat, and folded at the edges. The nanosheet thickness determined by AFM (Fig. 5b) was about 2.9 nm for the BPD–Ni nanomembrane, which shows good agreement with the thickness obtained using XPS for the related SAM.
 | ||
| Fig. 5 AFM and SEM images of CMNS. The CMNS was prepared using electron radiation of structure b (see Fig. 1) and then detached by dissolving the gold substrate: (a) AFM image of the CMNS on SiO2; (b) AFM height profile of the CMNS on SiO2; (c) SEM image of the CMNS deposited on a SiO2 substrate; (d) SEM image of the CMNS deposited on a TEM grid. | ||
The chemical composition of the freestanding nanomembrane has been investigated using XPS, energy dispersive X-ray (EDX), and UV-vis spectroscopies. Fig. 6 shows the C 1s, N 1s, S 2p, and Ni 2p spectra of the CMNS deposited on SiO2 substrates. The S 2p XPS spectra of the BPD–Ni nanomembrane are shown in Fig. 6c. The high background in the S 2p spectrum hinder the analysis of the spectra, which is due to the influence of the Si (2s) peak located at region between 150 and 155 eV. The spectra of the former films exhibit two distinct features. The main broad and distinctly asymmetric peak at ∼164 eV for the BPD–Ni systems is a superposition of the contributions from the Ni–thiolate species and the disulfide (S–S) linkages or free thiol groups, whereas the second located at ∼168.00 eV is associated with the sulfur atom bonded to the oxygen. The C 1s XPS spectrum shows some amount of COOH in the membrane probably due to the etching process. No remarkable changes in the N 1s, and Ni 2p XPS spectra were compared to the BPD–Ni SAM before the irradiation. To investigate this further, elemental mapping of C, S, N, and Ni using energy dispersive X-ray (EDX) analysis (Fig. 7) was undertaken. The result shows a homogeneous distribution of S, N, and Ni on the nanosheet. In addition, it should be noted that 38 wt% of S and 11 wt% of Ni, were detected in the composite. This result, coupled with the XPS result, provides evidence for the presence of Ni on the nanosheet. However by analyzing the Ni/N XPS single ratio of both CMNS and the BPD–Ni SAM, the nanomembrane lose around 18% of Ni after the crosslinking and itching procedure. An important shortcoming is that the sheets are often damaged during peeling and transfer to other supports.
 | ||
| Fig. 6 XPS spectra of the CMNS: (a) C 1s, (b) N 1s, (c) S 2p, and (d) Ni 2p. The N 1s spectra have decomposed into individual contributions related to the different species; see the text for details. | ||
 | ||
| Fig. 7 Typical transmission electron microscopy (TEM) image, EDX spectrum of the CMNS, and corresponding elemental mapping images of C, N, Ni, and S show the homogeneous dispersion of Ni in the CMNS. | ||
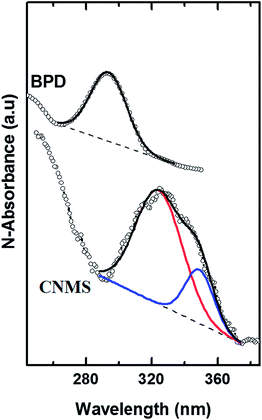
Fig. 8 shows The UV-vis measurement of the CMNS compared to the PBD without Ni incorporation. The BPD shows a band at ∼292 nm, the CNMS in the transmission mode shows characteristic metal-to-ligand charge-transfer (MLCT) bands in the region between 300 and 370 nm. These bands are attributed to intraligand π → π* transition. The splitting in bands of BPD–Ni (312.91 and 341.7 nm) is characteristic for the formation of Ni+2–5,5′-bis(mercaptomethyl)-2,2′-bipyridine complex.23,24
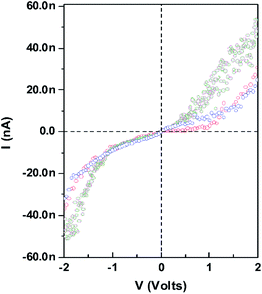
The CMNS were electrically tested on a probe station using a semiconductor parameter analyzer (Keithley Instruments Inc.) using two-probe measurement at room temperature and under vacuum to avoid the influence of water. Typical I–V characteristic of the CMNS are shown in Fig. 9. Each curve corresponds to a measurement in different areas on the CMNS. The I–V curve of the contact made directly on top of the CMNS exhibits a molecular behavior. At low bias, the current increases linearly with applied bias. However, at high bias the current increases exponentially with applied voltage, which is expected for a metal–alkanedithiol–metal junction.25 According to the I–V result, I suggest that the electron-induced crosslinking generates mostly a σ bond between the molecules.
 | ||
| Fig. 9 Room-temperature current versus voltage of the CMNS. Each curve corresponds to a measurement in a different area on top of CMNS. | ||
Conclusions
In summary, this report describes a novel method of fabricating a carbon nanosheet with encapsulated metal that involves modification of a (5,5′-bis(mercaptomethyl)-2,2′-bipyridine) SAM using high-energy electrons. The author fabricated a freestanding organometallic nanomembrane with 3 nm thickness and a large lateral dimension. After crosslinking of the (BPD–Ni+2) SAMs, the CMNS were released by dissolving the underlying substrate or by scission of the anchor group-substrate bonds. Using a combination of several complementary experimental techniques, the chemical properties of the nanomembrane were investigated: the XPS, EDX and UV-vis analyses revealed the presence of the Ni+2 in the CMNS backbone. The complexation of the bipyridine functionality by Ni+2 is supported by the splitting of the intraligand π → π* transition bands in the UV-vis spectra and by the shift in the N 1s XPS spectra.The fabricated CMNS displays interesting semiconducting behavior that can be useful for molecular electronics applications. Further studies are in progress in our institute to elucidate the electron transfer mechanism in junctions based on a CNMS. The CMNS was functionalized using sulfur to accommodate further architectures such as the growth of biological systems, and grafting of different metallic structures.
Acknowledgements
I appreciate the help of Pr. Kohei Uosaki and the valuable assistance of MANA foundry. This work has been supported by the International Center for Young Scientists (ICYS) on Materials Nanoarchitectonics (WPI-MANA).References
- K. B. Blodgett, US Pat., 2220860, 1940.
- R. G. Nuzzo, F. A. Fusco and D. L. Allara, Spontaneously organized molecular assemblies. Preparation and properties of solution adsorbed monolayers of organic disulfides on gold surfaces, J. Am. Chem. Soc., 1987, 109, 2358–2368 CrossRef CAS.
- A. Ulman, An Introduction to Ultrathin Organic Films: Langmuir-Blodgett to Self-Assembly, Academic Press, New York, 1991 Search PubMed; Chem. Rev., 1996, 96, 1533–1554 Search PubMed.
- F. Schreiber, Self-assembled monolayers: from ‘simple’ model systems to biofunctionalized interfaces, J. Phys.: Condens. Matter, 2004, 16, R881–R900 CrossRef CAS.
- M. A. Reed, C. Zhou, C. J. Muller, T. P. Burgin and J. M. Tour, Conductance of a molecular junction, Science, 1997, 278, 252–254 CrossRef CAS.
- T. Baunach, V. Ivanova, D. M. Kolb, H. G. Boyen, P. Ziemann, M. Buttner and P. A. Oelhafen, New Approach to the Electrochemical Metallization of Organic Monolayers: Palladium Deposition onto a 4,4′-Dithiodipyridine Self-Assembled Monolayer, Adv. Mater., 2004, 16, 2024–2028 CrossRef CAS.
- A. R. Rocha, et al., Towards molecular spintronics, Nat. Mater., 2005, 4, 335–339 CrossRef CAS PubMed.
- H. Hamoudi, S. Neppl, P. Kao, B. Schüpbach, P. Feulner, A. Terfort, D. Allara and M. Zharnikov, Orbital-Dependent Charge Transfer Dynamics in Conjugated Self-Assembled Monolayers, Phys. Rev. Lett., 2011, 107, 027801 CrossRef CAS.
- M. J. Lercel, H. G. Craighead, A. N. Parikh, K. Seshadri and D. L. Allara, Sub-10 nm lithography with self-assembled monolayers, Appl. Phys. Lett., 1996, 68, 1504 CrossRef CAS PubMed.
- A. Turchanin, A. Beyer, C. Nottbohm, X. Zhang, R. Stosch, A. Sologubenko, J. Mayer, P. Hinze, T. Weimann and A. Golzhauser, One Nanometer Thin Carbon Nanosheets with Tunable Conductivity and Stiffness, Adv. Mater., 2009, 21, 1233–1237 CrossRef CAS.
- A. Turchanin and A. Golzhauser, Carbon nanomembranes from self-assembled monolayers: Functional surfaces without bulk, Prog. Surf. Sci., 2012, 87, 108–162 CrossRef CAS PubMed.
- C. Olsen and P. A. Rowntree, Bond-selective dissociation of alkanethiol based self-assembled monolayers adsorbed on gold substrates, using low-energy electron beams, J. Chem. Phys., 1997, 108, 3750–3763 CrossRef PubMed.
- W. Eck, A. Kuller, M. Grunze, B. Volkel and A. Golzhauser, Freestanding Nanosheets from Crosslinked Biphenyl Self-Assembled Monolayers, Adv. Mater., 2005, 17, 2583–2587 CrossRef CAS.
- H. Hamoudi, M. Prato, C. Dablemont, M. Canepa and V. A. Esaulov, Self-Assembly of 1,4-Benzenedimethanethiol Self-Assembled Monolayers on Gold, Langmuir, 2010, 26, 7242–7247 CrossRef CAS PubMed.
- H. Hamoudi, Z. A. Guo, M. Prato, C. Dablemont, W. Q. Zheng, B. Bourguignon, M. Canepa and V. A. Esaulov, On the self-assembly of short chain alkanedithiols, Phys. Chem. Chem. Phys., 2008, 10, 6836–6841 RSC.
- L. Pasquali, F. Terzi, C. Zanardi, L. Pigani, R. Seeber, G. Paolicelli, S. M. Suturin, N. Mahne and S. Nannarone, Structure and properties of 1,4-benzenedimethanethiol films grown from solution on Au (111): An XPS and NEXAFS study, Surf. Sci., 2007, 601, 1419–1427 CrossRef CAS PubMed.
- L. Pasquali, F. Terzi, R. Seeber, B. P. Doyle and S. Nannarone, Adsorption geometry variation of 1,4-benzenedimethanethiol self-assembled monolayers on Au (111) grown from the vapor phase, J. Chem. Phys., 2008, 128, 134711 CrossRef CAS PubMed.
- L. Pasquali, F. Terzi, R. Seeber, S. Nannarone, D. Datta, C. Dablemont, H. Hamoudi, M. Canepa and V. A. Esaulov, UPS, XPS, and NEXAFS Study of Self-Assembly of Standing 1,4-Benzenedimethanethiol SAMs on Gold, Langmuir, 2011, 27, 4713–4720 CrossRef CAS PubMed.
- T. Nakanishi, B. Ohtani and K. Uosaki, Fabrication and characterization of CdS nanoparticle mono- and multilayers on a self-assembled monolayer of alkanedithiols on gold, J. Phys. Chem. B, 1998, 102, 1571–1577 CrossRef CAS.
- H. Hamoudi, K. Döring, F. Chesneau, H. Lang and M. Zharnikov, Self-Assembly of Pyridine-Substituted Alkanethiols on Gold: The Electronic Structure Puzzle in the Ortho- and Para-Attachment of Pyridine to the Molecular Chain, J. Phys. Chem. C, 2012, 116, 861–870 CAS.
- M. J. Esplandiu and P. L. M. Noeske, XPS investigations on the interactions of 1,6-hexanedithiol/Au (111) layers with metallic and ionic silver species, Appl. Surf. Sci., 2002, 199, 166–182 CrossRef CAS.
- Y. Tai, A. Shaporenko, W. Eck, M. Grunze and M. Zharnikov, Abrupt change in the structure of self-assembled monolayers upon metal evaporation, Appl. Phys. Lett., 2004, 85, 6257 CrossRef CAS PubMed.
- A. E. Gilliam, D. H. Hey and A. Lambert, The absorption spectra of the phenylpyridines and pyridyldiphenyls, J. Chem. Soc., 1941, 364–367 RSC.
- C. S. Pilz and C. Steinem, Modulation of the conductance of a 2,2′-bipyridine-functionalized peptidic ion channel by Ni2+, Eur. Biophys. J., 2008, 37, 1065–1071 CrossRef CAS PubMed.
- B. Hylke, P. Akkerman, W. M. Blom and D. M. de Leeuw Bert de Boer, Towards molecular electronics with large-area molecular junctions, Nature, 2006, 441, 69–72 CrossRef PubMed.
- L. Tortech, Z. Mekhalif, J. Delhalle, F. Guittard and S. Geribaldi, Self-assembled monolayers of semifluorinated thiols on electrochemically modified polycrystalline nickel surfaces, Thin Solid Films, 2005, 491, 253–259 CrossRef CAS PubMed.
- G. Liu, A. Klein, A. Thissen and W. Jaegermann, Electronic properties and interface characterization of phthalocyanine and Ru-polypyridine dyes on TiO2 surface, Surf. Sci., 2003, 539, 37–48 CrossRef CAS.
- C. Agnes, J.-C. Arnault, F. Omnes, J. Bruno, M. Billon, G. Bidand and P. Mailley, XPS study of ruthenium tris-bipyridine electrografted from diazonium salt derivative on microcrystalline boron doped diamond, Phys. Chem. Chem. Phys., 2009, 11, 11647–11654 RSC.
- N. Tuccitto, V. Ferri, M. Cavazzini, S. Quici, G. Zhavnerko, A. Licciardello and M. A. Rampi, Highly Conductive 40-nm Long Molecular Wires Assembled by Stepwise Incorporation of Metal Centres, Nat. Mater., 2009, 8, 41–46 CrossRef CAS PubMed.
| This journal is © The Royal Society of Chemistry 2014 |


