Debashis Patraa,
Nirmalendu Biswasa,
Bipul Mondala,
Partha Mitrab,
Michael G. B. Drewc and
Tapas Ghosh*a
aPost Graduate Department of Chemistry, Ramakrishna Mission Vivekananda Centenary College, Rahara, Kolkata-700118, India. E-mail: ictg_64@yahoo.co.in
bDepartment of Inorganic Chemistry, Indian Association for the Cultivation of Science, Jadavpur, Kolkata-700032, India
cDepartment of Chemistry, The University of Reading, P. O. Box 224, Whiteknights, Reading RG6 6AD, UK
First published on 7th May 2014
Eight mixed-ligand hydrazonato-oxidovanadium(V) complexes of the type [VVO(HL1)(A1–4)] (1–4) and [VVO(HL2)(A1–4)] (5–8) have been investigated, where (HL1)2− and (HL2)2− represent the dianionic forms of the 2-hydroxybenzoylhydrazone of acetylacetone (H3L1) and benzoylacetone (H3L2) respectively, and (A1–4)− represents the monoanionic forms of 2-hydroxybenzaldehyde (HA1), 2-hydroxy-5-methylbenzaldehyde (HA2), 2-hydroxy-5-methoxybenzaldehyde (HA3) and 5-bromo-2-hydroxybenzaldehyde (HA4) respectively. The complexes were synthesized by refluxing [VIVO(acac)2] and [VIVO(bzac)2], where acac− and bzac− are the monoanionic forms of acetylacetone (Hacac) and benzoylacetone (Hbzac) respectively with an equimolar amount of 2-hydroxybenzoylhydrazide in methanol followed by the addition of either an equivalent amount or a slight excess of each HA. 1H NMR spectra of complexes 1–3 and 5–7 in CDCl3 indicated the existence of two isomeric forms arising from the interchange of the coordinating positions of the bidentate A− ligand between axial and equatorial positions, a conclusion which is also supported by 51V NMR spectra. The vanadium atom in these complexes is in a six-coordinate distorted octahedral environment in which the dinegative hydrazone ligands in the enol form bind the vanadium in a tridentate meridional fashion utilizing their enolic-O, one imine-N and amide-O atoms, leaving the phenolic-O and other imine-N atoms unbonded although they do form intramolecular hydrogen bonds as is evident from IR, 1H NMR and X-ray diffraction studies. Analysis of electronic spectra and redox potential (E1/2) values of these complexes indicate that the λmax values for the LMCT transition and the E1/2 values are linearly related to the Hammett σ constants of the substituents in the monoanionic aryloxy ring of the A− co-ligand. On keeping in methanol for ∼5 days, the monomers 1–8 are converted to dimethoxide bridged dimeric [VVO(HL)(OCH3)]2 (9 and 10) complexes while oxido bridged dimeric [VVO(HL)]2O (11 and 12) complexes are obtained from dichloromethane or chloroform solution at room temperature after ∼5 days. On dissolution in CHCl3 or CH2Cl2, the [VVO(HL)(OCH3)]2 complexes converted to their respective monomeric [VVO(HL)(OCH3)] analogues and also to oxido bridged dimeric [VVO(HL)]2O species which is evident from their 1H NMR, 51V NMR and mass spectra.
![]() | ||
Scheme 1 (a) The previously used tridentate dibasic ONO donor hydrazone ligands,8 (b) the new tridentate dibasic ONO donor hydrazone ligands and (c) the bidentate monobasic OO donor co-ligands used in this study. |
![]() | ||
Scheme 2 The six (a–f) previously observed key structural types for the ONO donor hydrazone ligands shown in Scheme 1 [e is seen with XX = OO, ON and NN bidentate co-ligands with V(V) for the mono basic OO and ON co-ligands and V(IV) for the neutral NN co-ligand].8 Prior to the present study, the only related structurally characterised mixed-ligand V(IV) complex contains an ONN donor Schiff base and 2-hydroxybenzaldehyde co-ligand and was of type (e).9 |
![]() | ||
Scheme 3 Formation of monomeric and dimeric complexes of the new ONO donor hydrazone ligands investigated in this study (superscripts a and p stand for aldehydic and phenolic oxygen respectively). |
Important vibration bands of the ligands in their vanadium complexes, which are useful for determining the mode of coordination of ligands, are given in the experimental section. The strong bands in the regions 1591–1598, 1268–1279 and 1028–1035 cm−1 may be assigned to CN(azomethine), C–O(enolic) and N–N stretching respectively of the coordinated hydrazone ligands.1–8 The broad band in the region 3422–3466 cm−1 is attributed to the intramolecularly H-bonded phenolic O–H moiety.8n The strong bands observed in the region 1648–1657 cm−1 and near 980 cm−1 are assigned respectively to ν(C
O) of the bonded CHO group8a,b,j in the coordinated A− species and ν(V
O).
Crystals of the thermodynamically more stable isomers of complexes 1 and 5 were isolated from the reaction medium at room temperature after ∼5 days. Molecular views of 1 and 5 are displayed in Fig. 1 and S1† respectively which indicate that both complexes are of structural type e (with XX = monobasic OO bidentate co-ligand, Scheme 2). Important bond lengths and bond angles for 1 are presented in Table 1. The dimensions in 5 are similar but the quality of the data is not sufficient to merit detailed consideration here. In both compounds the metal atom is in a six-coordinate distorted octahedral environment being bonded to a terminal oxygen, together with the tridentate (HL1)2−/(HL2)2− and bidentate (A1)− ligands. The VO bond length in 1 at 1.572(3) Å is similar to those observed in oxidovanadium(V) complexes,1–8 but is shorter than is observed [1.605(3) Å] in the reported mixed-ligand oxidovanadium(IV) complex containing 2-hydroxybenzaldehyde as coligand,9 probably due to the higher (+V) oxidation state of vanadium which increases the extent of π-bonding. The effect of the difference in oxidation state of the metal is more prominent in the V–O(4) (phenolato) bond length, which is shorter by 0.15 Å than the similar type of V–O bond in the above-mentioned V(IV) complex. The terminal oxygen atom is trans to the carbonyl oxygen O(5) of the A− species with bond length of 2.322(4) Å, no doubt lengthened by the trans effect. The equatorial plane contains the three donors of (HL1)2− in the enol form and the equatorial donor phenoxide-O atom of the (A1)− ligand and shows r.m.s. deviation of 0.049 Å and the metal atom is displaced from the plane by 0.324(2) Å towards the axial vanadyl oxygen atom. Thus, the (HL1)2− species functions as a tridentate dinegative meridional ligand providing enolate-O, imine-N and amide-O (in the enol form) donor atoms to the vanadium(V) leaving the other two potential donor sites (phenoxide-O and other imine-N) uncoordinated probably due to their non-planarity with the former donor sites. However, these two moieties are involved in intra-molecular H-bonding with dimensions O(6)⋯N(2) 2.575(2) Å, H(6)–N(2) 1.87 Å and O(6)–H(6)⋯N(2) 143°. This type of meridional binding in hydrazone ligands was also observed in the mixed-ligand hydrazone complexes reported earlier.8n These hydrazone ligands generate a six-membered and a five-membered chelate ring at the vanadium center with the corresponding bite angles being 85.2(2)° and 75.9(1)°. The atoms in the five-membered ring are coplanar with an r.m.s. deviation of 0.025 Å while the six-membered ring is folded. The C–O, C–N and N–N distances of the five-membered chelate ring are consistent with the enolate form of the amide. The bite angle of the third chelate ring, that formed by (A1)−, is 81.6(2)°, with the constituent atoms, [V–O(4)–C(11)–C(12)–C(17)–O(5)], approximately coplanar with r.m.s. deviations of 0.123 Å and this plane is almost perpendicular to the mean equatorial plane intersecting at an angle of 84.2(1)°.
![]() | ||
Fig. 1 Molecular structure of 1 showing the atom numbering scheme with ellipsoids at 30% probability. Hydrogen bonds are shown as dotted bonds. |
V–O1 | 1.572(3) |
V–O2 | 1.849(4) |
V–O3 | 1.925(5) |
V–O4 | 1.820(4) |
V–O5 | 2.322(4) |
V–N1 | 2.026(5) |
O1–V–O2 | 96.8(2) |
O1–V–O3 | 105.7(2) |
O1–V–O4 | 100.9(2) |
O1–V–O5 | 174.5(1) |
O1–V–N1 | 96.6(2) |
O2–V–O3 | 152.0(1) |
O2–V–O4 | 104.5(2) |
O2–V–O5 | 77.8(1) |
O2–V–N1 | 85.2(2) |
O3–V–O4 | 87.7(1) |
O3–V–O5 | 79.2(2) |
O3–V–N1 | 75.9(1) |
O4–V–O5 | 81.6(2) |
O4–V–N1 | 158.8(1) |
O5–V–N1 | 82.1(2) |
The VO(1) (oxido), V–O(2) (enolato), V–O(3) (amido) and V–O(4) (phenolato) bond lengths are well within the range reported for VO3+ complexes with carbonic acid hydrazide ligands.8c,e,h,i,k–n,12–14 The five vanadium–oxygen bond lengths in this complex follow the order: oxido < phenolato < enolato < amido < carbonyl, which is probably consistent with the order of O → V π-bonding.
1H NMR spectral data of the complexes 1–8 suggest the binding nature of the ligands to vanadium. The proton signals of the complexes 1–3 and 5–7 in CDCl3 solution indicate the existence of two isomeric forms (A and B) in different ratios (vide experimental section) arising from the exchange of the coordinating position of phenolic-O and carbonyl-O groups of the coordinated A− ligand between equatorial and axial positions8a,b,j (Schemes S1 and S2† respectively) while only one isomeric form is observed for complexes 4 and 8 (Scheme S3†). The H (17-CHO) of 1 appears as a singlet at δ 9.43 and 9.90 ppm respectively for A and B isomers. Such a large difference in δ value for these two isomers suggests that the CHO group is bonded to vanadium and it is more strongly bonded in the B isomer than in the A isomer. This is only possible if the CHO group is bonded in the axial position trans to the terminal vanadyl oxygen in A and in an equatorial position in B, as in the former this group is weakly bonded to vanadium due to the trans influence of the vanadyl oxygen. So, the structures shown in Scheme S1† for 1A and 1B are likely to be correct. Indeed the more stable isomer 1A has been structurally characterized in the solid state, vide supra. Such differences in the δ value of the CHO group is also observed for complexes 2, 3 and 5–7. However by contrast in complexes 4 and 8 only one signal is observed at δ 9.86 and 9.84 ppm respectively indicating the presence of only one isomeric form in solution.
In order to investigate whether the two isomeric forms were present in solution, 51V NMR spectra (Fig. S2†) of complexes 1–4 were measured in CDCl3 solution and exhibit four resonances: one in the region −(462–482) ppm, and the other three at ∼−511, ∼−524 and ∼−545 ppm, relative to external VOCl3 along with one further weak signal at −508 ppm and −455 ppm for 2 and 3 respectively. Complexes 5–8 also exhibit four signals: one in the region −(465–487) ppm, and other three at ∼−515, ∼−523 and ∼−545 ppm along with a weak signal at −488 ppm and −458 ppm respectively for6 and 7. On comparing these data with the 51V NMR spectra of the respective oxido bridged dimeric [VVO(HL)]2O complexes (vide infra), the signals at ∼−510 and ∼−520 ppm are assigned to the respective [VVO(HL)]2O complex which is formed in situ through the loss of the bidentate A− co-ligand from the respective [VVO(HL)(A)] complex in CDCl3 solution. The signal at ∼−545 ppm can be attributed to the [VVO(HL)(OH)] complex as it has been observed previously in this type of complex,15 and is likely to be formed as an intermediate species in the process of conversion to [VVO(HL)]2O (Scheme 3). Thus, the resonance in the region −(462–482) ppm for 1–4 and in the region –(465–487) ppm for 5–8 is assigned to the more stable isomer A of the respective [VVO(HL)(A)] complex. The weak signals at −508, −455, −488 and −458 ppm respectively for 2, 3, 6 and 7 are assigned to their relatively less stable B isomer. The fact that this signal does not appear in the spectra of 1 and 5 suggests that the relatively less stable B isomers of 1 and 5, which are observed in their 1H NMR spectra, have been converted either to the A isomer or to the [VVO(HL)]2O species because of the higher scanning-time for 51V NMR spectra in comparison to 1H NMR spectra. In this context, it is worth noting that the 1H NMR spectra of the 1–3 and 5–7 complexes in the 51V NMR time scale indicated a sharp decrease in concentration of the respective B isomer; the A:
B ratio is found to be 8
:
1, 8
:
3, 7
:
3, 6
:
1, 5
:
2 and 3
:
1 for these six complexes respectively.
All the complexes (except 3 and 7 which are violet in CH2Cl2) are reddish-brown in CH2Cl2 and they exhibit intense transitions, the one at lowest energy is in the 419–527 nm region (Fig. S3†), assigned to LMCT transition of the type O(phenolic) → V+5 (Table 2). The intra-ligand π → π* transition is observed in the 323–335 nm region. An examination of λmax values (for LMCT transitions) of complexes 1–8 indicates that an electron donating group (viz., CH3 and OCH3) at the para position with respect to phenolic OH group in the co-ligand, increases the λmax value, while an electron withdrawing group (e.g., Br) decreases it, a variation expected from the relative basicity of the ligands. The trend in the λmax values of these complexes is in the opposite direction with respect to the substitution in the primary hydrazone ligands,8j suggesting that the LMCT transition occurs from the phenoxidic-O of the A− ligand to the V5+.
Complex | λmax/nm (ε/dm3 mol−1 cm−1) | (E1/2)I/Vb (ΔEp/mV)c | (E1/2)II/V (ΔEp/mV) |
---|---|---|---|
a At a Pt electrode; supporting electrolyte: Bu4nN+ PF6− (TBAHFP ∼0.1 M); scan rate: 50 mV s−1; reference electrode: Ag/AgCl; solute concentration: ∼10−3 M.b E1/2 is calculated as the average of anodic (Eap) and cathodic (Ecp) peak potentials.c ΔEp = Eap − Ecp; sh = shoulder. | |||
[VVO(HL1)(A1)] (1) | 465(3514), 325(5461) | 0.08(120) | 0.34(80) |
[VVO(HL1)(A2)] (2) | 505(3561), 323(7982) | 0.03(120) | 0.33(80) |
[VVO(HL1)(A3)] (3) | 527(3077), 326(4965) | 0.00(160) | 0.31(100) |
[VVO(HL1)(A4)] (4) | 425(4520), 332(7167) | 0.17(180) | 0.37(100) |
[VVO(HL2)(A1)] (5) | 450(4717), 331(6467) | 0.08(140) | 0.37(60) |
[VVO(HL2)(A2] (6) | 490(3621), 327(7677) | 0.04(140) | 0.35(100) |
[VVO(HL2)(A3)] (7) | 509(4210), 335(5067) | 0.01(180) | 0.34(100) |
[VVO(HL2)(A4)] (8) | 419(3243), 328(6365) | 0.18(120) | 0.39(100) |
[VVO(HL1)(OCH3)]2 (9) | 374sh(4308), 335(6840) | 0.37(120) | |
[VVO(HL2)(OCH3)]2 (10) | 425sh(1862), 328(14655) | 0.38(120) | |
[VVO(HL1)]2O (11) | 380sh(4175), 332(7456) | 0.36(120) | |
[VVO(HL2)]2O (12) | 428sh(5503), 327(6736) | 0.37(100) |
Complexes 1–8 exhibit two quasi-reversible one electron reduction peaks (Fig. 2) in CH2Cl2 solution near +0.10 V and +0.35 V versus Ag/AgCl (Table 2). Practically no change in peak positions was observed but there was a slight change in peak heights on changing the scan rate (Fig. S5†). On the basis of peak to peak separation (ΔEp) values13,16–21 and also comparing the cyclic voltammogram of similar type of complexes,8a,j,n these reduction peaks may be described as the step-wise reduction of VO3+ → VO2+ and VO2+ → VO+ respectively, eqn (1) and (2).
[VVO(HL)(A)] + e− → [VIVO(HL)(A)]− | (1) |
[VIVO(HL)(A)]− + e− → [VIIIO(HL)(A)]2− | (2) |
![]() | ||
Fig. 2 Cyclic voltammogram of the complexes in CH2Cl2 solution: (a) for complexes 1–4 and (b) for complexes 5–8. |
The E1/2 values (the average13,16–21 of cathodic and anodic peak potential values) (Table 2) are comparable with those obtained from similar types of complexes,8a,j but are respectively higher and lower than the corresponding complexes8n with 8-hydroxyquinoline (a monobasic ON donor ligand) and 4-hydroxy-3-methoxybenzaldehyde (a monobasic OO donor ligand), which is expected from the relative basicities of the co-ligands. A scrutiny of the redox potential data (Table 2) indicates that the E1/2 value decreases with an increase in electron donating properties of the substituent at the para position with respect to the phenolic OH group in the co-ligand (HA) and the reverse is true for the electron withdrawing group, which can be explained on the basis of the relative basicity of A− species.
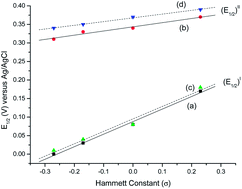
2-Hydroxybenzaldehyde along with its three substituted derivatives at the 5-position (HA1–4) show different Hammett parameter (σ) values22 [H (σ = 0.00), CH3 (σ = −0.17), OCH3 (σ = −0.27), and Br (σ = +0.23)] and have been used in this work with a view to studying their effects on the electronic properties of vanadium. In complexes 2 and 3 and also in 6 and 7 with electron donating substituents, a increase in λmax values (for LMCT transitions) and a decrease in E1/2 values were observed compared to complexes 1 and 5 which have no substituent, while for complexes 4 and 8 with an electron withdrawing substituent, the opposite is true. To discover the quantitative relationships between λmax and E1/2 with σ, respective values were plotted against σ and the following linear relationhips, eqn (3) and (4) (Fig. 3 and 4) were obtained for complexes 1–4 and eqn (5) and (6) for complexes 5–8 (Fig. 3 and 4).
![]() | ||
Fig. 4 Plot of E1/2 versus Hammett constant (σ) of the [VVO(HL)(A)] complexes: (a) and (b) for the complexes 1–4; (c) and (d) for the complexes 5–8. |
For complexes 1–4: UV-Vis:
λmax (nm) = 469.7 − 205.2 × σ | (3) |
For complexes 1–4: CV:
(E1/2)I (V) = 0.088 + 0.34 × σ | (4a) |
(E1/2)II (V) = 0.34 + 0.11 × σ | (4b) |
These correlations have r values of −1.00, 1.00 and 0.99 respectively and the equations indicate that the dependence of the λmax (i.e., dλmax/dσ) on the substituent is −205.2 nm and that of (E1/2)I and (E1/2)II [i.e., d(E1/2)I/dσ and d(E1/2)II/dσ respectively] values are 0.34 V and 0.11 V respectively.
For complexes 5–8: UV-Vis:
λmax (nm) = 457.4 − 183.0 × σ | (5) |
For complexes 5–8: CV:
(E1/2)I (V) = 0.095 + 0.34 × σ | (6a) |
(E1/2)II (V) = 0.368 + 0.10 × σ | (6b) |
These correlations have r values of −0.99, 0.99 and 1.00 respectively. These three relationships show that the dependence parameters i.e., dλmax/dσ, d(E1/2)I/dσ and d(E1/2)II/dσ values are −183.0 nm, 0.34 V and 0.10 V respectively.
However, it is to be noted that on standing in methanol for ∼5 days, these two sets of monomeric mixed-ligand complexes 1–4 and 5–8, lose their bidentate ligand, forming instead the doubly methoxide bridged dimeric complexes [VVO(HL1)(OCH3)]2, (9) and [VVO(HL2)(OCH3)]2, (10) respectively (type c, Scheme 2), while in CHCl3 or CH2Cl2 solution, the singly oxido bridged dimers [VVO(HL1)]2O, (11) and [VVO(HL2)]2O, (12) respectively (type a, Scheme 2) were obtained after ∼5 days. The formation of the [VVO(HL)(OCH3)]2 complex is represented by the eqn (7):
2[VVO(HL)(A)] + 2CH3OH → [VVO(HL)(OCH3)]2 + 2HA | (7) |
This type of dimethoxide bridged dimeric complex was also formed by our previously used ONO donor hydrazone ligands (Scheme 1a) but under different conditions,8i e.g., either by direct interaction of [VIVO(acac)2] with an equimolar amount of hydrazone ligand in methanol or in the presence of a half-equivalence of 4,4′-bipyridine and through the loss of 2,2′-bipyridine (bipy) from the [VIVO(hydrazone ligand)(bipy)] complex in methanol.
Selected vibration bands of the ligands in their vanadium complexes are given in the experimental section. In addition to bands characteristic of the ligands, these complexes exhibited a strong band near 985 cm−1, which is attributed to the VO stretch indicating six-coordinate environment around the vanadium (for five-coordinate environment it appears near 995 cm−1).8i
The dimeric structure of 10 is illustrated in Fig. 5 and the dimensions in the metal coordination sphere are shown in Table 3. This dimer does not lie on a crystallographic centre of symmetry, formed by bridging two methoxide-O atoms, which is frequently observed for similar types of methoxide bridged hydrazonato-oxidovanadium(V) complexes.8i,17–19 To the best of our knowledge, complex 10 represents the first example of such a complex in which there is no crystallographic centre of symmetry. The two independent metal atoms V(1) and V(2) have equivalent six-coordinate distorted octahedral environments being bonded to a terminal oxygen atom at 1.584(2), 1.588(2) Å which is trans to a bridging methoxide oxygen at 2.282(2), 2.297(2) Å. This bridging methoxide is also part of the equatorial plane of the other metal atom at 1.837(2), 1.833(2) Å together with the three donor atoms of the hydrazone ligand. The non-bonded V(1)⋯V(2) separation is 3.336(1) Å. The central V2O2 ring shows an r.m.s. deviation of 0.030 Å. The bridging bond angles V(1)–O(4)–V(2) and V(1)–O(9)–V(2) are 107.23(8)° and 107.70(8)° respectively. As in 5, the H3L2 ligand binds the vanadium meridionally in its doubly deprotonated (HL2)2− form through the enolate-O, imine-N and deprotonated amide-O donor atoms (in its enol form) generating a folded six-membered and an almost planar five-membered chelate ring, the latter exhibiting r.m.s. deviations of 0.015, 0.113 Å for the five atoms including V(1) and V(2) respectively. The corresponding bite angles are 83.42(9)/83.56(8)° and 75.28(8)/75.47(8)° values which are very similar to those obtained in other oxidovanadium(V) complexes containing this ligand.8n The equatorial square plane around the metal centre shows r.m.s. deviations of 0.036, 0.004 Å respectively, with the metal atoms V(1) and V(2) 0.304(2), 0.301(2) Å from the plane in the direction of the terminal oxygen atom respectively. The atoms of the hydrazone ligand are not symmetrically disposed relative to the centre of the [OV(μ2-OCH3)2VO]4+ core and the disposition of the oxidovanadium groups is anti-coplanar, with a O–V⋯V–O torsion angle of −177.8(2)° which is similar to that observed in the other dimeric methoxide bridged oxidovanadium(V)–hydrazone complexes.8i,23–25 The five V–O bond lengths follow the order: V–O(oxido) < V–O(methoxide)e (e = equatorial) < V–O(enolate) < V–O(amide) < V–O(methoxide)a (a = axial). Both uncoordinated phenolic O–H groups are involved in intra-molecular H-bonding with the adjacent nitrogen atom with dimensions O⋯N, H⋯N and O–H⋯N 2.574(2), 1.84 Å, 148° for O10–H⋯N4 and 2.559(2), 1.83 Å, 147° for O5–H⋯N2.
![]() | ||
Fig. 5 Molecular structure of 10 showing the atom numbering scheme with ellipsoids at 30% probability. Hydrogen bonds are shown as dotted bonds. |
10 | 11 | ||
---|---|---|---|
A | B | ||
V1–O1 | 1.584(2) | 1.575(4) | 1.579(4) |
V1–O2 | 1.871(2) | 1.847(4) | 1.844(4) |
V1–O3 | 1.951(2) | 1.951(4) | 1.960(4) |
V1–O4 | 1.833(2) | 1.790(4) | 1.780(4) |
V1–N1 | 2.086(2) | 2.059(5) | 2.051(5) |
V1–O9 | 2.282(2) | ||
V2–O4 | 2.297(2) | 1.799(4) | 1.799(4) |
V2–O6 | 1.588(2) | 1.572(4) | 1.574(4) |
V2–O7 | 1.857(2) | 1.831(4) | 1.820(4) |
V2–O8 | 1.937(2) | 1.952(4) | 1.952(4) |
V2–N3 | 2.089(2) | 2.070(5) | 2.075(5) |
V2–O9 | 1.837(2) | ||
V1–V2 | 3.336(1) | 3.027(2) | 2.996(2) |
O1–V1–O2 | 98.5(1) | 104.5(2) | 102.2(2) |
O1–V1–O3 | 97.6(1) | 104.6(2) | 106.0(2) |
O1–V1–O4 | 100.5(1) | 109.1(2) | 107.9(2) |
O1–V1–N1 | 99.5(1) | 99.6(2) | 98.8(2) |
O2–V1–O3 | 155.1(1) | 146.0(2) | 146.7(2) |
O2–V1–O4 | 102.7(1) | 99.9(2) | 102.0(2) |
O2–V1–N1 | 83.4(1) | 83.1(2) | 83.6(2) |
O3–V1–O4 | 92.9(1) | 86.7(2) | 86.0(2) |
O3–V1–N1 | 75.3(1) | 75.2(2) | 75.0(2) |
O4–V1–N1 | 157.9(1) | 149.2(2) | 150.6(2) |
O2–V1–O9 | 81.2(1) | ||
O4–V1–O9 | 72.7(1) | ||
O1–V1–O9 | 172.6(1) | ||
O3–V1–O9 | 85.1(1) | ||
O9–V1–N1 | 87.6(1) | ||
O4–V2–O6 | 172.9(1) | 108.4(2) | 107.5(2) |
O4–V2–O7 | 81.5(1) | 101.0(2) | 102.8(2) |
O4–V2–O8 | 83.4(1) | 85.9(2) | 84.9(2) |
O4–V2–N3 | 90.1(1) | 148.4(2) | 148.9(2) |
O6–V2–O7 | 99.9(1) | 104.4(2) | 103.3(2) |
O6–V2–O8 | 97.8(1) | 102.7(2) | 102.9(2) |
O6–V2–N3 | 97.0(1) | 100.6(2) | 100.5(2) |
O7–V2–O8 | 154.1(1) | 148.2(2) | 148.8(2) |
V1–O4–V2 | 107.2(1) | 115.0(2) | 113.7(2) |
O7–V2–N3 | 83.6(1) | 83.5(2) | 83.2(2) |
O8–V2–N3 | 75.5(1) | 75.4(2) | 75.7(2) |
O4–V2–O9 | 72.2(1) | ||
O6–V2–O9 | 100.8(1) | ||
O8–V2–O9 | 90.5(1) | ||
O7–V2–O9 | 104.7(1) | ||
O9–V2–N3 | 158.7(1) |
Complex 10 features some minor variations in dimensions between the two halves of the dimer, but not surprisingly they appear equivalent in CDCl3 solution, as evidenced in the 1H NMR spectrum. In fact, in solution the structure is expected to be exactly the same as the differences in dimensions in the crystal are insignificant. Moreover, in CDCl3 these dimeric complexes are significantly converted to their respective monomeric species (vide infra). Two signals with different intensity ratio at ∼3.50 and 5.20 ppm, in addition to the signals characteristic of the ligand, were observed for complexes 9 and 10, and these can be attributed to terminal and bridging OCH3 groups8i respectively, indicating that significant amounts of these methoxide bridged dimeric complexes (Scheme S4†) are converted to the corresponding monomeric species (type b, Scheme 2) in CDCl3 solution. The mass spectra of these two complexes exhibited the peaks corresponding to both monomeric and dimeric species along with another peak corresponding to the oxido bridged dimeric species 11 and 12 respectively (vide experimental section) suggesting significant conversion of these dimethoxide bridged dimeric species to monomeric species and also to oxido bridged dimeric species (also evident from their 51V NMR spectra, vide infra) in non-hydroxylic solvents (e.g., in CH2Cl2, CHCl3 etc.). Three signals for each of these two complexes, at −508, −511 and −524 ppm for 9 and −511, −516 and −523 ppm for 10 were observed in their 51V NMR spectra in CDCl3 solution. The signals at −508 ppm for 9 and at −511 ppm for 10 are assigned to the respective [VVO(HL)(OCH3)]2 species while the other signals at −511, −524 ppm for 9 and −516, −523 ppm for 10 are attributed to their corresponding [VVO(HL)]2O species (vide infra) (Fig. 6). This suggests that like 1–8, these [VVO(HL)(OCH3)]2 complexes can be converted to the corresponding [VVO(HL)]2O species in CDCl3 solution probably via their monomeric analogue. Based on the above experimental observations, the behaviour of these [VVO(HL)(OCH3)]2 complexes in CDCl3 solution may be summarised as:
[VVO(HL)(OCH3)]2 ⇌ 2[VVO(HL)(OCH3)] → [VVO(HL)]2O | (8) |
Complexes 9 and 10 exhibit two intense transitions in the 374–425 nm and 328–335 nm regions in CH2Cl2 solution (Table 2) which are attributed to LMCT transition of the type O(alcoholic) → V5+ and intra-ligand π → π* transitions respectively. Complexes are electro-active displaying one quasi-reversible one-electron reduction peak near +0.37 V versus Ag/AgCl in CH2Cl2 solution (Table 2).
Similarly, the formation of [VVO(HL)]2O (11 and 12) complexes may be represented by the eqn (9) and (10) via the intermediate formation of [VVO(HL)(OH)] species (vide supra) (Scheme 3):
[VVO(HL)(A)] + H2O → [VVO(HL)(OH)] + HA | (9) |
2[VVO(HL)(OH)] → [VVO(HL)]2O + H2O | (10) |
The mass spectra of these complexes support their molecular formulae (vide experimental section). Strong bands observed in the 991–999 and 895–910 cm−1 regions for 11 and 12 are attributed to VO and V–O–V stretching respectively (important ligand characteristic bands are given in the experimental section).
The crystal structure of complex 11 contains two molecules in the asymmetric unit, called here A and B, which have similar geometries, together with one solvent chloroform molecule. The structure of complex A is shown in Fig. 7 together with the atomic numbering scheme. The dimensions of the two molecules are compared in Table 3. The two halves of each of the two molecules have closely matching dimensions. The coordination spheres of the metal are of the VO4N type and the geometry at the metal centre can best be fitted to a distorted square pyramid with the oxido-O(1) or O(6) at the apex.8k,26–30 The enolate-O(2), O(7), the amide-O(3), O(8) and the imine-N(1), N(3) atoms of the doubly deprotonated H3L1 ligand in its enol form and the bridging oxygen O(4) atom constitute the equatorial planes from which the metal atoms V(1A), V(2A), V(1B) and V(2B) are displaced by 0.483(2), 0.456(2), 0.469(2), 0.452(2) Å, respectively towards the respective terminal oxygen atom. The average O(axial)–V–O/N (equatorial) angle is ∼104°, which is only slightly different from the average angle of 102° for a square pyramidal complex (C4V) as described by Muetterties and Guggenberger.31 The extent of distortion from the perfect square-pyramidal geometry can also be quantified by the τ parameter32 (equal to Δ/60°, where Δ is the difference between the largest and next-to-largest ligand–metal–ligand angles) which is 0, 1 for idealized square pyramid and trigonal bipyramid respectively. In 11 the τ values are 0.05, 0.00, 0.07 and 0.02 respectively for V(1A), V(2A), V(1B) and V(2B) centers, indicating only very slight distortion from the ideal square pyramidal structure. The dihedral angles between the equatorial planes around V(1) and V(2) are 61.2, 61.1° for molecules A and B respectively. Two terminal oxido-O atoms in each of the two molecules are mutually trans lying on opposite sides of the V–O–V plane. The distances of the O(1) and O(6) atoms from the V(1)–O(4)–V(2) plane are respectively 0.836, 0.812 Å and 0.959, 0.959 Å in A and B respectively. The O(1)–V(1)–V(2)–O(6) torsion angles are −101.6, −99.2° in the two molecules. The V–Ot (t = terminal) [1.572(4)–1.579(4) Å], V–Ob (b = bridging) [1.780(4)–1.799(4) Å] distances and the other bond lengths and bond angles are very similar to those reported in analogous hydrazone complexes.8k,26–30 The O–C, N–C and N–N distances are consistent with the enolate form of the corresponding ligand. An examination of the bond length parameters reveals a general order: V–Ot (t = terminal) < V–Ob (bridged) < V–Oe (e = enolic) < V–Oa (a = amido), which can be explained on the basis of relative basicity of donor atoms and their π-bonding ability. The V(1)–O(4)–V(2) angles are 115.0(2)° and 113.7(2)° in A and B respectively, which are also consistent with the reported values of analogous hydrazone complexes.8k,26–30 The non-bonded V⋯V distances in the dimers are 3.027(2) Å and 2.996(2) Å, which are also very similar to those obtained in other reported hydrazone complexes8k,26–30 but much shorter than the values obtained in 10.
As expected there are intramolecular hydrogen bonds between the protonated oxygen atoms and the adjacent nitrogen atoms. Thus O(5)–H with N(2) and O(9)–H with N(4). Dimensions for O⋯N, H⋯N and O–H⋯N are 2.618(7), 1.94 Å, 139° and 2.621(7), 1.90 Å, 146° for O(5) with N(2) and 2.599(7), 1.88 Å, 146° and 2.594(7), 1.87 Å, 146° for O(9) with N(4) in A and B respectively.
1H NMR spectral data (given in the experimental section) of complexes 11 and 12, suggest the binding nature of the ligand to vanadium and are consistent with the fact that the two molecules A and B show no significant differences in dimensions. The 51V NMR spectra of 11 and 12 in CDCl3 solution display two signals respectively at −511, −524 ppm and −516, −523 ppm (Fig. 6).
Two intense transitions in the 380–428 nm and 327–332 nm regions in CH2Cl2 solution (Table 2) were observed for complexes 11 and 12, assigned to LMCT transitions of the type O(oxido) → V5+ and intra-ligand π → π* transitions respectively. Like 9 and 10, complexes 11 and 12 also display one quasi-reversible one-electron reduction peak near +0.37 V versus Ag/AgCl in CH2Cl2 solution (Table 2).
These types of substitution reactions are not usually observed when a moderately strong chelating ligand is substituted by non-chelating ligands, e.g., methoxide or oxido moieties probably because of their higher basicity. However, on reaction with an equimolar amount of 8-hydroxyquinoline (Hhq) in dichloromethane, these complexes are quantitatively transformed to [VVO(HL)(hq)] (eqn (11)), as evidenced from IR, 1H NMR and electronic spectral analysis,8n though the average bond lengths formed by the auxiliary ligands A− and hq− are almost identical.
[VVO(HL)(A)] + Hhq → [VVO(HL)(hq)] + HA | (11) |
Probably, it is the more stable five-membered chelating ring formed by the hq− species with the V-centre in comparison to the six-membered chelate formed by A− species that increases the stability of [VVO(HL)(hq)] complexes to a greater extent than [VVO(HL)(A)] complexes and is responsible for this conversion.
The hydrazone complexes were synthesized by the in situ condensation of Hbh with [VIVO(acac)2] and [VIVO(bzac)2] in methanol without isolating the respective hydrazone ligands. Hbh, 2-hydroxy-5-methylbenzaldehyde (HA2), 2-hydroxy-5-methoxybenzaldehyde (HA3) and 5-bromo-2-hydroxybenzaldehyde (HA4) were procured from Aldrich while [VIVO(acac)2] was synthesized by following the reported method.33 A similar method was adopted for the synthesis of [VIVO(bzac)2]. All other reagents were of AR grade obtained from commercial sources and used without further purification.
Footnote |
† Electronic supplementary information (ESI) available: Additional X-ray data of complexes 1, 5, 10 and 11; 51V NMR spectra; electronic spectra; cyclic voltammogram at different scan rate; atom-numbering schemes for the assignment of 1H NMR spectra. CCDC 939296, 939297, 972496 and 972497. For ESI and crystallographic data in CIF or other electronic format see DOI: 10.1039/c4ra00139g |
This journal is © The Royal Society of Chemistry 2014 |