Effects of fluorine ions on the formation and photocatalytic activities of SnO2 nanoparticles with small sizes

Tingting Hao, Guoe Cheng*, Hanzhong Ke, Yujie Zhu and Yangming Fu
Faculty of Material & Chemistry, China University of Geosciences, Wuhan, Hubei 430074, PR China. E-mail: chengguoe68@aliyun.com; Fax: +86-27-67883731; Tel: +86-27-67883731

Received 30th March 2014 , Accepted 28th April 2014

First published on 9th May 2014


Abstract

SnO2 nanoparticles with small sizes were synthesized by a simple hydrothermal route with different dosages of fluorine ions. These nanoparticles all showed a typical rutile phase and excessive dosage of fluorine ions would result in other crystallographic phases. The average diameters of the as-prepared products were all smaller than 4 nm. The introduction of fluorine ions had little influence on the morphologies and crystallite sizes, but enhanced the crystallization of the rutile phase and promoted the growth of SnO2 crystallites. XPS patterns showed that some introduced fluorine ions were physically adsorbed on the surface of SnO2 crystals, but not doped in the lattice. The photocatalytic activities were tested by photodecomposition of Rhodamine B (RhB) under a 300 W high-pressure mercury lamp. The results indicated that a suitable amount of fluorine ions on the surface of SnO2 nanoparticles caused significant enhancement of their photocatalytic activities.

1. Introduction

In recent years, semiconductor photocatalytic materials have drawn wide attention from researchers due to their wide potential applications in water, air purification and solar energy conversion and so on. SnO2, as a stable n-type wide band gap semiconductor (Eg = 3.6 eV), is well-known for potential applications in transparent electrodes, gas sensors, storage applications and solar cells.1–5 Recently, photocatalytic activities of SnO2 nanocrystals have been reported by a few papers.6–11 Li et al. report that V-shaped SnO2 bipods show unprecedented visible-light-driven photocatalytic activities.7 Meanwhile SnO2 nanostructures with various morphologies and microstructures exhibit diverse photocatalytic activities.8–11 These results reveal that SnO2 nanocrystals have a great potential prospect on photocatalytic activities. However, comparing with TiO2 nanostructures, photocatalytic performances of SnO2 nanocrystals still have much room for improvement.12–17 Enhancing the photocatalytic activities of SnO2 nanostructures is still a major challenge and worth to further study.

In general, doping or introducing additives can improve the microstructure of SnO2 nanomaterials, and affect the macroscopic performances, such as electricity, optics, magnetism and gas sensitive performances, especially the photocatalytic activities. With doping or introduced in the additive, it makes a reduction of the recombination rate of photogenerated electrons and holes, resulting in the enhancement of photoactivity.18,19 SnO2/ZnO composite has been reported to exhibit a significant enhancement of photocatalytic capability toward degrading RhB compared to undoped m-SnO2.20 Metal elements doping of SnO2 photocatalysts have been reported frequently, such as In, Sb, Au, Fe, Cd, Ni, Pd etc.21–27 However, few papers are about the doping or introducing fluorine ion into SnO2 nanostructures. In fact, studies have shown that doping or introducing fluorine ion can promote the growth of active crystal plans, reduce the recombination rate of photogenerated electrons and holes, and improve photocatalytic performances of TiO2 nanocrystals.28–34 Park et al. report that F–TiO2 is more effective than pure TiO2 for the photocatalytic oxidation of Acid Orange 7, which presents the degradation of Acid Orange 7 reaches 100% degradation rate within 40 min under UV irradiation.35 In this work, we report the simply hydrothermal synthesis of SnO2 nanoparticles with small diameters in water with assistance by sodium fluoride. Different dosages of fluorine ions are employed to study the effects of fluorine ions on the formation and photocatalytic activities.

2. Experimental section

2.1. Preparation

All the chemicals used in this experiment were analytical grade and were used without further purification. In a typical synthesis, 1.05 g of tin(IV) chloride pentahydrate (SnCl4·5H2O) was dissolved in 56 mL of distilled water under stirring at room temperature and the transparent clear solution was obtained. Then the above solution was transferred into a 70 mL stainless steel Teflon-lined autoclave. After maintaining in an oven at 180 °C for 5 h, the autoclave was cooled down to room temperature naturally. White precipitate was collected and washed with distilled water and absolute ethanol by centrifugation for several times successively, followed by drying in air at 80 °C for 24 h. The as-obtained product was called Sn–0F. On this basis, different dosages of sodium fluoride (NaF) were dissolved together with SnCl4·5H2O into distilled water to investigate the effect of the fluorine ion on SnO2 nanostructures. The molar ratios of NaF to SnCl4·5H2O (RF) were adjusted to 0.5[thin space (1/6-em)]:[thin space (1/6-em)]1, 1[thin space (1/6-em)]:[thin space (1/6-em)]1, 2[thin space (1/6-em)]:[thin space (1/6-em)]1, 3[thin space (1/6-em)]:[thin space (1/6-em)]1 and 4[thin space (1/6-em)]:[thin space (1/6-em)]1, and the as-obtained products were named as Sn–1/2F, Sn–F, Sn–2F, Sn–3F and Sn–4F, respectively.

2.2. Characterizations

The crystalline phase of the SnO2 powders were carried out by an X-ray diffractometer (XRD, Bruker Axs D8-Focus, Cu kα radiation with λ = 1.5406 Å). Surface chemical analysis of the samples was conducted on an X-ray photoelectron spectroscope (XPS, Multilab 2000). All binding energies were referenced to the C 1s peak with a binding energy of 284.7 eV of the surface adventitious carbon. The microscopic nanostructures were measured using a FEI Tecnai G2 20 transmission electron microscopy (TEM) at an acceleration voltage of 200 kV. The optical absorption properties of samples and the information on their band gap were detected by UV-vis diffuse reflectance spectra (UV-vis DRS, UV-2550) when test wavelength was 240-850 nm, the light absorption abilities of samples were characterized by apparent absorbance at 365 nm.

2.3. Photoactivity measurement

The photocatalytic activities were tested by photochemical reactions instrument (BL-GHX-IV) and UV-vis adsorption spectra (UV-1801). RhB was used as a probe molecule to research the photocatalytic activities of SnO2 nanorods. The experiments were carried out as follows: 50 mg of the samples were dispersed in 50 mL of 10 mg L−1 RhB solution in a quartz tube. Prior to illumination, the suspensions were magnetically stirred in the dark for 1 h to establish adsorption–desorption equilibrium. Subsequently, the suspension was irradiated under a 300 W high-pressure mercury lamp. Every time 5 mL of the above solution was taken out and centrifuged before UV-vis analysis. UV-vis adsorption spectra were recorded at certain time intervals (10 min) to monitor the process.

3. Results and discussion

The XRD patterns of the as-obtained products are all shown in Fig. 1. All the diffraction peaks of the sample Sn–0F can be indexed to the rutile phase SnO2 (cassiterite, JCPDS card no. 41-1445, space group: P42/mnm) with tetragonal lattice constant a = 4.738 Å and c = 3.187 Å. When different dosages of NaF were introduced, the obtained samples also show tetragonal SnO2 with rutile structure. However, the widths of the diffraction peaks can be found to become narrower steadily with the dosages of fluorine ion increased, indicating that the introduction of fluorine ion can improve crystallinity of SnO2 nanoparticles. In fact, we have found that the introduction of fluorine ion can also increase yield of SnO2 nanoparticles. The yield of those samples contained fluoride ion is at least twice as much as that of the samples without fluoride ion. However, with RF increased to 4[thin space (1/6-em)]:[thin space (1/6-em)]1, some impure peaks are found to exist in SnO2 nanocrystals (marked with *). Maybe the fluorine ions are incorporated into the SnO2 lattice which results in the formation of new crystallographic phase. Yu et al. also found that fluorine ions doping in TiO2 nanocrystallines enhanced the crystallization of anatase phase and promoted the growth of crystallites, even can changed the crystalline phase.29
image file: c4ra02802c-f1.tif
Fig. 1 The XRD pattern of the as-obtained products.

TEM images illustrate microscopic nanostructures of the as-obtained products (Fig. 2). As can be seen from Fig. 2, the samples are all composed of uniform SnO2 nanoparticles with small sizes. The average diameters of all samples are smaller than 4 nm. The introduction of fluorine ions shows little influence on the morphology and crystallite sizes. The high resolution transmission electron microscopy (HRTEM) of the products Sn–0F and Sn–2F are presented in Fig. 3. As can be seen from the Fig. 3, the lattice fringes in the HRTEM image further confirm the single-crystal nature of the SnO2 nanoparticles. The crystal spacing between adjacent lattice planes is 0.334 nm, corresponding to (110) planes of rutile SnO2.


image file: c4ra02802c-f2.tif
Fig. 2 TEM images of the as-obtained products: (a) Sn–0F; (b) Sn–1/2F; (c) Sn–F; (d) Sn–2F; (e) Sn–3F; (f) Sn–4F.

image file: c4ra02802c-f3.tif
Fig. 3 The HRTEM images of SnO2 nanoparticles: (a) Sn–0F; (b) Sn–2F.

XPS is also carried out to investigate the surface compositions and chemical state. Their corresponding binding energy values are used for quantitative measurements of the elements present in the material.36 The results of the samples Sn–0F and Sn–2F are shown in Fig. 4, respectively. The XPS patterns show that the Sn–0F contains only Sn and O without any trace impurities except C elements (Fig. 4a). The peaks of the Sn–0F observed at 486.3 eV and 495.2 eV (Fig. 4b) are attributable to Sn 3d5/2 and Sn 3d3/2, 530.6 eV to O 1s, respectively (Fig. 4c). The C element could be attributed to the adventitious carbon-based contaminant. The binding energy of Sn 3d5/2 is 486.3 eV for the Sn–0F (Fig. 4b), slightly lower than that of tin oxide (>486.4 eV). According to Peng et al., this result suggests that these nanoparticles are oxygen deficient because the oxygen deficiency can decrease the binding energy of Sn.37 The peak with an O 1s binding energy around 530.6 eV corresponds to the Sn–O–Sn bonds, indicating that the oxygen atoms exist as O2− species in the compounds (Fig. 4c).38 Quantification gives an atomic ratio of Sn and O of 1[thin space (1/6-em)]:[thin space (1/6-em)]1.518 which also confirms the existence of oxygen vacancies. In comparison, besides Sn, O, and C elements, the Sn–2F contains F elements as well (Fig. 4a). The Fig. 4d shows the binding energy of F 1s is 684.5 eV which is attributed to the fluorine ions physically adsorbed on the surface of SnO2. The surface fluoride could be formed by ligand exchange reaction between fluorine ions and the surface hydroxyl group on the surface of crystals.39 No other peak can be found to be attributed to the incorporated fluorine ions in SnO2 lattice.


image file: c4ra02802c-f4.tif
Fig. 4 The high-resolution XPS spectra of Sn–0F and Sn–2F: (a) XPS full spectrum; (b) Sn 3d; (c) O 1s; (d) F 1s.

The UV-vis DRS of all samples are presented in Fig. 5 to detect their optical absorption properties and the information on their band gap. All the composite photocatalysts have a strong absorption feature in the UV region (below 400 nm) and the visible light absorption is not observed. In comparison with the sample Sn–0F, the absorption edges of the samples Sn–F, Sn–2F, Sn–3F and Sn–4F are blue-shifted while the absorption edge of Sn–1/2F shows a slight red-shift. With the increase of fluoride ion, the blue-shift phenomenons were more greatly increased. Moreover, we can observe that the samples Sn–0F, Sn–1/2F, Sn–F and Sn–2F have a broader absorption feature while the samples Sn–3F and Sn–4F can only absorb the UV light below 375 nm.


image file: c4ra02802c-f5.tif
Fig. 5 The UV-visible diffuse reflectance spectra (DRS) of all samples.

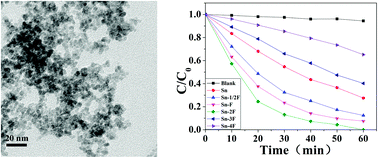
To understand the effect of particle size and crystal structure on the photocatalytic activity, the photocatalytic degradation tests are carried out (Fig. 6). C0 and C are the initial concentration after the equilibrium adsorption and the reaction concentration of RhB, respectively. Controll experiment illustrates that the degradation of RhB hardly occurs, while other solutions containing SnO2 nanocrystals show photocatalytic degradation in various extents. Comparing the samples Sn–1/2F, Sn–F and Sn–2F with Sn–0F, we find that photocatalytic activities are strongly dependent on the dosages of the introduced fluorine ions. The more fluorine ions were introduced, the larger photocatalytic activities of SnO2 show. The sample Sn–2F presents the best photocatalytic activity which shows almost 100% degradation of RhB within 60 min. However, with the dosages of fluorine ions further increased, their photocatalytic activities become much lower than that of Sn–2F, even lower than that of Sn–0F. In recent years, a few reports have studied the photocatalytic activities of SnO2 nanostructures in RhB solutions under UV irradiation. By contrast, These SnO2 nanoparticles we obtained show higher photocatalytic activities when compared with SnO2 nanostructures prepared by Wu, Wang and their co-workers etc.10,22,40 The photocatalytic reactions of semiconductor surface are due to the production of photogenerated electrons and holes in the semiconductors by the absorption of UV light. The photocatalytic efficiency depends on the recombination rate or lifetime of photogenerated electrons and holes. If recombination occurs too fast, then there is not enough time for any other chemical reactions to occur.41 Fluorine ions can serve not only as a mediator of interfacial charge transfer but also as a recombination center.42 In our study, the fluorine ions on the surface of SnO2 are believed to be responsible for a reduction of the recombination rate of photogenerated electrons and holes. Fluoride ion has a strong negative, which can make tin atoms positively charged to attract electrons and reduce O2 into O2− at the same time. However, a decrease in the photocatalytic activity is observed when excessive fluorine ions are introduced. Maybe the impure crystalline phase existing in the SnO2 crystals and the narrower absorption bound of UV light are responsible for it.


image file: c4ra02802c-f6.tif
Fig. 6 Degradation curves of RhB under UV irradiation in the presence of various photocatalysts.

4. Conclusion

In summary, SnO2 nanoparticles with small sizes have been synthesized by simple hydrothermal route with existence of different dosages of fluorine ions. Fluorine ions absorbed on SnO2 nanocrystallines improve the crystallization of rutile phase and promote the growth of crystallites. With RF increased to 4[thin space (1/6-em)]:[thin space (1/6-em)]1, other impure peaks are found to exist in SnO2 nanocrystals. A certain amount of fluorine ions are physically adsorbed on the surface of SnO2 crystals, but not doped in the lattice. The photocatalytic activities of SnO2 nanoparticles are strongly dependent on the dopant concentration since the fluorine ion can serve not only as a mediator of interfacial charge transfer but also as a recombination center. The sample Sn–2F presents the best photocatalytic property. When irradiated under a 300 W high-pressure mercury lamp, the degradation of RhB reaches 100% within 60 min.

References

  1. E. Elangovan and K. Ramamurthi, J. Optoelectron. Adv. Mater., 2003, 1, 45–54 Search PubMed.
  2. M. Law, H. Kind, B. Messer, F. Kim and P. D. Yang, Angew. Chem., Int. Ed., 2002, 41, 2505–2508 CrossRef.
  3. N. Park, M. G. Kang, K. S. Ryu, K. M. Kim and S. H. Chang, J. Photochem. Photobiol., A, 2003, 161, 105–110 CrossRef.
  4. S. Ferrere, A. Zaban and B. A. Gregg, J. Phys. Chem. B, 1997, 101, 4490–4493 CrossRef CAS.
  5. G. Cheng, J. Wang, X. Liu and K. Huang, J. Phys. Chem. B, 2006, 110, 16208–16211 CrossRef CAS PubMed.
  6. G. Cheng, J. Y. Chen, H. Z. Ke, J. Shang and R. Chu, Mater. Lett., 2011, 65, 3327–3329 CrossRef CAS PubMed.
  7. G. Wang, W. Lu, J. H. Li, J. Choi, Y. Jeong and S. Y. Choi, Small, 2006, 2, 1436–1439 CrossRef CAS PubMed.
  8. Y. T. Han, X. Wu, Y. L. Ma, L. H. Gong, F. Y. Qu and H. Fan, CrystEngComm, 2011, 13, 3506–3510 RSC.
  9. W. W. Wang, Y. J. Zhu and L. X. Yang, Adv. Funct. Mater., 2007, 17, 59–64 CrossRef CAS.
  10. S. S. Wu, H. Q. Cao, S. F. Yin, X. W. Liu and X. R. Zhang, J. Phys. Chem. C, 2009, 113, 17893–17898 CAS.
  11. T. K. Jia, W. M. Wang, F. Long, Z. Y. Fu, H. Wang and Q. J. Zhang, J. Phys. Chem. C, 2009, 113, 9071–9077 CAS.
  12. H. H. Chen and Y. M. Xu, J. Phys. Chem. C, 2012, 116, 24582–24589 CAS.
  13. J. D. Zhuang, S. X. Weng, W. X. Dai, P. Liu and Q. Liu, J. Phys. Chem. C, 2012, 116, 25354–25361 CAS.
  14. K. Nagaveni, M. S. Hegde, N. Ravishankar, G. N. Subbanna and G. Madras, Langmuir, 2004, 20, 2900–2907 CrossRef CAS.
  15. H. Park and W. Choi, Langmuir, 2006, 22, 2906–2911 CrossRef CAS PubMed.
  16. Y. H. Tseng, S. KuoC, C. H. Huang, Y. Y. Li, P. W. Chou, C. L. Cheng and M. S. Wong, Nanotechnology, 2006, 17, 2490–2497 CrossRef CAS PubMed.
  17. S. Sreekantan, K. A. Saharudin, Z. Lockman and T. W. Tzu, Nanotechnology, 2010, 21, 365603–365610 CrossRef PubMed.
  18. B. Slater, D. H. Gay, D. E. Williams and V. Dusastre, J. Phys. Chem. B, 1999, 103, 10644–10650 CrossRef CAS.
  19. A. Y. Sinyagin, A. Belov, Z. Tang and N. A. Kotov, J. Phys. Chem. B, 2006, 110, 7500–7507 CrossRef CAS PubMed.
  20. Z. H. Wen, G. Wang, W. Lu, Q. Wang, Q. Zhang and J. H. Li, Cryst. Growth Des., 2007, 7, 1722–1725 CAS.
  21. T. Wang and V. R. Pavle, J. Phys. Chem. C, 2011, 115, 406–413 CAS.
  22. J. T. Kong, S. Y. Shi and X. P. Zhu, J. Environ. Sci., 2007, 19, 1380–1386 CrossRef CAS.
  23. K. Yu, Q. R. Zhao and Y. Xie, J. Phys. Chem. C, 2008, 112, 2244–2247 CAS.
  24. J. M. Coey, C. B. Fitzgerald and M. Venkatesan, Appl. Phys. Lett., 2004, 84, 1332–1334 CrossRef CAS PubMed.
  25. K. C. Zhang, Y. F. Li and Y. Zhu, J. Appl. Phys., 2012, 112, 0437051–0437055 Search PubMed.
  26. T. Elijah, B. F. Martinson, J. W. Elam and M. J. Pellin, J. Phys. Chem. C, 2012, 116, 16830–16840 Search PubMed.
  27. Y. Masayoshi, K. Tetsuya and S. Kengo, ACS Appl. Mater. Interfaces, 2012, 4, 4231–4236 Search PubMed.
  28. R. G. Thomas, C. Matteo, P. Taejong, M. Filippo, T. W. Ralph, F. Paolo and B. M. Christopher, J. Am. Chem. Soc., 2012, 134, 6751–6761 CrossRef PubMed.
  29. J. C. Yu, J. G. Yu, W. K. Ho, Z. T. Jiang and L. Z. Zhang, Chem. Mater., 2002, 14, 3808–3816 CrossRef CAS.
  30. Z. L. He, W. X. Que, J. Chen, X. T. Yin, Y. C. He and J. B. Ren, ACS Appl. Mater. Interfaces, 2012, 4, 6816–6826 CAS.
  31. J. H. Pan, X. W. Zhang, J. H. Du, D. D. Sun and J. O. Leckie, J. Am. Chem. Soc., 2008, 130, 11256–11257 CrossRef CAS PubMed.
  32. J. K. Zhou, L. Lv, J. Q. Yu, H. L. Li, P. Z. Guo, H. Sun and X. S. Zhao, J. Phys. Chem. C, 2008, 112, 5316–5321 CAS.
  33. G. S. Wu, J. P. Wang, D. F. Thomas and A. C. Chen, Langmuir, 2008, 24, 3503–3509 CrossRef CAS PubMed.
  34. Q. Wang, C. C. Chen, D. Zhao, W. H. Ma and J. C. Zhao, Langmuir, 2008, 24, 7338–7345 CrossRef CAS PubMed.
  35. H. Park and W. Y. Choi, J. Phys. Chem. B, 2004, 108, 4086–4093 CrossRef CAS.
  36. Z. Y. Zhang, C. L. Shao, X. H. Li, L. Zhang, H. M. Xue, C. H. Wang and Y. C. Liu, J. Phys. Chem. C, 2010, 114, 7920–7925 CAS.
  37. X. S. Peng, G. W. Meng, X. F. Wang, Y. W. Wang, J. Zhang, X. Liu and L. D. Zhang, Chem. Mater., 2002, 14, 4490–4493 CrossRef CAS.
  38. G. Cheng, K. Wu, P. T. Zhao, Y. Cheng, X. L. He and K. X. Huang, Nanotechnology, 2007, 18, 355604–355610 CrossRef.
  39. J. C. Yu, J. Yu, W. Ho, Z. Jiang and L. Zhang, Chem. Mater., 2002, 14, 3808–3816 CrossRef CAS.
  40. Y. T. Han, X. Wu, Y. L. Ma, L. H. Gong, F. Y. Qu and H. J. Fan, CrystEngComm, 2011, 13, 3506–3510 RSC.
  41. J. G. Yu, W. G. Wang, B. Cheng and B. L. Su, J. Phys. Chem. C, 2009, 113, 6743–6750 CAS.
  42. J. G. Yu, Q. J. Xiang, J. G. Ran and S. Mann, CrystEngComm, 2010, 12, 872–879 RSC.

This journal is © The Royal Society of Chemistry 2014
Click here to see how this site uses Cookies. View our privacy policy here.