Characterization of NTCDI supra-molecular networks on Au(111); combining STM, IR and DFT calculations
Mahamadou Seydou*a,
Joan Teyssandiera,
Nicolas Battaglinia,
Ghislain Tsague Kenfacka,
Philippe Langa,
Frederik Tielensb,
François Maurela and
Boubakar Diawarac
aUniversité Paris Diderot, Sorbonne Paris Cité, ITODYS, UMR 7086 CNRS, 15 Rue J.-A. de Baïf, 75205 Paris Cedex 13, France. E-mail: mahamadou.seydou@univ-paris-diderot.fr
bSorbonne Université, UPMC Univ Paris 06, UMR 7574, Laboratoire Chimie de la Matière Condensée, Collège de France, 11 place Marcelin Berthelot, 75231 Paris Cedex 05, France
cDépartement Moissan, FR 3203, CNRS-ENSCP, École Nationale Supérieure de Chimie de Paris, 11 Rue Pierre et Marie Curie, 75005 Paris, France
First published on 29th May 2014
Abstract
In this paper, we investigate the self-organization of NTCDI molecules on Au(111) surface by combining Density Functional Theory (DFT) and experiments based on scanning tunneling microscopy (STM) and infrared spectroscopy measurements. The competition between the cohesive and adsorption energy on the flat surface is discussed. It was shown that the network is mainly stabilized by cohesive interactions explaining the mobility of the network over the surface. The comparison between experimental and infrared spectra enables confirmation of the effect and importance of the H-bonds in the network stability. STM images at different voltages and in ambient conditions were interpreted by projected density of states calculations and compared with experiment. The theoretically proposed network geometry was characterized at the molecular level reproducing the experimental STM image.
1. Introduction
The adsorption and self-assembly of planar organic molecules on a metallic surface to form well-ordered semiconducting layers has become a focal point in surface science, because of their potential applications in nanopatterning,1,2 charge injection at interfaces,3–5 photovoltaic applications, and biosensors.6–8 Indeed, organic molecules are able to self-organize onto a surface by the pooling of van der Waals interactions,9 metal coordination bonds,10 hydrogen bonds11 or π–π bonds.12 The control of the non-covalent interaction to generate well-defined aggregates and construct nanostructures is the basic idea of the “bottom up” approach used in nanosciences. The molecular components should incorporate complementary recognition sites for secondary interactions and the understanding of the self-organization process is a perquisite to provide well-organized molecular assemblies on surfaces.The organic π-type systems are interesting candidates to achieve a well-ordered organization onto surface since they are capable of forming molecular clusters13,14 and supramolecular assemblies15–17 in which the non-covalent interactions like hydrogen bonding interactions18,19 and electronic dispersion interactions play an important role in their stabilization.
Among all the non-covalent interactions, the hydrogen bond interaction plays a key role and the two-dimensional supramolecular networks controlled by hydrogen bonded interactions have received considerable attention during the past decade. Indeed, hydrogen bonding provides a strong directional component of the non-covalent interaction that makes easier the design of complementary subunits for the recognition process. Particularly, planar π-conjugated molecules, controlled by specific intra-molecular interactions, are potential building blocks for the realization of sophisticated 2D supra-molecular arrangements or networks,4,20–23 in particular, when these molecules are combined with other π-conjugated functional molecules through the formation of hydrogen bonds. The use of π-conjugated building blocks that hold hydrogen bonds sites is an interesting way to elaborate supramolecular networks featuring void cavities. The structures of the building block and the position of hydrogen bond sites allow constructing supramolecular networks with openings or holes of different sizes, shapes and symmetry characteristics. Over the last few decades several examples of supramolecular assemblies have been reported involving secondary interactions of hydrogen bonding. The two dimensional hydrogen bonded molecular network based on the secondary interactions between cyanuric acid and melamine was first reported in the early 1990s.24–26 Since this first study, various molecular building blocks were used to obtain two-dimensional (2D) hydrogen bonded supramolecular networks with tunable cavities. The properties of these holed networks can be controlled at the nanometric scale, in order to optimize the insertion of adsorbed molecules in these network holes.27 This type of synthesis is especially useful in the design of new organic devices, e.g. in the field of solar cell energy conversion.28–30 Later, the self-organization of molecules was studied under ultrahigh vacuum, nowadays, new methods have been developed to investigate also the solid–liquid interface.21,22 These methods have the advantage, not only to manipulate the molecules in the air, but also to achieve a phase discrimination as a function of their relative stability.20
The ability of well-designed organic molecules to self-assemble as 2D porous network on metal surfaces has been studied in the past from a theoretical point of view.31–35 However, an increasing number of theoretical studies have been undertaken to understand the relation between the molecular structures of the building blocks and the 2D H-bonded supra-molecular nanostructures.36–41
Formation mechanism for a melamine supramolecular network has been studied by combining STM (Scanning Tunneling Microscopy) images, DFT (Density Functional Theory) calculation and Kinetic Monte Carlo simulations.42 The results show a formation of ad-atom molecule pair formation and their mobility on the surface at room temperature. A similar study was conducted on the self assembly of benzene carboxylic acids onto Cu(110) surface.43 One of the conditions in order to obtain stable supra-molecular networks on a surface is a weak interaction with the latter. To tackle this problem and understand the process of supra-molecular assembly on a metal surface, powerful theoretical tools have shown their efficiency.36,44,45
Recent theoretical studies have revealed the large variety of possible topologies of the individual molecular complexes in absence of substrate. For example, in the case of melamine, three different trimmers could be obtained, while eleven different complexes have been found for the tetramer.45 Another recent study, undertaken for perylene-3,4,9,10-tetracarboxdiimide (PTCDI), shows that six different dimers could be formed, leading to at least eight different mono-dimensional arrangements on a surface.38,39
On Au(111) surface NTCDA (1,4,5,8-naphthalene-tetracarboxylic-dianhydride) and PTCDA (3,4,9,10-perylene-tetracarboxylic acid dianhydride) monomers and dimer adsorption were computationally studied at the PBE/plane wave level including van der Waals dispersion corrections.39 The results showed that the dispersion interactions affect very little the geometries of the molecules on the gold surface. At the contrary the binding energy of molecules to the Au(111) surface is significantly modified.
In contrast to PTCDI, largely used in the literature, NTCDI studies are limited to its combination to over symmetric molecules in order to form an heterogeneous porous supramolecular networks20,22,47 and yet interesting because of its average size, symmetry and chemical functions. To our knowledge only one experimental study combined with DFT calculations described the NTCDI supramolecular network on Au(111).47 This work proposed a supramolecular network based on parallel lines formed by individual NTCDI molecules. Nevertheless, no clear cut conclusion could be drawn since they are unable to determine the individual molecule orientation, moreover earlier experiments proposed a slightly different organization of the NTCDI molecules on the Au(111) surface.20 Indeed, some of the present authors observed also a supramolecular network based on parallel lines, however with a small rotation at the level of the individual molecules resulting in the formation of different intermolecular lateral H-bonds along the short axes of NTCDI, similar to the what has been observed on Au(111)47,48 and Ag/Si(111).49 In ambient conditions, it seems to appear that the potential energy of surface is flat and presents two analogous minima such as α and γ phases or MONOA and MONOB in ref. 20 and 47.
The aim of the present work is to study by means of ab initio quantum chemical DFT calculations, the arrangement of different supra-molecular structures of 1,4,5,8-naphthalenetetracarboxylic diimide (NTCDI, see Fig. 1) on Au(111) surface. This compound is a relative electron deficient compound and has been used as active component for electron-carrying (n-channel) and hole-carrying (p-channel) in Organic Field-effect transistors (OFET).50,51 In particular, we will rationalize, design and optimize the properties of these conjugated molecules in the gas phase, which are able to self-assembly through hydrogen bonds. Subsequently, surface effects are studied in detail, both for dimer and supramolecular networks in periodic conditions in order to compare relative stability in presence and absence of the surface. Simulated STM images and projected density of states were confronted to experiments. Global surface characterization is performed by using infrared spectroscopy technique. Spectra of stable phases were simulated and compared to experimental FT-IR in KBr and (Polarization Modulation Infrared Reflection Adsorption Spectroscopy) PM-IRRAS ones.
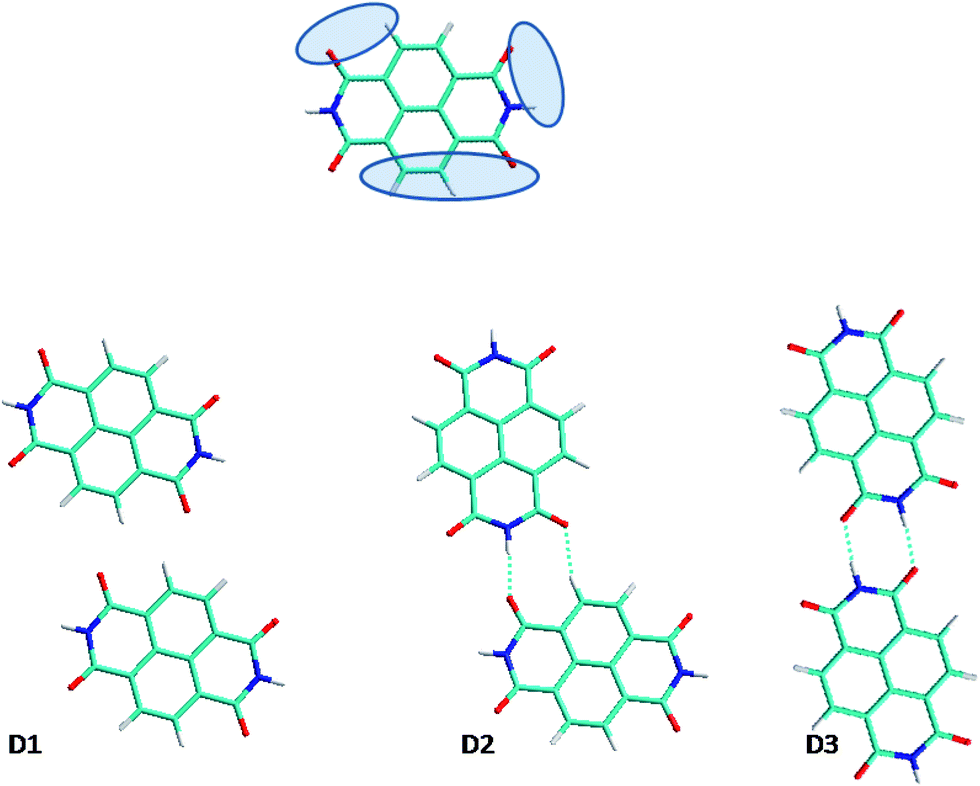 | ||
| Fig. 1 NTCDI H-bonding sites (top) and optimized NTCDI dimer structures (bottom). The colors of the displayed atoms are: blue for nitrogen, red for oxygens, white for hydrogen and all other are carbon atoms. | ||
2. Experimental section
NTCDI assemblies were made on commercially available Au(111)/mica substrates (supplier: Phasis, Geneva, Switzerland). To avoid any organic contamination, the substrates were thoroughly rinsed in pure ethanol and rapidly exposed to a hydrogen flame just before use. After this treatment, STM images exhibit large atomically flat Au(111) terraces (typical width: 200 nm) where the herringbone reconstruction is observed.NTCDI was synthesized through the imidization of commercially available naphthalene tetracarboxylic dianhydride (NTCDA, Alfa Aesar, purity 97%) in presence of NH4OH at room temperature, using a protocol published by Sotiriou-Leventis and Mao.52
Solutions of NTCDI (C = 5 × 10⁻⁴ mol L−1) were obtained through the dissolution of the molecules into dimethyl formamide (DMF; Alfa Aesar, purity 99.8%). The “dip coating” method employed to elaborate our NTCDI networks consists in heating the solution to 110 °C for 45 minutes and then dip the substrate for 1.5 minute in the solution kept at 110 °C. The sample is then rinsed in pure DMF and dried under an air flow.
Experimental Infra Red spectra were obtained with a Magna-IR 8700 spectrometer (Nicolet Instrument Corp.). The monolayers were characterized by PM-IRRAS (Polarization modulation-infrared reflection-adsorption spectroscopy), a Thermo Scientific Nicolet™ 8700 spectrometer fitted with a MCT* detector, was used for the collection of 3000 scans at 8 cm−1 resolution and 83° reflection angle.53 The baseline was electronically subtracted. Scanning Tunneling Microscopy (STM) was performed in the constant current mode (80 pA) under ambient conditions with a Multimode 8 STM head monitored through the Nanoscope V electronics (Digital Instruments, USA). STM data were analyzed with the free software WsXm (Nanotec Electronica, Spain).54
3. Computational details
3.1. Calculation method
Calculations were performed in the frame of periodic DFT by means of the Vienna ab initio Simulation Package (VASP 5.2.11).55,56 The electron–ion interactions were described by the projector augmented wave (PAW)57,58 method, representing the valence electrons, as provided in the code libraries. The convergence of the plane-wave expansion was obtained with a cut off of 500 eV. The generalized gradient approximation (GGA) was used with the functional of Perdew–Burke–Ernzerhof (PBE).59,60 The sampling in the Brillouin zone was performed on a grid of k-points separated by 0.5 Å−1 for the geometry optimizations and 0.2 Å−1 for the DOS and STM calculations. The standard functionals in DFT calculations such as B3LYP lack the important dispersion effects which are essential to the modeling of weak interactions. To improve the accuracy of DFT calculations Grimme et al.61 proposed to introduce an empirical correction of dispersion contribution to the standard density functionals (denoted as DFT-D); using this strategy, the estimation of noncovalent interactions can be computed very accurately at the DFT level. All the computations reported in this paper are performed using the dispersion-including DFT Grimme D2 method, as implemented in VASP 5.2.11.DFT-D2 Grimme (G, D2). This method describes the dispersion interactions between a particle and its neighbors in a given radius, via a simple pair-wise force field summed to the pure DFT energy.| ΔE = EDFT + ED2 | (1) |
3.2. Models
The building procedure of the two dimensional molecular networks is the one established by Kantorovich et al.37 The technique consists in: (1) identifying for the isolated molecule, all sites that establish hydrogen bonds to determine the set of dimers; (2) identifying for each dimer all the sites that can establish hydrogen bonds to construct the tetramers. (3) Identifying H-bond sites on the tetramers to build the 2D networks with two or four molecules per unit cell.Several phases of networks have more than two molecules per unit cell. The procedure explained above has been then used starting from different complexes (trimer, tetramer) to build supramolecular networks containing more than two molecules per unit cell. The obtained molecular oligomers will help to build 1D chains which form the basis of the 2D networks.
To the best of our knowledge, the most complete study was carried out for melamine and showed a wide variety of phases, despite its high symmetry, which significantly reduced the number of configurations. Other studies carried out on molecules with an even higher symmetry such as PTCDA and PTCDI,38 confirm the same trend as for melamine.
These studies show that the phase stability depends on the relative orientation of the building blocks. In other words, the cohesion energy of a phase can be evaluated as the sum of the cohesion energies of different dimers that compose it. This result is used to find the most stable NTCDI networks, which are those observed at the solid–liquid interface. This procedure is found to be successful in order to obtain geometries in close agreement with experimentally observed STM images. The geometries obtained are then used to calculate their electronic properties.
In this context we first study the complexes formed by two (dimer) or four (tetramers) molecules. In a first part, the topology and energetic of theses complexes is discussed as well as the properties of the most stable assemblies on the surface.
The substrate is modeled as a slab, where a unit cell is periodically reproduced in the 3D space. In this approach the surface is infinite in two dimensions (in x and y directions), with a vacuum space in the z axis direction. This vacuum space should be enough to enable the NTCDI adsorption and disable its interaction with the consecutive repetition of the system. The vacuum layer is about 15 Å. In the present case, a slab representing a (111) surface was cut out of the bulk face centered cubic cell of gold using Modelview software.62 The bulk optimized cell parameter a at the PBE level was found to be equal to 4.164 Å, being in good agreement with experiment (4.078 Å).63 For the slab the unit cell parameter a = 2.94 Å.
NTCDI molecular assemblies are modeled in gas phase and on the Au surface in dimer, tetramer and monolayer configurations (see Fig. 1–4). In the particular case of the dimers, the calculations on the gold surface were performed using a slab with two layers of gold (due to the size of the unit cell and the computing power available), in which the bottom layer atoms were fixed in the bulk geometry, while the upper layer atoms were all set free to relax. The lateral dimensions of the unit cells were in all cases chosen such that the interactions between images of adsorbed molecules are negligible: a 9 × 7 gold supercell (63 atoms in each layer) was used. Next, a single NTCDI molecule or dimer was placed at random positions at a distance of 3.0–3.5 Å parallel to the surface.
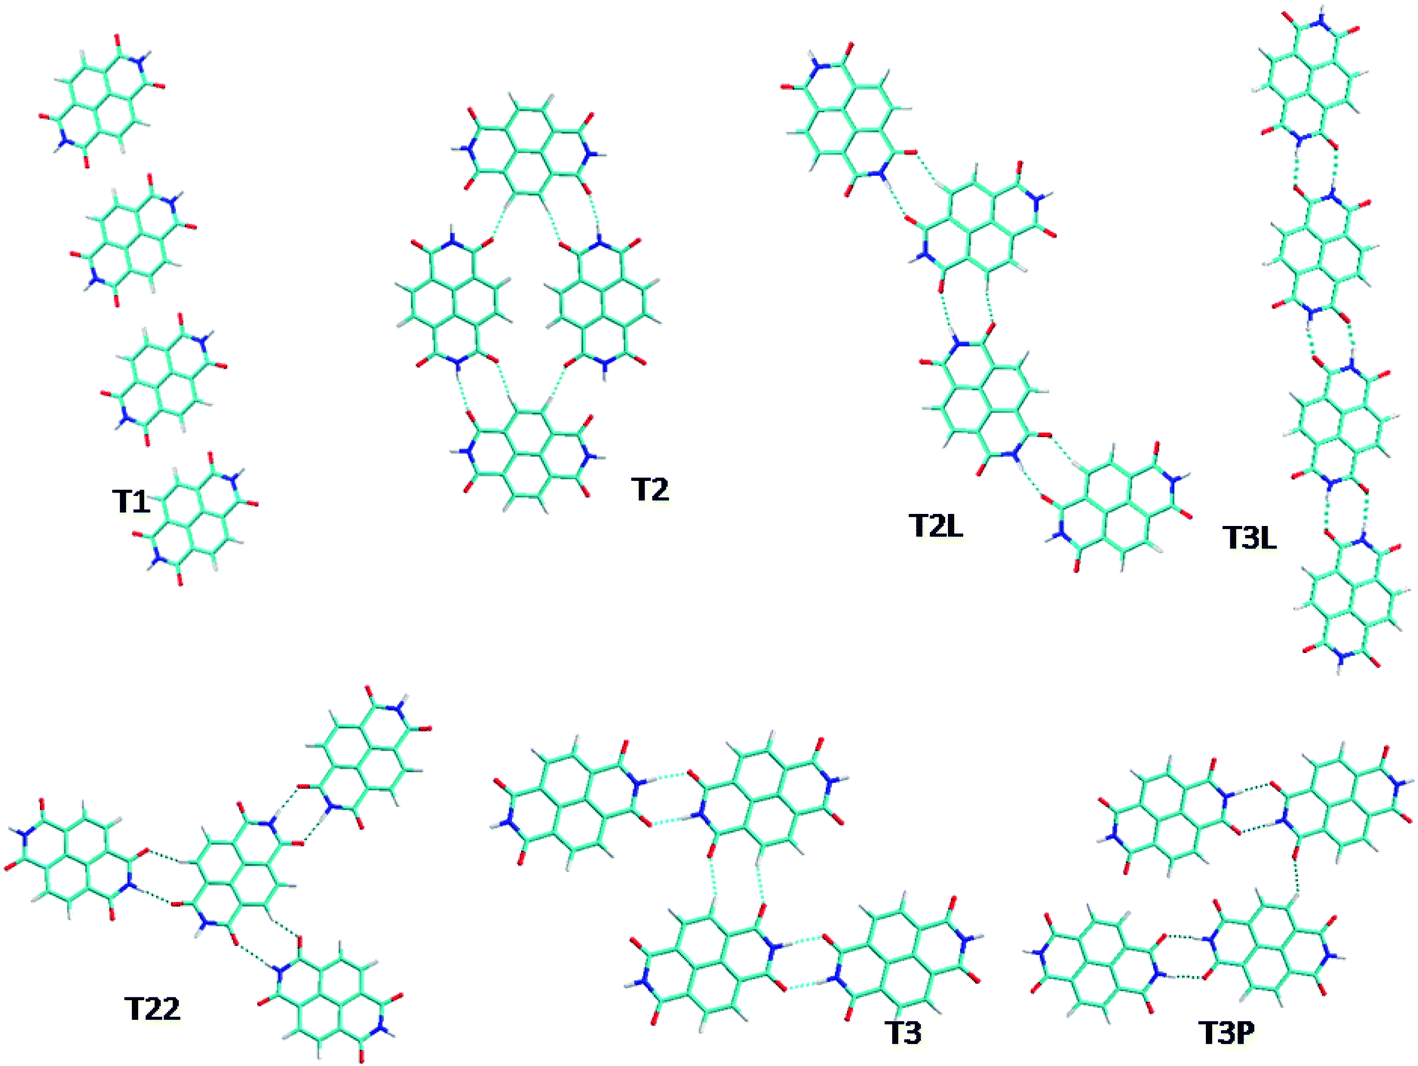 | ||
| Fig. 2 The different optimized NTCDI tetramer structures studied. | ||
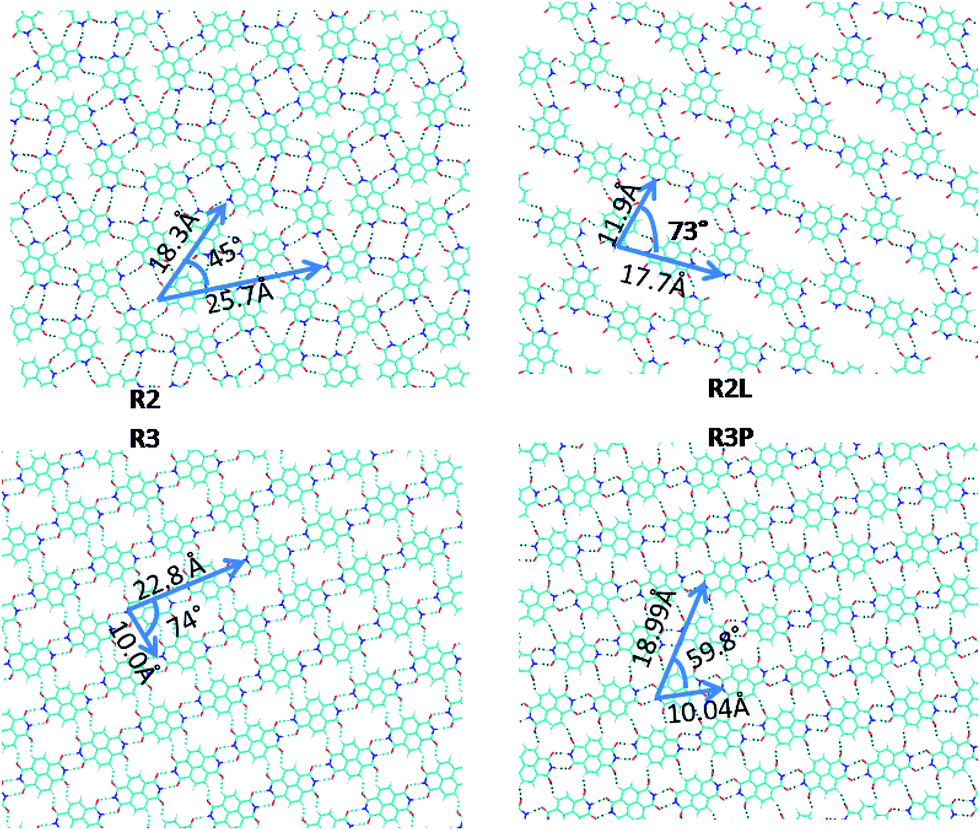 | ||
| Fig. 3 The different optimized supra-molecular NTCDI network studied. | ||
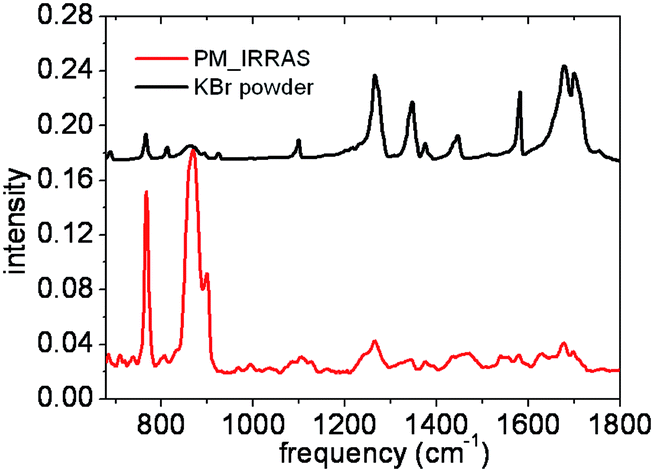 | ||
| Fig. 4 NTCDI bulk IR KBr pellet spectrum (top) and NTCDI experimental PM-IRRAS spectrum in a monolayer on Au(111) (bottom). | ||
The lattice of the most stable network R3P (see Fig. 3) was deposited on Au(111) and relaxed to optimize all atomic positions and lattices parameters. Optimizations was performed using a slab with two layers of gold, in which the bottom layer atoms were fixed in the bulk geometry, while the upper layer atoms were all set free to relax. A (7 × 4) gold supercell (28 atoms in each layer) was used. The missing fit between network and corresponding surface unit supercell is ± 3% and 8% for parameters a and b respectively. The lattice gamma angle is quasi equal to the experimental on Au(111) surface (60°).
Starting from the different dimer and tetramer molecular complexes in the gas phase, the most stable 2D supra-molecular networks were built by translation of repeating units in the two-dimensional space. The most stable topologies were retained for their use in the study of their interaction with the metal surface. The adsorption energy, which is also a measure of stability of the self-assembled monolayer, can be decomposed in binding energy and cohesion energy. The energies of adsorption (ΔEads) are calculated as follows:
 | (2) |
 | (3) |
| ΔEbind = ΔEads − ΔEcoh | (4) |
Vibrational spectra have been calculated within the harmonic approximation. All atoms are considered in the Hessian matrix. This matrix is computed by the finite difference method followed by a diagonalization procedure. The eigenvalues of the resulting matrix lead to the frequency values. The assignment of the vibrational modes is done by inspection of the corresponding eigenvectors. Intensities were calculated using density functional perturbation theory (DFPT). The DFPT linear response allows obtaining the matrix of Born effective charges (BEC), which refers to change of atoms' polarizabilities w.r.t. an external electric field. The BEC tensor is a key to calculate the vibrational intensities using the method developed by Giannozzi and Baroni64–66 and implemented in VASP.67
The electronic properties such as the density of states (DOS) and theoretical STM images are calculated performing a single-point calculation at higher precision than the geometry optimization calculations. The simulations of the STM images using the Tersoff–Hamann approximation68 give useful information to interpret and understand the experimental data.
4. Results and discussion
In order to evaluate the capability of the NTCDI to form supramolecular network through H-bonds we first study the complexes structures formed with two or four molecules of NTCDI.4.1. From a single molecule to dimers, tetramers and supramolecular networks
![[double bond, length as m-dash]](https://www.rsc.org/images/entities/char_e001.gif) C groups (1.85 Å) and another via the C–H⋯OC groups (2.16 Å). It's comparable to PTCDI D2 structure38 which have a cohesive energy of −0.12 eV per molecule. The third dimer conformation is very weakly bound (−0.08 eV per molecule) and similar to the PTCDI D1 and D5 for which cohesive energies are found to −0.075 and −0.07 eV, respectively.38 Only two weak hydrogen bonds (C–H⋯OC) are found in this complex. Dispersion accounts for 0.05 eV per molecule, in the three configurations. This represents 17% to 38% of the cohesion energy, depending on the dimer configuration.
C groups (1.85 Å) and another via the C–H⋯OC groups (2.16 Å). It's comparable to PTCDI D2 structure38 which have a cohesive energy of −0.12 eV per molecule. The third dimer conformation is very weakly bound (−0.08 eV per molecule) and similar to the PTCDI D1 and D5 for which cohesive energies are found to −0.075 and −0.07 eV, respectively.38 Only two weak hydrogen bonds (C–H⋯OC) are found in this complex. Dispersion accounts for 0.05 eV per molecule, in the three configurations. This represents 17% to 38% of the cohesion energy, depending on the dimer configuration.
From the dimer configurations, tetramers were built considering hydrogen bond interactions in all directions. The seven most stable geometries are presented in Fig. 2. The most stable configuration T3L can be seen as a linear association of two D3 dimers. The distance between molecules decreases slightly of about 0.01 Å. The second stableT3Pconfiguration can be seen as the association of dimers D3 and D1. In addition to the strong H-bond interactions between both monomers also observed in the isolated dimers, a short C–H⋯O–C distance is observed making the link between two D3 dimers. The cohesive energy of the T3P tetramer is evaluated as being exactly the sum ΔEcoh of D1 and D3 dimers (−0.42 eV per molecule).
T3 and T3P are geometrically similar except that in the case of T3P, one dimer in the unit cell contains one molecule which is tilted with respect to short axis of the NTCDI molecule, leading to stronger lateral interactions between the individual NTCDI molecules (see Fig. 2), as can be seen from the dNH⋯O and dCH⋯O distances in Table 2.
| Configuration | T2 | T2L | T3 | T3P | T3L | T1 | T22 |
|---|---|---|---|---|---|---|---|
| ΔEcoh | −0.31 | −0.26 | −0.37 | −0.42 | −0.59 | −0.20 | −0.31 |
| ΔEcoh (eval.) | −0.32 | −0.28 | −0.36 | −0.42 | −0.58 | −0.20 | −0.33 |
| dNH⋯O | 2.12 | 1.95 | 1.82 | 1.77 | 1.77 | — | 1.75 |
| dCH⋯O | — | 2.08 | 2.05 | 2.13 | — | 2.33 | 2.10 |
T2, T22 and T2L can be seen as an association of two D2 dimers in different ways. They are about 0.10 eV per molecule less stable than T3L tetramer, this gain in stability with respect to the dimer can be explained by the stronger interaction between CH and OC groups, as evidenced by the hydrogen bond length decrease. The cohesive energy per molecule is calculated between −0.31 and −0.27 eV much lower than for the D2 dimer suggesting a stronger interaction between the molecules. The less stable configuration T1 is a linear association of two D1 complexes.
In conclusion the most stable tetramers are formed by pairs of dimers, meaning that the unit cell of the supramolecular network is formed by the most stable dimer containing unit cells.
From single chain models, monolayer assemblies were built. Only the most stable ones are presented in this work (Fig. 3). R3P is the association of tetramers T3P (D3 and D1 dimers) in the plane. This arrangement is found very similar to the monolayer based on PTCDI dimer named MON8 in the ref. 38. In the literature, the cohesive energy for this PTCDI configuration is found to be −0.77 (ref. 38) and −0.89 (ref. 40) eV per molecule. This canted phase was observed experimentally for PTCDI adsorbed on Au(111) in the later paper and also for NTCDI49 on Ag/Si(111)- surface. The calculated lateral distance (10.04 Å) is close to experimental49 one (9.99 Å). R3 being the result of the association of D1 and D3 dimers or T3 tetramers, is less stable by 0.3 eV. R3 is experimentally hardly distinguishable from R3P (Table 3).20,46 It should be noted that the conclusions drawn in these references are based on calculations exploring only one tetramer structure excluding dispersion interactions. In the present study we include additionally fully optimized unit cell configurations in order to explore the largest range possible of geometries and unit cell combinations. The density of molecules is more important R3P than R3 in agreement of the difference of cohesive energy.
| Configuration | R2 | R2L | R3 | R3P |
|---|---|---|---|---|
| ΔEcoh | −0.57 | −0.38 | −0.79 | −0.86 |
| ΔEcoh (eval.) | −0.30 | −0.21 | −0.34 | −0.32 |
| dNH⋯O | 1.92 | 1.90 | 1.67 | 1.70 |
| dCH⋯O | 1.96 | 1.93 | 2.14 | 2.09 |
The lattice parameters of the most stable networks are reported in Fig. 3. Comparing these to Au(111) parameters, one can see that the R3P lattice gamma angle is better closed to surface one (60°) in contrast to R3. In the next, we deposit R3P on the surface to study the system in full periodic conditions.
R2L, a porous structure, being a non linear association of D2 dimers is 0.4 eV less stable than then R3P assembly. It is roughly comparable to PTCDI MON1 and MON2 structures which cohesive energy was found to −0.31 and −0.48 eV per molecule,38 respectively. Within in the same family, R2 and R2L are formed by D2 dimers association. The density of molecule is more important in R2 than R2L. In contrast to the other structures, which contain two molecules per unit cell, R2 has four molecules per unit cell, and is not further discussed here.
| Configuration | ΔEcoh | ΔEads | ΔEbind | dM⋯surface | dNH⋯O | dCH⋯O |
|---|---|---|---|---|---|---|
| Monomer | 0 | 0.04 | 0.04 | 3.30 | — | — |
| D1 | −0.13 | −0.06 | 0.07 | 3.35 | — | 2.30 |
| D2 | −0.19 | −0.16 | 0.03 | 3.40 | 1.84 | 2.21 |
| D3 | −0.29 | −0.23 | 0.06 | 3.40 | 1.78 | — |
| R3P | −0.86 | −1.66 | −0.80 | 3.32 | 2.85 | 2.64 |
Concerning the monolayer assemblies or networks exothermic cohesion and binding energies are calculated contributing both to the adsorption of the network. The cohesion energy stays the dominant contribution in the overall adsorption energy. The R3P network is adsorbed with energy of −0.80 eV per molecule.
The geometries after the relaxation show that the molecules are slightly deformed (about 0.2 Å) and lay to the surface itself slightly distorted of 0.07, 0.12 and 0.030 Å for monomer, dimer D3 and R3P network respectively. For the dimers, the molecular layer is position at a distance of about 3.4 Å (see Table 4). The experimentally measured layer-surface distance70 for NTCDI on the Au(111) surface is 3.27 Å. The binding energies, shown in the same table, are very weak, i.e. 0.1 to 0.2 eV, for the monomers as well as for the dimers.
For the sake of comparison the calculated adsorption energy for molecular PTCDA and NTCDA on Au(111) surface was found in the range +0.17–0.18 eV.36 The most favorable adsorption configuration is also found with the center of the cycle in hollow position. The adsorbed molecule remains planar and consequently the deformation energy is almost zero. This weak interaction is in line with the distance (experimental = 3.27 Å)70 between the molecule and the surface, which can be approximated by the sum of the van der Waals radii. Another example of similar adsorption behavior of molecular PTCDI is on Ag(111) surface. The adsorption energy is found to be equal to 0.38 eV (ref. 70) for the same adsorption geometry as described above. A charge transfer from Ag surface to the LUMO of PTCDI corresponding to a transfer of 0.9e− is observed The most stable R3P and R3 molecular networks on Au(111) have been observed in different experiments and show very similar geometrical behavior.47,49 In the most favorable configuration R3P, the center of the cycle is in hollow position. The network layer-surface distance reaches 3.32 Å (sum of gold and carbon atomic van der Waals radii) in a good agreement with experimental observations70 confirming the cohesive nature of the stabilization.
5. InfraRed spectroscopy analysis
In order to probe the interaction between the NTCDI molecules at a macroscopic scale, we have recorded IR spectra both of the monolayer and of the powder. The Fig. 4 shows the IR experimental spectra of the NTCDI molecules either in a monolayer on Au(111) at grazing incidence (PM-IRRAS) or in powder using KBr pellets. The intensities of out of plane vibrations in the monolayer are enhanced relatively to the others ones in plane. Relying on the selection rules on metallic substrates of PM-IRRAS, we deduced that the molecule lays parallel to the substrate. Apart from this difference the bands are almost located at the same wave numbers (±1 cm−1). We can deduce first that the adsorption on Au(111) changes very little the NTCDI vibrations. Secondly, let us remind that all the molecular planes in the NTCDI crystal are parallel and that the main intermolecular interactions by H-bonding occur between coplanar molecules.49 Thereby, we expect the same IR spectrum for the single coplanar molecules as in the monolayer and in the bulk. As the bands are better resolved in the spectrum of isotropic compound (for the in plane modes), we have considered the latter for the comparison with the calculated spectra.The experimental spectrum shows three bands between 2800 and 3200 cm−1 (region of CH and NH stretching), (see Fig. 5 and Table 5). The region between 700 and 1800 cm−1 presents many peaks. It includes elongations of CO bonds, observed by the typical double bands around 1700 cm−1, as well as various C–H, N–H and perylene ring vibration modes (below 1600 cm−1).
 | ||
| Fig. 5 Comparison between the experimental (KBr) spectrum and the simulated IR spectra of the monomer, R2L, R3, and R3P structures. | ||
| Calculated | Experimental | Assignment | ||
|---|---|---|---|---|
| monomer | R3P | R2L | KBr | |
| 3480 (0.145) | 3476 (0.061) | νNH free | ||
| 3348 (0.013) | νNH weakly linked | |||
| 2934 (1.0) | 3229 (0.98) | 3073 | νNH linked | |
| 3119 (0.001) | 3156 (0.027) | 3107 (0.320) | 3175 | νCH |
| 2894 (0.017) | 2860 | νNH anti-sym. | ||
| 1714 (0.983) | 1677 (0.196) | 1731 (0.104) | 1700 | νCO sym. |
| 1687 (0.384) | ||||
| 1701 (0.575) | 1650 (0.278) | 1687 (0.98) | 1677 | νCO anti-sym. |
| 1567 (0.186) | 1566 (0.124) | 1617 (0.013) | 1581 | νring |
| 1508 (0.014) | 1509 (0.005) | 1597 (0.065) | 1510 | νring + δCH |
| 1417 (0.182) | 1431 (0.043) | 1567 (0.111) | 1447 | νring + δCH |
| 1431 (0.041) | ||||
| 1362 (0.011) | 1362 (0.004) | δNH free | ||
| 1475 (0.006) | 1419 (0.012) | 1437 | δNH linked | |
| 1300 (0.81) | 1325 (0.124) | 1322 (0.075) | 1375 | δCH + δring + νCN |
| 1262 (0.185) | 1285 (0.171) | 1273 (0.135) | 1347 | νring + νCN |
| 1172 (0.053) | 1202 (0.005) | 1198 (0.001) | 1265 | δCH+ring umbrella |
| 1093 (0.049) | 1111 (0.027) | 1016 (0.025) | 1099 | δCH + νring + νCN |
| 902 (0.003) | 932 (0.001) | 915 (0.006) | 925 | δCH + δring |
| 875 (0.010) | 898 (0.003) | 897 (0.010) | 890 | γCH + γring |
| 805 (0.012) | 804 (0.010) | 809 (0.027) | 812 | δring |
| 759 (0.101) | 760 (0.005) | 759 (0.015) | 765 | γNH + γCH + γring |
| 710 (0.057) | 990 (0.010) | 783 (0.036) | 864 | γNH free |
| 872 (0.020) | ||||
For the monomer in vacuum, the calculated spectrum shows a band at 3480 cm−1 for NH free stretching (νNH) and very weak CH stretching (νCH) band at 3120 cm−1. At lower frequencies, a large band around 1710 cm−1, corresponding to CO bond vibrations(νCO), composed of both symmetric (1714 cm−1) and anti-symmetric (1701 cm−1) modes in an agreement with ref. 71. The bands localized between 1380 and 1600 cm−1 correspond to perylene ring stretching (δring) coupled to NH (δNH), and CH (δCH) in plane bending modes. A clear NH in plane mode is located at 1362 cm−1. In other hands the NH in plane bending mode was found at 1368 cm−1 in PTCDI molecules.72 The intense peak at 1300 cm−1 and shoulder correspond to modes that couple the NH stretching and perylène ring and CH in plane bending (δNH + δCH + δring). These bands (νCO, νring, δNH and δCH) are roughly in the same position as in dimeric naphthalene diimides FT-IR spectrum.73 The peaks, between 900 and 1190 cm−1, correspond to CH and perylene-ring (δCH + δring) in plane bending modes. As expected, several out of plane modes are observed in the 700–900 cm−1 region. The following bands are observed: an out of plane γCH vibration at 875 cm−1, coupled γCH, γNH and γring out of plane bending modes at 759 cm−1,and another one γNH out of plane bending mode at 710 cm−1,and one γring out of plane modes at 805 and 738 cm−1.
After formation of 2D networks new characteristic bands emerge. This is due to the presence of intermolecular H-bonds between CO⋯HN and CO⋯H-perylene. It has been shown that H-bonds red-shift the stretching modes and blue-shift the bending modes.41,74–76The bounded NH stretch appears at 2934 cm−1 (in R3P phase for example) and becomes more intense due to an increased electronic polarization.41,77 In R3P phase, a new NH anti symmetric stretching mode (due to the two interacting NH of the two molecules in unit cell) appears at 2894 cm−1 with a weak intensity. In this region, one observes an aromatic CH stretching mode around 3150 cm−1 due to their implication in lateral inter molecular H-bonds between CO⋯H-perylene groups as observed in ref. 72, 73 and 78.
The NH in plane bending mode shifts from 1362 to 1475 cm−1 for R3P and 1419 for R2L. More importantly, the NH out of plane shifts from 710 to 990 cm−1 for R3P and 872 cm−1 for R2L. The CO symmetric and anti-symmetric bands shift to 1690 and 1677 cm−1, respectively, and become coupled to NH bend at 1650 cm−1. Kaake et al. measure ATR-IR spectrum of PTCDI film and found the CO symmetric and asymmetric bands at 1696 and 1655 cm−1, respectively.78 Measuring NTCDI films FT-IR spectrum, Burtman et al.30 observed an important shift from 1779 to 1655 cm−1 for νCO. These observations are in a good agreement with recent results obtained for PTCDI molecules by DFT calculations at B3LYP/6-31G* level.72 CH and the ring bending modes are not significantly affected by hydrogen bonds.
Looking at the R2L structure, one can observe a strong CO⋯H-perylene (1.93 Å) and a weak one (2.18 Å). Similarly, a strong NH⋯OC (1.90 Å) and weak one (2.32 Å) H-bond, can be observed. Free NH, weakly linked NH, linked NH and CH stretching modes can be observed in the high frequency regions located at 3476, 3366, 3229, 3131 cm−1, respectively. Comparing the R2L 2D network spectrum with the experimental spectrum in this region (see Fig. 5), a significant gap between theoretical and experimental bands is observed. Also, the spectrum shows a band corresponding to free NH that does not exist in the experimental spectrum. No peaks in the region below 3400 cm−1, nor free CO modes around 1731 cm−1 are observed in the experimental spectrum. This enables us to conclude that this phase is hardly present on the surface, which is in agreement with the experimental STM images.
The spectra for the R3P and R3 networks are very similar, except for CH, NH and CO stretching modes for which relative important shifts are observed. These shifts are linked to the structure of these phases. Hydrogen bond distances between CH⋯OC and NH⋯OC are 2.09 Å (R3P) and 2.14 Å (R3), and 1.70 Å (R3P) and 1.67 Å (R3), respectively. In R3P network, hydrogen bonds between aromatic CH and CO are more important than in the R3 network, and the linear NH⋯OC hydrogen bonds are weaker (see Fig. 3). This results in a large red shift for the R3 network compared with the R3P network of 60 and 10 cm−1 for the NH and CO stretching modes, respectively. At the contrary, the aromatic CH stretch shifts 20 cm−1 in the spectrum of R3P network, compared with the R3 network. The simulated spectra are very similar to experimental one notably in the high number wave range where the non interacting bond vibrations are present. They are also in a good agreement in the range of 700–1800 cm−1. One can conclude that these two phases are dominant on the studied surface. Another point is the effect on the spectrum induced on the gas phase network by its interaction with the surface. Due to the commensurability between the network and the surface structure which was discussed above no spectra were simulated.
6. Electronic analysis; simulation of STM images
From the relaxed structures, STM images were simulated using Tersoff–Hamann approximation.68 The same bias voltage as in our experiments was used (−1000 and 300 meV). In Fig. 6a, the experimental STM images, realized in ambient conditions with a constant current set to 50 pA, and theoretical images are compared.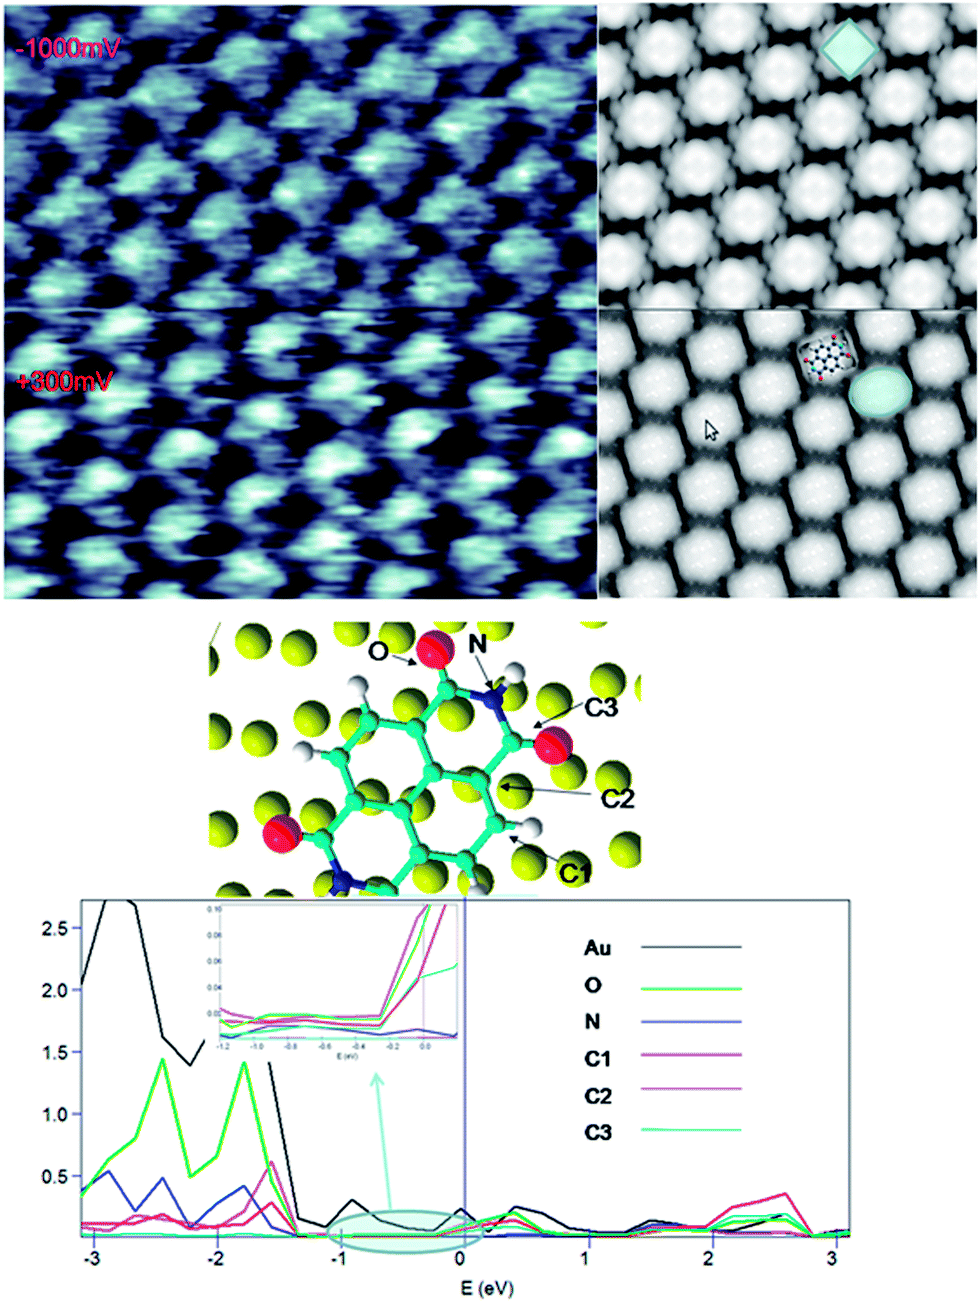 | ||
| Fig. 6 Experimental and simulated STM images at +300 and −1000 mV (top) and Projected density of states of Au (atom above oxygen atom) d orbital and p orbital for the C1, C2, C3, O and N named atoms (bottom). | ||
At positive bias voltage (300 mV), molecules appear as ellipsoids while they appear as squares for negative voltage (−1000 mV). There exists dependence between the form of molecular spot and the applied bias voltage because of the density of states behavior and the atomic position of adsorbed system. For example, recent STM images at different bias voltages for planar terephtalic acid molecules show a circular and ellipsoidal spots at positive and negative voltages, respectively.79 To understand STM images behavior, the density of states (PDOS) on the optimized assembly was calculated. In Fig. 6, the projected density of states on the p orbital is shown for oxygen, nitrogen and carbons, labeled C1, C2 and C3.The d orbital of the Au atom below oxygen is presented (black). Regarding the STM images and analyzing the projected DOS on the atoms (see Fig. 6) one can observe that only the perylene ring carbon and oxygen orbital are visible. Between 0 and 300 mV, all C1, C2 and C3 carbon and oxygen atoms have approximately the same. For this reason, NTCDI molecules spot appear with an ellipsoidal shape. In contrast, the PDOS of C3 decreases to zero at negative bias (0–1000 mV). Moreover, the oxygen PDOS decreases compared to C2 or C1 near the Fermi level. The PDOS of C2 and C1 are dominant and generate square shaped spots. Beyond −1 V, The PDOS of C3 increases as well as for the oxygen, C2 and C1, implying that the observed spot recovers an ellipsoidal shape in agreement with previous experimental observations by Ruiz-Osés et al.47 at −1.6 V and Keeling et al.49 at −3 V.
7. Conclusion
NTCDI molecular networks formed on Au(111) were investigated at first principle level using periodic DFT and experimental STM analysis. It was found that the individual NTCDI molecules are not adsorbed on Au(111) surface. The molecules are favorably adsorbed only when they form aggregates containing a couple of molecules until the complete covering of the surface. The molecular network formed after the completion of a monolayer is nevertheless exothermally adsorbed in contrast with the individual molecules. This behavior is explained by the strong intermolecular cohesion interactions, which are shown to be the dominant part (75%) in the adsorption energy. The weak binding energy and the monolayer-surface distance reaching 3.32 Å might lead to the mobility of the NTCDI network. Because of the strong inter molecular H-bond formation, the relative geometries of the individual molecules are practically laying parallel to the surface and tend to organized them in such an orientation to optimize the H-bond geometry. The presence of H-bonds is the critical parameter for the stability and geometry of the network.Energetic studies show a better stability for R3 and R3P networks formed by the most stable dimmers. R3P network has a higher molecules density, and more stable than R3. Also the lattice parameters are better closed to surface ones. The calculation of the vibrational frequencies, seems to indicate the presence of R3 and R3P geometries for the adsorbed monolayer network on the Au(111) surface. The different adsorption bands of the spectrum could have been assigned. Experimental STM images as function of the bias voltage were successfully reproduced using the Tersoff–Hamann approximation on the DFT/PBE obtained electron densities. This study showed that the combination of experience and theory suit an attractive approach for the characterization of complex materials at both large and limited scale. Structural information's and electronic properties are accessible and provide to the parameters which guide the formation of supramolecular networks. Earlier studies carried out on the same host homomolecular system could be extended to the porous heteromolecular one. This lead to the study of the complex of host and guest molecule placed in the pore in order to understand charge transfer between them by using of density of states and STM images analysis.
Acknowledgements
This work was performed using HPC resources from GENCI – [CCRT/CINES/IDRIS] (Grant 2013-[c2013097006]). We acknowledge the financial support from the French Government's Investissements d'Avenir program: Laboratoire d'Excellence ‘Sciences and Engineering for Advanced Materials and devices – SEAMs’ (grant no. ANR-10-LABX-96).References
- J. V. Barth, G. Costantini and K. Kern, Nature, 2005, 437, 671–679 CrossRef CAS PubMed.
- R. Otero, F. Rosei and F. Besenbacher, Annu. Rev. Phys. Chem., 2006, 57, 497–525 CrossRef CAS PubMed.
- J. C. Love, L. A. Estroff, J. K. Kriebel, R. G. Nuzzo and G. M. Whitesides, Chem. Rev., 2005, 105, 1103–1169 CrossRef CAS PubMed.
- B. Choi, J. Rhee and H. H. Lee, Appl. Phys. Lett., 2001, 79, 2109–2111 CrossRef CAS PubMed.
- B. H. Hamadani, D. A. Corley, J. W. Ciszek, J. M. Tour and D. Natelson, Nano Lett., 2006, 6, 1303–1306 CrossRef CAS PubMed.
- S. I. Stupp, V. LeBonheur, K. Walker, L. S. Li, K. E. Huggins, M. Keser and A. Amstutz, Science, 1997, 276, 5311 CrossRef.
- J.-M. Lehn, Science, 2002, 295, 2400–2403 CrossRef CAS PubMed.
- G. M. Whitesides and B. Grzybowski, Science, 2002, 295, 2418–2421 CrossRef CAS PubMed.
- S. Furukawa, K. Tahara, F. C. De Schryver, M. Van der Auweraer, Y. Tobe and S. De Feyter, Angew. Chem., Int. Ed., 2007, 46, 2831–2834 CrossRef CAS PubMed.
- S. Stepanow, M. Lingenfelder, A. Dmitriev, H. Spillmann, E. Delvigne, N. Lin, X. Deng, C. Cai, J. V. Barth and K. Kern, Nat. Mater., 2004, 3, 229–233 CrossRef CAS PubMed.
- J. A. Theobald, N. S. Oxtoby, M. A. Phillips, N. R. Champness and P. H. Beton, Nature, 2003, 424, 1029–1031 CrossRef CAS PubMed.
- E. Mena-Osteritz and P. Bäuerle, Adv. Mater., 2006, 18, 447–451 CrossRef CAS.
- K. L. Copeland and G. S. Tschumper, J. Chem. Theory Comput., 2012, 8, 4279–4284 CrossRef CAS.
- K. S. Kim, P. Tarakeshwar and J. Y. Lee, Chem. Rev., 2000, 100, 4145–4186 CrossRef CAS PubMed.
- F. J. M. Hoeben, P. Jonkheijm, E. W. Meijer and A. P. H. J. Schenning, Chem. Rev., 2005, 105, 1491–1546 CrossRef CAS PubMed.
- Y. Yao, W. Shen, B. Nohra, C. Lescop and R. Réau, Chem.–Eur. J., 2010, 16, 7143–7163 CrossRef CAS PubMed.
- L. Brunsveld, B. J. B. Folmer, E. W. Meijer and R. P. Sijbesma, Chem. Rev., 2001, 101, 4071–4098 CrossRef CAS PubMed.
- O. Takahashi, Y. Kohno and M. Nishio, Chem. Rev., 2010, 110, 6049–6076 CrossRef CAS PubMed.
- M. Meot-Ner, Chem. Rev., 2005, 105, 213–284 CrossRef CAS.
- J. Teyssandier, N. Battaglini, M. Seydou, G. Anquetin, B. Diawara, X. Sun, F. Maurel and P. Lang, J. Phys. Chem. C, 2013, 117, 8737–8745 CAS.
- R. Madueno, R. Madueno, M. T. Räisänen, C. Silien and M. Buck, Nature, 2008, 454, 618–621 CrossRef CAS PubMed.
- C.-A. Palma, J. Bjork, M. Bonini, M. S. Dyer, A. Llanes-Pallas, D. Bonifazi, M. Persson and P. Samorì, J. Am. Chem. Soc., 2009, 131, 13062–13071 CrossRef CAS PubMed.
- S. M. Barlow and R. Raval, Surf. Sci. Rep., 2003, 50, 201–341 CrossRef CAS.
- C. T. Seto and G. M. Whitesides, J. Am. Chem. Soc., 1990, 112, 6409 CrossRef CAS.
- C. T. Seto and G. M. Whitesides, J. Am. Chem. Soc., 1993, 115, 905 CrossRef CAS.
- A. Ranganathan, V. R. Pedireddi and C. N. R. Rao, J. Am. Chem. Soc., 1999, 121, 1752 CrossRef CAS.
- N. Battaglini, Z. Qin, P. Campiglio, V. Repain, C. Chacon, S. Rousset and P. Lang, Langmuir, 2012, 28, 15095–15105 CrossRef CAS PubMed.
- A. J. A. Kronemeijer, B. Hylke, T. Kudernac, B. J. van Wees, B. L. Feringa, P. W. M. Blom and B. de Boer, Adv. Mater., 2008, 20, 1467–1473 CrossRef CAS.
- P. Stoliar, R. Kshirsagar, M. Massi, P. Annibale, C. Albonetti, D. M. de Leeuw and F. Biscarini, J. Am. Chem. Soc., 2007, 129, 6477–6484 CrossRef CAS PubMed.
- V. Burtman, A. Zelichonok and A. V. Pakoulev, Int. J. Mol. Sci., 2011, 12, 173–225 CrossRef CAS PubMed.
- F. Tielens, V. Humblot and C.-M. Pradier, Surf. Sci., 2008, 602, 1032–1039 CrossRef CAS PubMed.
- F. Tielens, V. Humblot, C. M. Pradier, M. Calatayud and F. Illas, Langmuir, 2009, 25, 9980–9985 CrossRef CAS PubMed.
- V. Humblot, C. Methivier, R. Raval and C.-M. Pradier, Surf. Sci., 2007, 601, 4189–4194 CrossRef CAS PubMed.
- V. Humblot, A. Vallee, A. Naitabdi, F. Tielens and C. M. Pradier, J. Am. Chem. Soc., 2012, 134, 6579–6583 CrossRef CAS PubMed.
- I. Tranca, M. Smerieri, L. Savio, L. Vattuone, D. Costa and F. Tielens, Langmuir, 2013, 29, 7876 CrossRef CAS PubMed.
- M. Mura, A. Gulans, T. Thonhauser and L. Kantorovich, Phys. Chem. Chem. Phys., 2010, 12, 4759–4767 RSC.
- M. Mura, N. Martsinovich and L. Kantorovich, Nanotechnology, 2008, 19, 465704 CrossRef CAS PubMed.
- M. Mura, F. Silly, G. A. D. Briggs, M. R. Castell and L. N. Kantorovich, J. Phys. Chem. C, 2009, 113, 21840–21848 CAS.
- M. Mura, X. Sun, F. Silly, H. T. Jonkman, G. A. D. Briggs, M. R. Castell and L. N. Kantorovich, Phys. Rev. B: Condens. Matter Mater. Phys., 2010, 81, 195412 CrossRef.
- M. Sassi, V. Oison and J. M. Debierre, Surf. Sci., 2008, 602, 2856–2862 CrossRef CAS PubMed.
- G. G. Mahamadou Seydou, J. Liquier, J. Lemaire, J. Pierre Schermann and C. Desfrançois, J. Am. Chem. Soc., 2008, 130, 4187–4195 CrossRef PubMed.
- M. Mura, F. Silly, V. Burlakov, M. R. Castell, G. A. D. Briggs and L. N. Kantorovich, Phys. Rev. Lett., 2012, 108, 176103 CrossRef.
- Y. Wang, S. Fabris, G. Fratesi, R. Ferrando, T. Classen, K. Kern and G. Costantini, J. Phys. Chem. C, 2013, 117, 3440–3445 CAS.
- Y. Zhao and D. Truhlar, J. Chem. Theory Comput., 2005, 1, 415–432 CrossRef CAS.
- E. Rauls, S. Blankenburg and W. Schmidt, Surf. Sci., 2007, 601, 4045 CrossRef PubMed.
- R. E. A. Kelly, W. Xu, M. Lukas, R. Otero, M. Mura, Y. J. Lee, E. Laegsgaard, I. Stensgaard, L. N. Kantorovich and F. Besenbacher, Small, 2008, 4, 1494–1500 CrossRef CAS PubMed.
- M. Ruiz-Osés, N. Gonzalez-Lakunza, I. Sialnes, A. Gourdon, A. Arnau and J. E. Ortega, J. Phys. Chem. B, 2006, 110, 25575 CrossRef PubMed.
- M. Ruiz-Osés, T. Kampen, N. González-Lakunza, I. Silanes, P. M. Schmidt-Weber, A. Gourdon, A. Arnau, K. Horn and J. E. Ortega, ChemPhysChem, 2007, 8, 1722–1726 CrossRef PubMed.
- D. L. Keeling, N. S. Oxtoby, C. Wilson, M. J. Humphry, N. R. Champness and P. H. Beton, Nano Lett., 2003, 3, 9–12 CrossRef CAS.
- B. M. Trost, M. L. Crawley and C. B. Lee, J. Am. Chem. Soc., 2000, 122, 6120 CrossRef CAS.
- B. J. Jung, J. F. M. Hardigree, B. M. Dhar, H. J. Dawidczyk, J. Sun, K. C. See and H. E. Katz, ACS Nano, 2011, 5, 2723–2734 CrossRef CAS PubMed.
- C. Sotiriou-Leventis and Z. Mao, J. Heterocycl. Chem., 2000, 37, 1665–1667 CrossRef CAS.
- T. Buffeteau, B. Desbat and J. M. Turlet, Appl. Spectrosc., 1991, 45, 380 CrossRef CAS.
- I. Horcas, R. Fernandez, J. M. Gomez-Rodriguez, J. Colchero, J. Gomez-Herrero and A. M. Baro, Rev. Sci. Instrum., 2007, 78, 013705 CrossRef CAS PubMed.
- G. Kresse and J. Hafner, Phys. Rev. B: Condens. Matter Mater. Phys., 1993, 47, 558–561 CrossRef CAS.
- G. Kresse and J. Hafner, Phys. Rev. B: Condens. Matter Mater. Phys., 1994, 49, 14251–14269 CrossRef CAS.
- P. E. Blochl, Phys. Rev. B: Condens. Matter Mater. Phys., 1994, 50, 17953–17979 CrossRef.
- G. Kresse and D. Joubert, Phys. Rev. B: Condens. Matter Mater. Phys., 1999, 59, 1758–1775 CrossRef CAS.
- B. Hammer, L. B. Hansen and J. K. Norskov, Phys. Rev. B: Condens. Matter Mater. Phys., 1999, 59, 7413–7421 CrossRef.
- J. P. Perdew, K. Burke and M. Ernzerhof, Phys. Rev. Lett., 1997, 78, 1396–1396 CrossRef CAS.
- S. Grimme, J. Comput. Chem., 2006, 27, 1787–1799 CrossRef CAS PubMed.
- http://www.enscp.fr/labos/LPCS/MRS/Modelview.
- A. Maeland and T. B. Flanagan, Can. J. Phys., 1964, 42, 2364 CrossRef CAS.
- P. Giannozzi and S. Baroni, J. Chem. Phys., 1994, 100, 8537 CrossRef CAS PubMed.
- K. Esfarjani, Y. Hashi, J. Onoe, K. Takeuchi and Y. Kawazoe, Phys. Rev. B: Condens. Matter Mater. Phys., 1998, 57, 223 CrossRef CAS.
- S. Baroni, S. D. Gironcoli, A. D. Corso and P. Giannozzi, Rev. Mod. Phys., 2001, 73, 515 CrossRef CAS.
- D. Karhánek, T. Bučko and J. Hafner, J. Phys.: Condens. Matter, 2010, 22, 265006 CrossRef PubMed.
- J. Tersoff and D. R. Hamann, Phys. Rev. B: Condens. Matter Mater. Phys., 1985, 31, 805–813 CrossRef CAS.
- J. Wen and J. Ma, J. Phys. Chem. C, 2012, 116, 8523–8534 CAS.
- S. K. M. Henze, O. Bauer, T. L. Lee, M. Sokolowski and F. S. Tautz, Surf. Sci., 2007, 601, 1566–1573 CrossRef CAS PubMed.
- M. Sassi, V. Oison and J. M. Debierre, Surf. Sci., 2008, 602, 2856 CrossRef CAS PubMed.
- V. Chis, G. Mile, R. Stiufiuc, N. Leopold and M. Oltean, J. Mol. Struct., 2009, 924–926, 47–53 CrossRef CAS PubMed.
- D. Gudeika, R. Lygaitis, J. V. Gražulevičius, R. H. Kublickas, V. Rubežienė and J. Vedegyt&edot, chemija, 2012, 23, 233–238 CAS.
- L. Bondessona, K. V. Mikkelsenc, Y. Luoa, P. Garbergb and H. Ågrena, Spectrochim. Acta, Part A, 2007, 66, 213–224 CrossRef PubMed.
- K. Mizuno, Y. Miyashita, Y. Shindo and H. Ogawa, J. Phys. Chem., 1995, 99, 3225–3228 CrossRef CAS.
- C. Mihesan, M. Ziskind, C. Focsa, M. Seydou, F. Lecomte and J. P. Schermann, Int. J. Mass Spectrom., 2009, 277, 284–290 CrossRef PubMed.
- S. Baroni, S. de Gironcoli, A. Dal Corso and P. Giannozzi, Rev. Mod. Phys., 2001, 73, 515–562 CrossRef CAS.
- L. G. Kaake, Y. Zou, M. J. Panzer, C. D. Frisbie and X.-Y. Zhu, J. Am. Chem. Soc., 2007, 129, 7824–7830 CrossRef CAS PubMed.
- J. D. Fuhr, A. Carrera, N. Murillo-Quirós, L. J. Cristina, A. Cossaro, A. Verdini, L. Floreano, J. E. Gayone and H. Ascolani, J. Phys. Chem. C, 2013, 117, 12787–11296 Search PubMed.
| This journal is © The Royal Society of Chemistry 2014 |