Bio-imaging with neutral luminescent Pt(II) complexes showing metal⋯metal interactions†
Dedy Septiadia,
Alessandro Aliprandia,
Matteo Mauro*ab and
Luisa De Cola*a
aISIS & icFRC, Université de Strasbourg & CNRS, 8 rue Gaspard Monge, 67000 Strasbourg, France. E-mail: mauro@unistra.fr; decola@unistra.fr; Fax: +33 (0)3 6885 5242; Tel: +33 (0)3 6885 5220
bUniversity of Strasbourg Institute for Advanced Study (USIAS), 5 allée du Général Rouvillois, 67083 Strasbourg, France
First published on 28th May 2014
Abstract
Molecular bio-imaging based on optical detection is facing important challenges in the attempt to develop new materials and small molecules able to have better emission quantum yield, stability toward photobleaching and long excited-state lifetime. A strategy to achieve these properties is to use triplet emitters based on metal complexes and to protect them from dioxygen quenching. We report on an interesting approach based on the use of self-assembled platinum compounds in order to obtain stable, highly emissive and long-lived species. Cell internalization and localization experiments show that the assemblies possess a different selectivity towards cellular compartments dictated by the terdentate ligand coordinated to the platinum. Also, the conditions used for the incubation determine cell internalization of the platinum complexes or their expulsion in the media.
1. Introduction
In the past decades organometallic compounds containing transition metals have attracted much attention for both fundamental and applied research. The combination of metal ions and ligands for the formation of metal complexes leads to a series of properties, which are unique in terms of reactivity, photochemistry, photophysics and redox. In particular, transition metal complexes, TMCs, based on first row, e.g. Cu(I), second and third row with d6 electronic configuration, such as Ir(III), Ru(II) and Re(I), d8 e.g. Pt(II), d10 e.g. Au(I), are amongst the most investigated systems. Their photochemical and thermal stability, wide modulation of the emission colour,1,2 high photoluminescence quantum yield (PLQY) with values up to unity,3,4 good solution- and/or vacuum-processability and the possibility to electrically populate the luminescent excited states, make them good candidates for solid-state light-emitting devices and optoelectronic applications.5–12Another major research field in which luminescent TMCs are currently attracting great deal of attention is their use for sensing of bio-related molecules,13–17 and as luminescent labels for bio-imaging.18–22 Even though fluorescent organic and bio-organic labels are still the leading choice for such applications mostly due to their excitation and emission tunability,23–25 the use of phosphorescent TMCs is taking over because of the enormous advantages that the latters might show over the formers.18–22
In this respect, apart from the wide emission colour tunability above mentioned, most luminescent TMCs are (i) more stable towards photo- and chemical degradation; (ii) they display a very large Stokes shift that allows the detection of their emission at a much lower energy than the excitation energy; (iii) their lowest-lying luminescent excited state is triplet in nature and therefore they exhibit long-lived excited states. Also, many of the investigated complexes possess excited states of charge transfer nature thus making them sensitive to the environment in terms of polarity and rigidity, while long-lived luminescence allows dioxygen detection. In bio-medical applications this last property is of particular importance since an improvement of the signal over background auto-fluorescence26,27 ratio, by means of time-gated techniques, can be achieved.28 However, to maintain high emission quantum yield and long excited state lifetime in water and in particular in the presence of dioxygen is a big challenge. In fact, a bimolecular quenching of the emission is in general observed and its efficiency is related to the excited state lifetime and the amount of molecular oxygen dissolved in the environment. To prevent the decrease of the emission intensity, a strategy, followed by several authors, is the encapsulation of the emitters in the core of dendrimers29–32 or other large shielding structures such as vesicles and micelles to limit the diffusion of the quencher.33 The combination of the sensitivity towards the environment and the large range of excited state lifetimes (from nano- to micro-seconds), has been successfully used for time-resolved imaging techniques such as fluorescence and phosphorescence lifetime imaging mapping, namely FLIM and PLIM, respectively.34
Another limitation of the luminescent TMCs vs. organic dyes is their low absorption in the visible region. Indeed, their excitation is typically achieved by using UV light, which has a very limited penetration into tissues and causes damage of biological specimens due to the high-energy content. These severe drawbacks hamper the successful employment of luminescent TMCs for imaging in living cells, in tissue and in vivo. Developing systems that can be excited and emit in the red to NIR in order to minimize auto-fluorescence as well as tissue light absorption and scattering is highly desirable and a challenge.26,27,35–37
Amongst all luminescent TMCs, platinum(II) complexes play a leading role in several applications because of their great photophysical properties and interesting structural characteristics. In particular, the high tendency towards stacking through π–π and closed-shell metallophilic interactions facilitated by their square-planar geometry is appealing for the protection of the metal complex from the environment. Noteworthy, such d8⋯d8 interaction, which typically shows distances in the range 3–3.5 Å, leads to lower-lying excited state with metal–metal-to-ligand charge transfer (MMLCT) character and in some cases enhancement of the emission properties.38–40
Herein, we report on how the use of neutral square-planar platinum(II) complexes, consisting of a terdentate ligand containing a pyridine bis-triazole coordinating moiety, could be a successful strategy towards the development for high luminescent and long-lived imaging probes. We also demonstrate how upon establishment of metallophilic interactions, formation of the MMLCT band can be advantageously used for inducing a sizeable bathochromic shift of both excitation and emission while enhancing PLQY. Finally, the formation of such aggregates results in reduced photobleaching of the probes and in a sizeable prolongation of their excited-state lifetime in living human cervical carcinoma, HeLa, cells incubated with the here reported platinum derivatives.
2. Experimental section
2.1 Material and methods
All the reactions were carried out under nitrogen atmosphere. All the solvents and reagents were used as received from Aldrich, Fluka, TCI and VWR without further purification. K2PtCl4 was purchased from Precious Metal Online (PMO). PtCl2(DMSO)2,41 and 2,6-bis(3-(p-tolyl)-1H-1,2,4-triazol-5-yl)pyridine (py-Tol-trzH2)42 were prepared by following already reported synthetic procedures. All the synthesis and characterization of the ligands and the complexes are described below. Column chromatography was performed on silica gel 60 (particle size 63–200 μm, 230–400 mesh, Merck). High-resolution electron spray ionization mass spectrometry (HR-ESI-MS) was performed on a Bruker Daltonics (Bremen, Germany) MicroToF with loop injection. 1H and 19F NMR analyses were carried out on a Bruker AMX 400 Avance. The full characterization for all the compounds is given in the ESI (see Fig. S1–S4†).2.2 Syntheses of the ligands
![[thin space (1/6-em)]](https://www.rsc.org/images/entities/char_2009.gif) :1 as eluent (2.04 g, 5.84 mmol, yield 9.2%). 1H NMR (CD2Cl2, ppm) δ: 13.82 (2H), 8.21 (2H), 8.06 (1H); 19F{1H} NMR (CD2Cl2, ppm) δ: −65.61 (1F). HR-ESI-MS (m/z): [M + Na]+ calcd 372.0395; found 372.0403.
:1 as eluent (2.04 g, 5.84 mmol, yield 9.2%). 1H NMR (CD2Cl2, ppm) δ: 13.82 (2H), 8.21 (2H), 8.06 (1H); 19F{1H} NMR (CD2Cl2, ppm) δ: −65.61 (1F). HR-ESI-MS (m/z): [M + Na]+ calcd 372.0395; found 372.0403.2.3 Synthesis of the complexes
:1 2-methoxyethanol and water. The reaction mixture was heated overnight at 85 °C. A yellowish-green precipitate appeared few minutes after the heating. The desired compound was purified on column chromatography using silica gel as stationary phase and 3:1 THF–n-hexane mixture as eluent, and obtained as greenish-yellow solid (66.1 mg, 0.104 mmol, yield 15.7%). 1H NMR (THF-d8, ppm) δ: 9.31 (2H), 8.14 (1H), 8.72 (2H), 6.95 (2H); 19F{1H} NMR (THF-d8, ppm) δ: −65.10 (1F). HR-ESI-MS(−) (m/z): [M − H]− calcd 636.03246; found 636.03002.:1 as eluent, and obtained as yellow solid (yield 7%). 1H NMR (DMSO-d6, ppm) δ: 9.10 (2H), 8.17 (1H), 8.01 (4H), 7.80 (2H), 7.29 (4H), 6.50 (2H), 2.36 (6H); HR-ESI-MS (m/z): [M + H]+ calcd 682.16388; found 682.16471.2.4 Crystallography
X-Ray diffraction data collection was carried out on a Nonius Kappa-CCD diffractometer equipped with an Oxford Cryosystem liquid N2 device, using Mo Kα radiation (λ = 0.71073 Å). The crystal-detector distance was 36 mm. The cell parameters were determined (Denzo software)43 from reflections taken from one set of 10 frames (1.0° steps in phi angle), each at 20 s exposure. The structures were solved by direct methods using the program SHELXS-97.44 The refinement and all further calculations were carried out using SHELXL-97.45 The hydrogen atoms were included in calculated positions and treated as riding atoms using SHELXL default parameters. The non-H atoms were refined anisotropically, using weighted full-matrix least-squares on F2. A semi-empirical absorption correction was applied using MULscanABS in PLATON.46 Transmission factors: Tmin/Tmax = 0.35078/0.42889. The fluorines of one trifluoromethyl group are disordered over two positions. The structure was treated as a racemic twin solved within the P1 space group with a BASF of 0.26804.2.5 Photophysical measurements
All solvents used for spectroscopical characterization were spectrometric grade and purchased from VWR. Absorption spectra were measured on a Shimadzu UV-3600 spectrophotometer double-beam UV-VIS-NIR spectrometer and baseline corrected. Steady-state emission spectra were recorded on a Horiba Jobin-Yvon IBH FL-322 Fluorolog 3 spectrometer equipped with a 450 W xenon arc lamp, double-grating excitation, and emission monochromators (2.1 nm mm−1 of dispersion; 1200 grooves mm−1) and a TBX-04 single photon-counting detector. Emission and excitation spectra were corrected for source intensity (lamp and grating) and emission spectral response (detector and grating) by standard correction curves. Time-resolved measurements were performed using the time-correlated single-photon-counting (TCSPC) option on the Fluorolog 3. NanoLEDs (402 nm; fwhm <200 ps) with repetition rates between 10 kHz and 1 MHz was used to excite the sample. The excitation sources were mounted directly on the sample chamber at 90° to a double-grating emission monochromator (2.1 nm mm−1 of dispersion; 1200 grooves mm−1) and collected by a TBX-04 single-photon-counting detector. The photons collected at the detector are correlated by a time-to-amplitude converter to the excitation pulse. Signals were collected using an IBH DataStation Hub photon-counting module and data analysis was performed using the commercially available DAS6 software (Horiba Jobin-Yvon IBH). The quality of the fit was assessed by minimizing the reduced χ2 function and by visual inspection of the weighted residuals. For multi-exponential decays, the intensity, namely I(t), has been assumed to decay as the sum of individual single exponential decays as by the following equation:where τi are the decay times and ai are the amplitude of the component at t = 0. The percentages to the pre-exponential factors, ai, are listed upon normalization. The quantum yield measurements were performed by using an absolute photoluminescence quantum yield spectrometer Quantaurus C11347 (Hamamatsu, Japan) exciting the sample at λexc = 300 and 350 nm. All solvents were spectrometric grade. The measurements were performed on samples at 50 μM concentration.

2.6 Cell culture
All materials for cell culture were purchased from Gibco. HeLa cells were cultured inside media which contains 88% Dulbecco's Modified Eagle Medium (DMEM), 10% Fetal Bovine Serum (FBS), 1% penicillin–streptomycin and 1% L-glutamine 200 mM under 37 °C and 5% of CO2 condition for 48 hours until reaching 70 to 80% cell confluency. Subsequently, the cells were washed twice with Phosphate Buffer Solution (PBS), trypsinated and approximately 50000 cells were reseeded on the monolayer glass cover slip inside six-well plate culture dish and glass bottom dishes (MatTek). Fresh culture media (2 mL) was added gently and cells were grown overnight.
2.7 Platinum complexes incubation
2.8 Organelle staining
The cell layer was washed twice with PBS and kept in 0.1% Triton X-100 in PBS for 10 minutes and afterwards in 1% bovine serum albumin, BSA (Sigma Aldrich), in PBS for 20 min. The cell layer on glass cover slip was stained with Phalloidin Alexa Fluor® 568 (Invitrogen), for F-actin/membrane staining, for 20 min, in the dark at room temperature, and washed twice with PBS. For nucleoli staining purpose, 500 nM of SYTO® RNASelect™ Green Fluorescent Cell Stain (Invitrogen) solution were added on the top of cells for 20 minutes followed by PBS washing. For visualizing nuclear region, cell nucleus was stained with 4′,6-diamidino-2-phenylindole carboxamidine (DAPI) and washed twice with PBS. The cover slips were mounted onto glass slides for microscopy measurements.2.9 Photobleaching experiments
Photobleaching experiments were carried out on fixed cells priorly stained with CF3-Pt-4OHpy and DAPI. The sample was continuously excited with high power 405 nm laser (32 mW) for 5 minutes and subsequently imaged at low power acquisition (1.2 mW) every 5 minutes for a total time of 25 minutes.2.10 Kinetic of internalization of the complex in culture media
The culture media of live cells grown onto glass bottom dish was removed and 2 mL of CF3-Pt-4OHpy staining solution (50 μM in less than 1% DMSO containing culture media) was added. The cells were subsequently imaged by confocal microscopy setup for one minute acquisition time for a total duration of 75 minutes.2.11 Kinetic of cellular expulsion of the complex after culture media addition
Cells grown on glass bottom dish were incubated with 2 mL of CF3-Pt-4OHpy staining solution (50 μM in less than 1% DMSO containing PBS) for 20 minutes. Subsequently, cells were quickly washed three times with PBS to eliminate the excess of the complex and PBS media was replaced by normal culture media. Confocal microscopy experiments were directly performed for 2 minutes acquisition time for a total duration of 40 minutes.2.12 Fluorescence confocal microscopy
All of the fluorescence images were taken by using Zeiss LSM 710 confocal microscope system with 63× magnification, numerical aperture, NA, 1.3 of Zeiss LCI Plan-NEOFLUAR water immersion objective lens (Zeiss GmbH). The samples were excited by continuous wave (cw) laser at 405 nm. The emission of the complexes was collected in the range from 500 to 620 nm. In addition, the lambda-mode acquisition technique was performed to observe the emission spectra of the two complexes after cell internalization. In this case, the complexes were excited at 405 nm and emission spectra were collected from 412 to 723 nm. For co-localization experiments, the samples priorly co-stained with different dyes, DAPI (excitation/emission wavelength: 358 nm/461 nm), SYTO® RNASelect™ Green Fluorescent Cell Stain (excitation/emission wavelength: 490 nm/530 nm) and Alexa Fluor® 568 Phalloidin (excitation/emission wavelength: 578 nm/600 nm) were excited at 405 nm and 594 nm, respectively. The emission spectra of the complexes together with the different dyes employed were also collected by using lambda-mode acquisition of the confocal setup. The raw data taken by the lambda-mode then were proceed by using linear un-mixing tool available in ZEN 2011 software package (Zeiss GmbH). All image processing was performed by using the same software. False colour images were adjusted to better distinguish the complexes from cellular organelles, e.g. yellow corresponds to complex, blue to DAPI that stains nucleus, green to nucleoli, and red to F-actin.3. Results and discussion
3.1 Synthesis and single-crystal X-ray determination
The investigated complexes, namely Tol-Pt-4OHpy and CF3-Pt-4OHpy and the corresponding synthetic pathway for the preparation of ligands and complexes are shown in Chart 1 and Scheme S1 of the ESI,† respectively. The 2,6-bis(3-(p-tolyl)-1H-1,2,4-triazol-5-yl)pyridine, namely py-Tol-trzH2, tridentate 1igand was prepared in accordance with our already reported synthetic procedure.42 The corresponding ligand bearing the trifluoro-methyl substituent on the triazole rings, 2,6-bis(3-(trifluoromethyl)-1H-1,2,4-triazol-5-yl)pyridine, namely py-CF3-trzH2, has been prepared in modest yields by following an already reported method with some modifications (see Experimental section).38,47 | ||
| Chart 1 Chemical formulas and abbreviations of the platinum complexes investigated. | ||
The final complexes were prepared by using the synthetic procedure sketched in Scheme S1 of the ESI.† The reaction consists of a one-pot synthesis which employs either py-Tol-trzH2 or py-CF3-trzH2, as the tridentate ligand, PtCl2(DMSO)2 (DMSO = dimethylsulfoxide) as the Pt(II) precursor, triethylamine as the base and 4-hydroxypyridine as the ancillary ligand in a 3:1 mixture of 2-methoxyethanol and water as the solvent. The reaction mixture was heated overnight at 83 °C resulting in the formation of a highly emitting precipitate. The desired complexes were obtained by purification on column chromatography as highly emitting yellow powder and characterized by NMR and high-resolution mass spectrometry. Further synthetic details can be found in the Experimental section.
The 4-hydroxypyridine has been chosen as the ancillary ligand to provide an amphiphilic character to the complexes while keeping the overall charge neutral nature of the compounds. Neutral square-planar platinum complexes are indeed expected to show higher aggregation tendency than charged counterparts, due to the fact that the latters might experience much higher repulsive electrostatic interactions when spatially near.
Single crystals of the platinum complex bearing the trifluoro-methyl moieties suitable for X-ray diffractometric analysis were obtained by crystallization in DMSO at room temperature. The corresponding ORTEP diagram for the complex CF3-Pt-4OHpy·2DMSO is displayed in Fig. 1. The crystal data and structural refinement parameters are listed in Table S1 of the ESI.† In the crystal state, the complex adopts a square-planar arrangement around the platinum atom, distorted in order to comply with the geometrical constrains imposed by the formally-dianionic tridentate ligand. As far as the geometrical parameters are concerned, the N(py)–Pt [where py is pyridine] bond lengths are 1.995(16) and 2.029(16) Å for N(1)–Pt and N(8)–Pt, respectively, and the N(trz)–Pt [where trz is triazolate] distances are 2.014(10) and 2.024(10) Å for N(2)–Pt and N(5)–Pt, respectively. Also, the N(py)–Pt–N(trz) bond angles, namely N(1)–Pt–N(2) and N(1)–Pt–N(5), are 81.1(6)° and 79.3(6)°, respectively. These values are sizeably narrower than those one could expect for ideal chelating arrangement for square planar complexes (90°). Finally, the complex shows an close-to-planarity arrangement as demonstrated by the value of 3.1(10)° of the N(1)–Pt–N(8) out-of-plane bending angle adopted by the nitrogen atom, N(8), of the monodentate ancillary pyridine. All these crystallographic findings are in agreement with the already reported structures of Pt(II) complexes containing 1,2,4-triazolate ligands with a κN1 coordination mode.48–50 Noteworthy, in the crystal packing the complex molecules are organized in a parallel head-to-head staggered fashion, but no closed-shell Pt⋯Pt interaction (Pt⋯Pt distance = 4.845 Å) has been observed, resulting in a negligible interaction between neighbour molecules. Such absence of interaction could most likely be due to the presence of the DMSO molecules within the crystal structure engaged in hydrogen bond interaction with the OH moiety of the ancillary pyridine [O(1)–H(1)⋯O(2) = 1.66 Å and O(1)⋯O(2) = 2.50(2) Å].
 | ||
| Fig. 1 ORTEP diagram of complex CF3-Pt-4OHpy·2DMSO with thermal ellipsoids shown at 30% probability level with corresponding atom labelling. The two DMSO solvent molecules are omitted for sake of clarity. Selected bond lengths (Å) and angles (°): N(1)–Pt = 1.995(16), N(2)–Pt = 2.014, N(5)–Pt = 2.024(10), N(8)–Pt = 2.029(16), N(1)–Pt–N(2) = 81.1(6), N(1)–Pt–N(5) = 79.3(6), N(2)–Pt–N(8) = 101.0(6), N(5)–Pt–N(8) 98.5(6). | ||
3.2 Photophysical properties
The absorption spectra of both complexes in DMSO solution are shown in Fig. S5 of the ESI† and the most meaningful photophysical data are summarized in Table 1.:99 v/v) solutions
| Compound | λabs (ε) [nm, × 103 M−1 cm−1] | λem [nm] | τ [ns] | PLQY (%) | DMSO–H2O 1:99 |
||
|---|---|---|---|---|---|---|---|
| λem [nm] | τ [ns] | PLQY (%) | |||||
| a Measured in DMSO at room temperature.b Measured at 77 K in 2Me-THF glassy matrix. | |||||||
| CF3-Pt-4OHpy | 392 (3.4)a | 452, 482, 515b | — | — | 587 | 163 (57%), 22 (28%), 365 (14%) | 36 |
| Tol-Pt-4OHpy | 322 (14.9), 390 (2.0)a | 534a | 5.1 (26%), 205 (67%), 476 (7%) | 1.2a | 562 | 662 (55%), 139 (27%), 1772 (19%) | 2.8 |
The compounds display broad and featureless weak bands (ε = 3.4 × 10³ M−1 cm−1 and 2.2 × 10³ M−1 cm−1 for CF3-Pt-4OHpy and Tol-Pt-4OHpy, respectively) centred at around 390 nm, which can be attributed to spin-allowed metal-to-ligand charge-transfer (1MLCT) transitions, as already reported for closely related complexes.22,42,48 Interestingly, the intensity of the bands is very different even though the maxima are the same for both complexes. These bands are attributed to transitions that mainly involve the platinum d orbitals partially mixed with the terdentate-ligand-centered π and π* orbitals. Complex Tol-Pt-4OHpy presents a strong featureless band at about 320 nm attributed to ligand-centered (1LC) π → π* transitions involving the tolyl groups on the triazolate rings. At higher energies, triazoles and pyridine bands overlap and it is not possible to assign the correct maxima within the window of the employed solvent.
Excitation at any of the absorption bands causes an emission at room temperature in DMSO only for the Tol-Pt-4OHpy (Fig. 2), with a maximum at 534 nm, while the trifluoro-methyl derivative is not emissive in fluid solution. The excitation spectrum is also depicted in Fig. 2 and it is very similar to the absorption spectrum recorded in the same conditions (Fig. S5 of the ESI†). Interestingly, addition of water in the DMSO solution, DMSO–H2O (1:99 v/v), causes the formation of aggregates for both the tolyl- and the CF3-containing derivatives. For the Tol-Pt-4OHpy the emission shifts to lower energy (Fig. 2) reaching a maximum at 562 nm, while the CF3-Pt-4OHpy displays now an emission at 587 nm. The fact that aggregates are formed is also visible looking at the excitation spectra as clearly demonstrated by the formation of a new broad band around 450 nm for the tolyl complex while for the CF3-Pt-4OHpy derivative the onset shifts to very low energy reaching 520 nm (Fig. 2). These low energy bands, which are absent in the pure DMSO solutions, are attributed to the transitions involving a new excited state, namely 3MMLCT, which is promoted by metallophilic interactions between platinum centers. The emission of the complex CF3-Pt-4OHpy, as monomeric species, can be detected at 77 K in 2-MeTHF glassy matrix. The structured emission presents vibrational sharp peaks at 452, 482 and 515 nm, and it is attributed mainly to ligand centred (LC) transitions in accordance with a similar previously reported complex (Fig. 2).38
 | ||
Fig. 2 Emission (solid traces) and excitation (![[dash dot, graph caption]](https://www.rsc.org/images/entities/char_e090.gif) ) spectra for complexes Tol-Pt-4OHpy and CF3-Pt-4OHpy in different conditions. Emission and excitation for Tol-Pt-4OHpy in pure DMSO (green traces) and in DMSO–H2O solutions (1:99 v/v) (orange trace); CF3-Pt-4OHpy at 77 K in 2-MeTHF glassy matrix (black trace) and in DMSO–H2O (1:99 v/v) (red trace). The samples were excited at λexc = 330 nm. ) spectra for complexes Tol-Pt-4OHpy and CF3-Pt-4OHpy in different conditions. Emission and excitation for Tol-Pt-4OHpy in pure DMSO (green traces) and in DMSO–H2O solutions (1:99 v/v) (orange trace); CF3-Pt-4OHpy at 77 K in 2-MeTHF glassy matrix (black trace) and in DMSO–H2O (1:99 v/v) (red trace). The samples were excited at λexc = 330 nm. | ||
At room temperature, the excited state lifetimes of the complexes show multi-exponential kinetics and, for Tol-Pt-4OHpy, they become longer going from pure DMSO to DMSO/H2O solutions. This behaviour mirrors the fact that we are most likely in the presence of aggregates as well as that both monomers and assemblies of different size are present and emissive. We believe that the longest component, being 1772 ns (19%) and 365 ns (14%) for Tol-Pt-4OHpy and CF3-Pt-4OHpy, respectively, is always associated to the most packed aggregates which prevent dioxygen diffusion reducing emission quenching. Noteworthy, the emission quantum yield for CF3-Pt-4OHpy reaches a value as high as 36% in the aggregate form in air-equilibrated DMSO–H2O (1:99 v/v) condition.
3.3 Bio-imaging
Due to the dynamic behaviour between monomeric and aggregates species, monitored following the changes in the photophysical properties, we have investigated the possible use of the complexes as probes for optical imaging in living and fixed cells.The two complexes possess terdentate ligands with different hydrophobicity and electron density. Furthermore, CF3-Pt-4OHpy has been chosen because trifluoromethyl groups are known to enhance cell and nuclear permeability, while lipophilicity generally enhance cellular uptake even though being responsible of increased cytotoxicity.51,52 On the other hand, Tol-Pt-4OHpy derivative displays good luminescent properties in both monomeric and aggregated conditions.
The platinum complexes were dissolved in a minimum amount of DMSO and the respective solutions were diluted into phosphate buffer saline, PBS, resulting in a 50 μM solution with less than 1% content in DMSO. HeLa cells were incubated for 4 hours at 37 °C under 5% CO2 atmosphere with the complexes, and then were washed with complex-free PBS, followed by cell fixation using 4% paraformaldehyde (PFA) solution. In addition, kinetic experiments to observe the real time internalization of the complex were performed (data not shown).
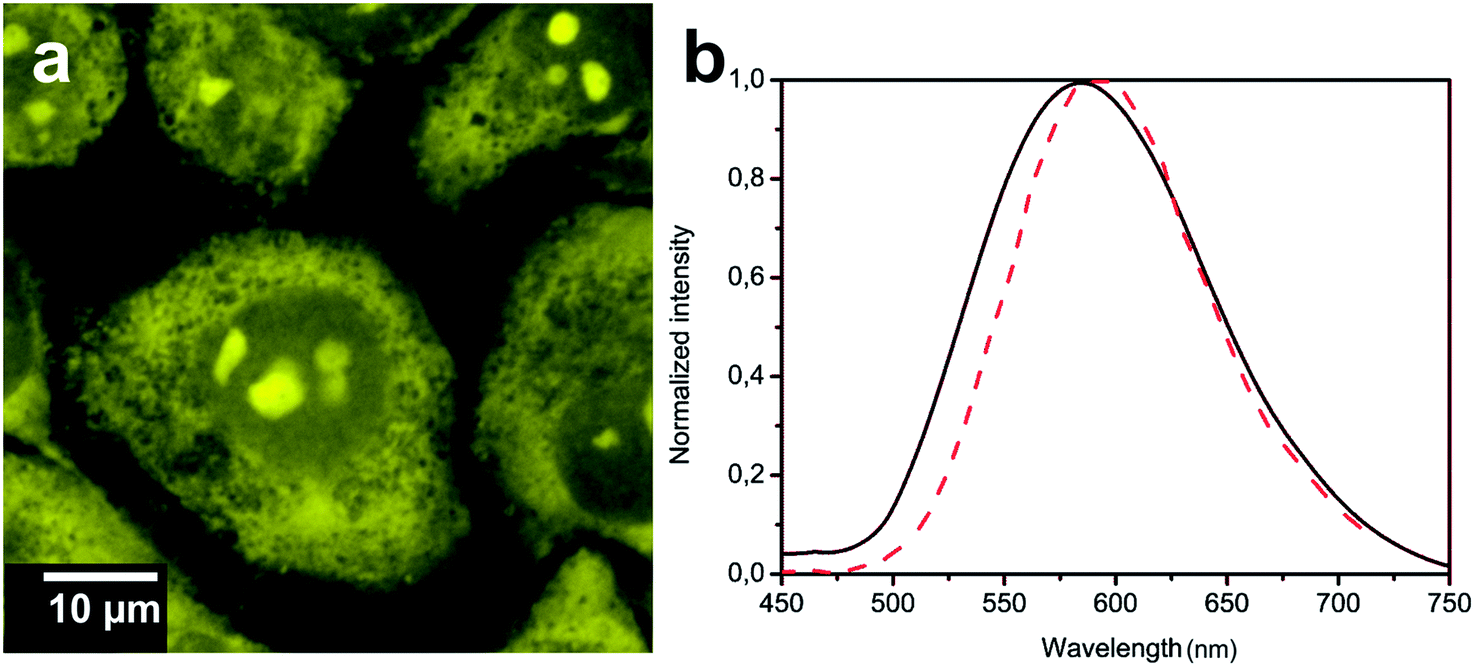
As shown in the confocal microscopy images, Fig. 3a and 4a, the two complexes show bright emission coming from different cellular compartments indicating cell internalization.22
 | ||
| Fig. 3 (a) Luminescence confocal microscopy images showing the distribution of complex Tol-Pt-4OHpy inside HeLa cells; (b) emission spectra recorded for DMSO–H2O solution (solid black trace) and collected from the cytoplasmic region of the cells (dashed red trace). The samples were excited at λexc = 330 and 405 nm for solvents and cell experiments, respectively. | ||
 | ||
| Fig. 4 (a) Luminescence confocal microscopy images showing the distribution of CF3-Pt-4OHpy inside HeLa cells; (b) emission spectra recorded in DMSO–H2O solution (black solid trace) and from the bright aggregate inside the nuclear region (dashed red trace). The samples were excited at λexc = 330 and 405 nm for solvents and cell experiments, respectively. | ||
The emission of Tol-Pt-4OHpy was mainly observed from cytoplasmic region while the trifluoromethyl-containing complex, i.e. CF3-Pt-4OHpy, was partially distributed in the cytoplasmic region but bright aggregates were observed inside the nucleus. At this stage we have no evidence if the metal complexes are internalized as monomeric species and then aggregate inside cells or they are uptaken as small aggregates. The emission spectra taken from the highly emissive spots clearly demonstrate that for both complexes the emission energy and shape correspond to those of the assembled systems in DMSO–water solution (see Fig. 3b and 4b). To have a better understanding of the localization of the CF3-Pt-4OHpy complex, co-localization studies were performed by staining the three regions where we observe the orange emission. The cells were labelled with 4′,6-diamidino-2-phenylindole-6-carboxamidine (DAPI) (nucleus label), Phalloidin Alexa Fluor® 568 (F-actin stain) and SYTO® RNASelect™ Green Fluorescent Cell Stain (nucleoli stain). As depicted in Fig. 5a and b, CF3-Pt-4OHpy is able to localize into cytoplasm and also inside the nucleus. The perfect overlap of the emission of the complex and the SYTO® RNASelect™ green fluorescence indicates that the assemblies are present in the nucleoli (Fig. 5b). To prove that the complex is really inside the cell we have also done z-scan acquisitions by means of a confocal microscope and the results are displayed Fig. 5c.
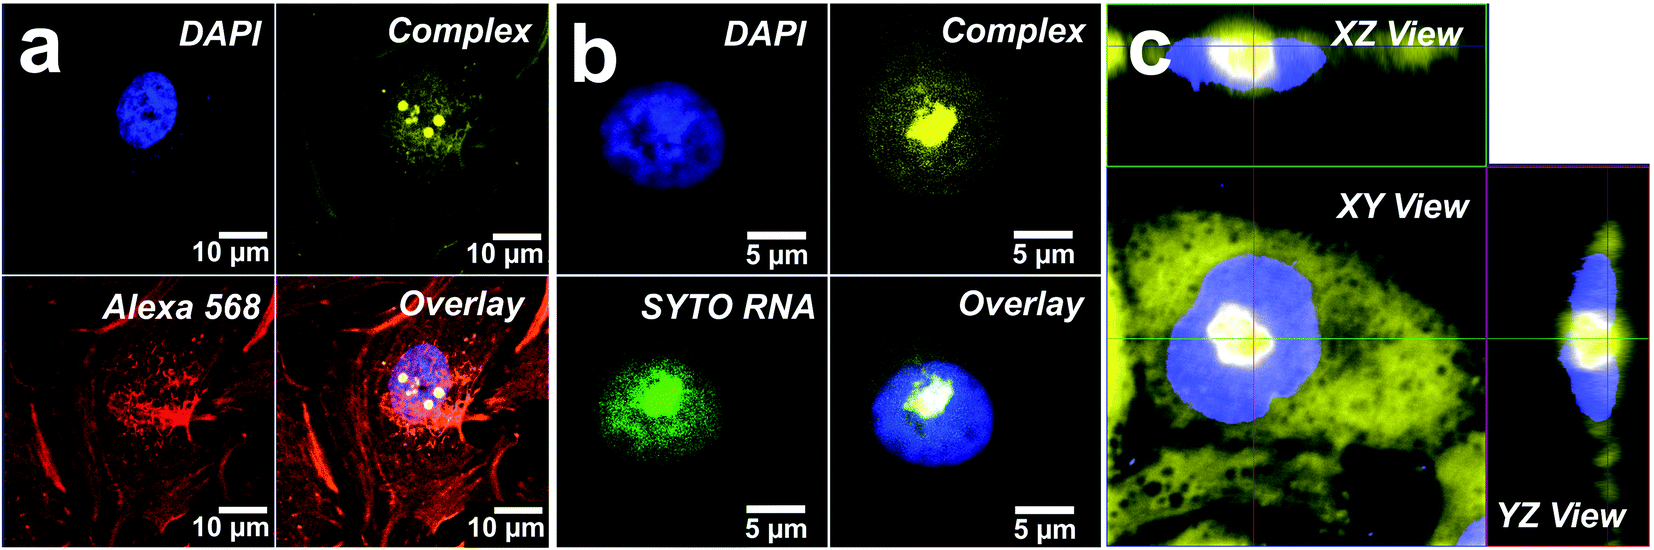 | ||
| Fig. 5 Confocal microscopy images of the distribution of CF3-Pt-4OHpy inside HeLa cells. (a) DAPI staining of nucleus, complex CF3-Pt-4OHpy, Phalloidin Alexa Fluor® 568 stains F-actin inside cytoplasmic region, overlay of three images. The excitation wavelength for DAPI and CF3-Pt-4OHpy was 405 nm, while Phalloidin Alexa Fluor® 568 was excited at 594 nm. Localization experiments (b) showing DAPI staining the nucleus, SYTO® RNASelect™ Green Fluorescent Cell Stain labelling the nucleoli (λexc = 488 nm), and in yellow the emission of CF3-Pt-4OHpy. The overlay image suggests that the aggregates are confined in the nucleoli. (c) Orthogonal view of the image showing a very bright signal (yellow) due to CF3-Pt-4OHpy aggregates coming from inside the nuclear region and co-localized into the nucleoli. Blue color is due to the DAPI staining. | ||
Interestingly, these complexes showing aggregation process through (extended) ground-state dz2⋯dz2 metallophilic interactions possess low-lying 1MMLCT state. As can be clearly seen from Fig. 2 we should be able to excite the systems also in the visible region since the excitation spectrum extend to almost 550 nm. To prove that excitation can be as low as 543 nm, we have recorded emission images upon different excitation wavelengths and showed that we can efficiently use this complex and overcome the problem related to the excitation energy as shown for CF3-Pt-4OHpy in Fig. S6 of the ESI.† The aggregation process is not only leading to the protection of the platinum complexes and prevents oxygen quenching, as already discussed above, but also to reduced photobleaching. In order to estimate, to a certain extent, the degree of photostability of the investigated systems inside the nucleus of cells, we have compared the photobleaching time of DAPI, used to stain nuclear region, with our platinum complexes upon excitation at the same wavelength, 405 nm. The results are displayed in Fig. S7† and clearly suggest that our label is more photostable than the organic dye.
We wish to point out that the uptake of the platinum complexes and their internalization in HeLa cells occur only when PBS is used as incubation media. Indeed, the replacement of PBS with cell culture media prevented the complexes to be internalized by the cells. Fig. S8† shows the experiments carried out for the complex CF3-Pt-4OHpy. The data obtained suggest that the platinum complex is somehow sequestered by the culture media, most likely because of an interaction with one of the proteins, and therefore is not uptaken by the cells even if the incubation time is extended to 24 hours. Furthermore, to confirm this hypothesis, the complex was incubated for 20 minutes in PBS solution with cells and, as expected, internalization occurred (Fig. 6a). At this point, the cells were washed several times with PBS to eliminate the excess of the complex and the PBS was replaced by normal culture media. After several minutes (see Movie S1† and Fig. 6b and c), the luminescence slowly disappears from inside the cells and surprisingly it has been detected in bright small spots surrounding the cells, but clearly in the cell culture media. In addition, the emission profile collected from several of these aggregates confirms that photoluminescence is coming from the platinum compounds, but the wavelengths (λem = 550 nm) is hypsochromically shifted compared with the platinum aggregates inside the cells. This observation supports the hypothesis that the platinum complexes experience a different environment and therefore change their emission properties.
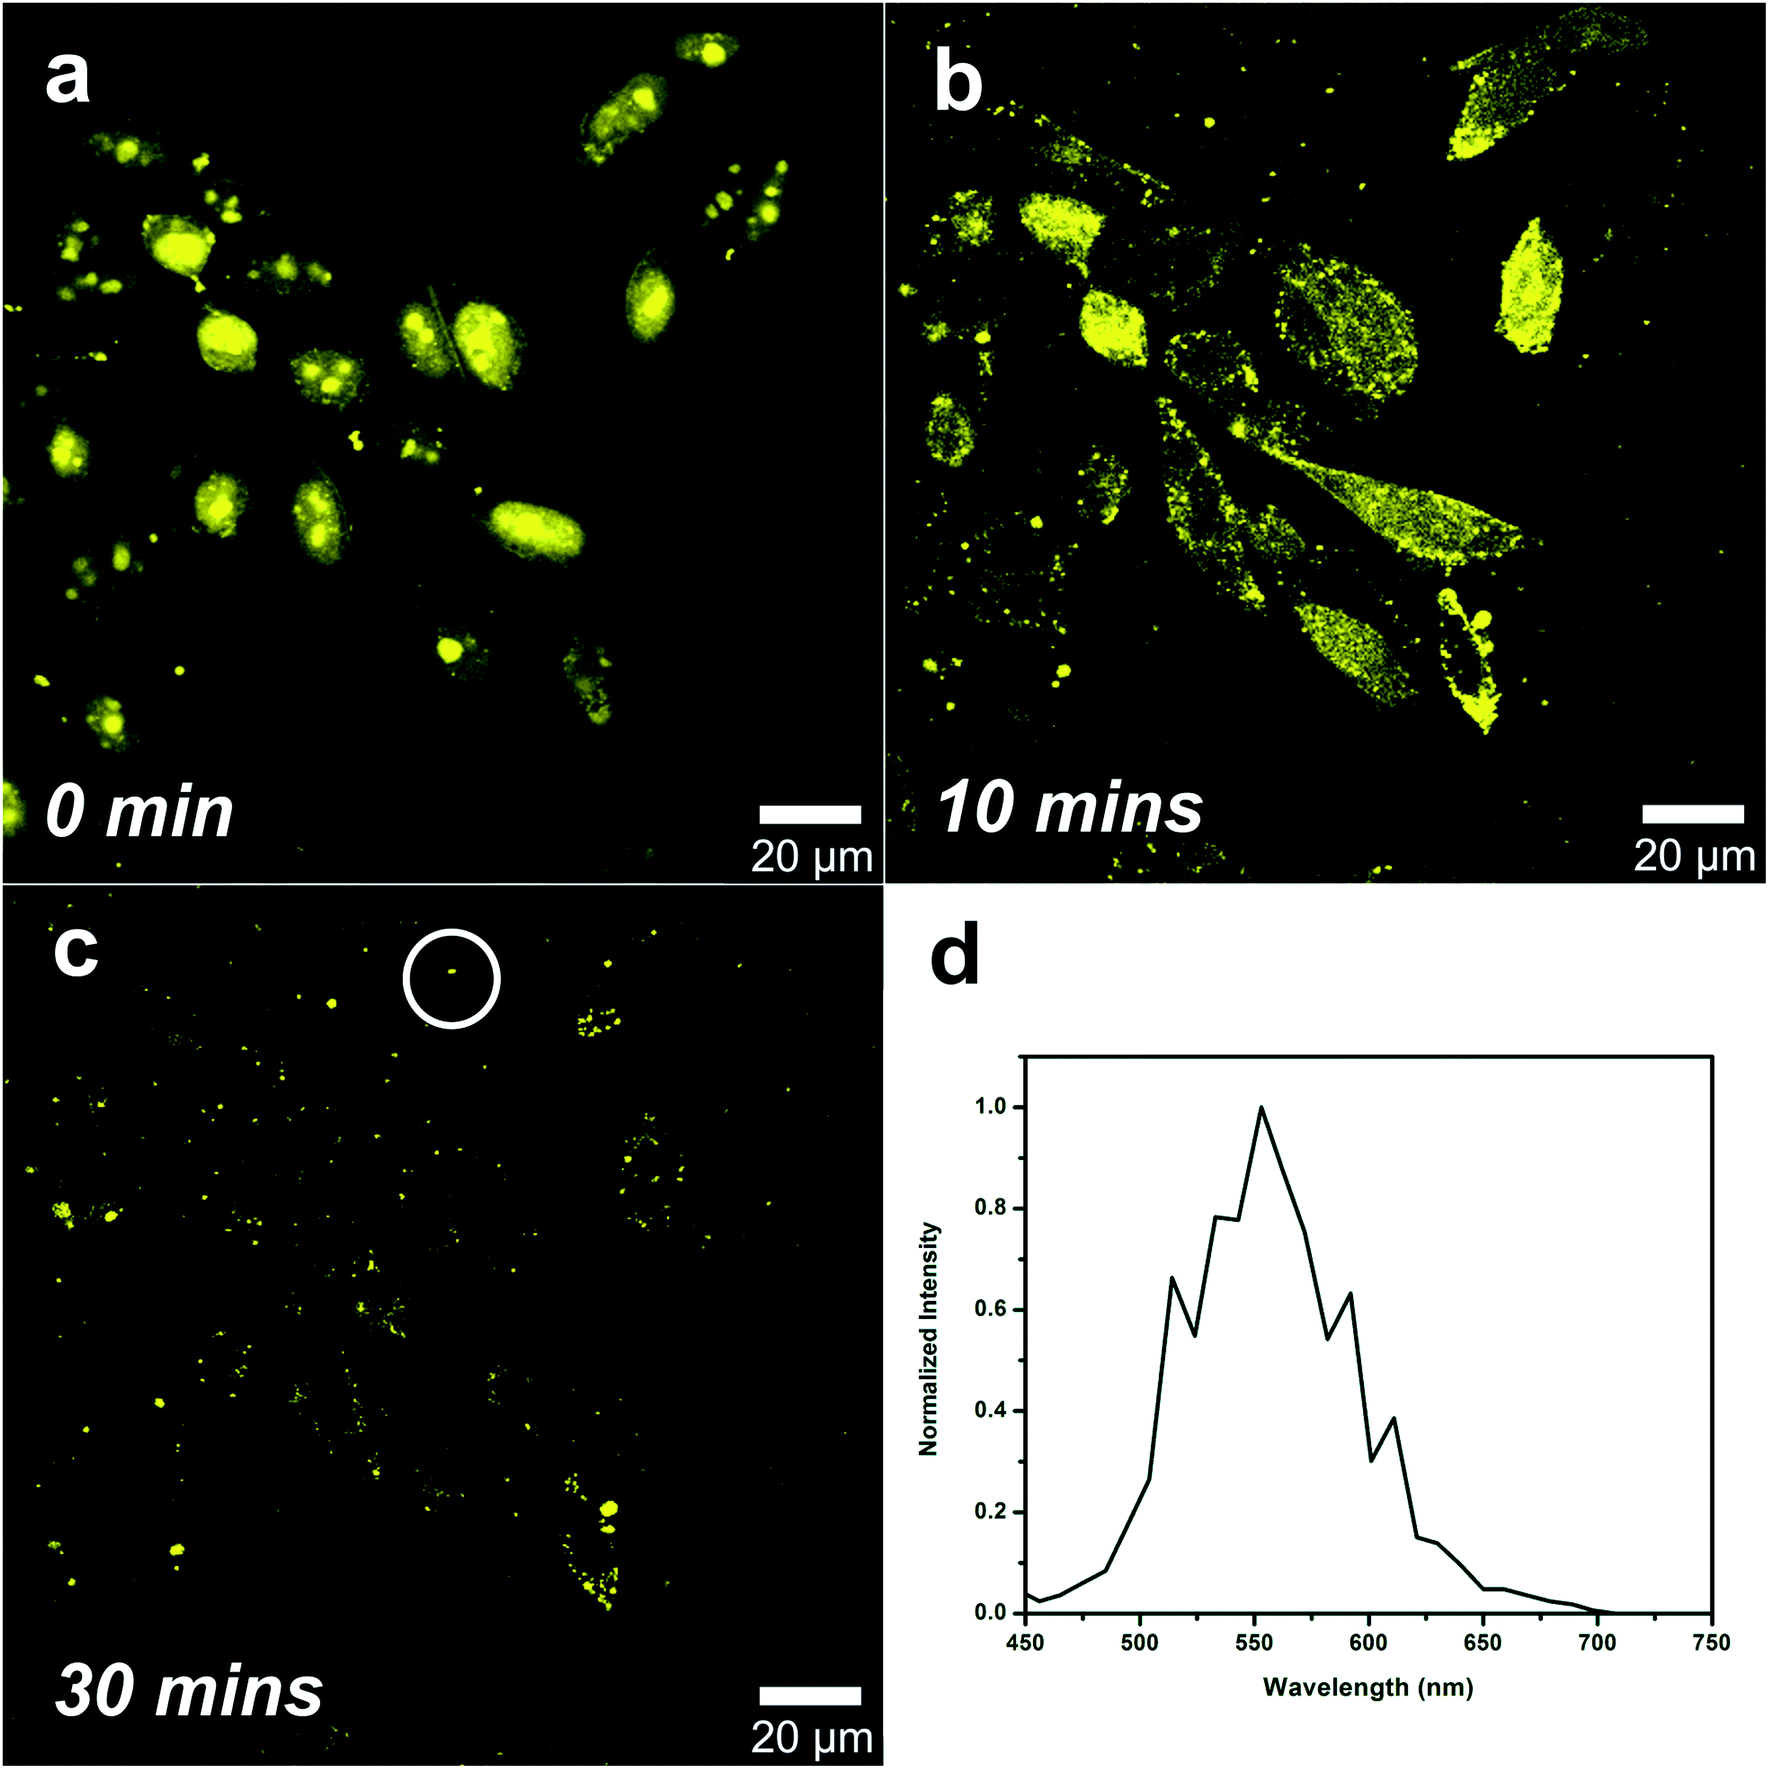 | ||
| Fig. 6 The complex CF3-Pt-4OHpy is aggregated inside the nucleus after 20 min incubation in PBS and replacement of the PBS with cell culture media causes its externalization in few minutes: (a) 0 minute, (b) 10 minutes, and (c) 30 minutes. (d) Emission spectrum recorded from the small aggregates in the white circle region, showing a maximum centred at 550 nm. | ||
However, internalization of the platinum complexes using cell culture media as the incubating media can occur if the cells are dying or cell membrane is partly damaged. Live cell imaging was performed on HeLa cells incubated with CF3-Pt-4OHpy in cell culture media using time-lapse acquisition mode. The complex was excited at 405 nm and the emission signal was collected with one-minute acquisition time for a total duration of 75 minutes. The slices of time-lapse images for 0 to 75 minutes can be seen in Fig. 7 (see also Movie S2 of the ESI†). Our findings reveal that there was no uptake occurring before the first 30 minutes, but surprisingly the uptake of the complex starts very rapidly only when the cells were dying due to the long exposure to UV light (see formation of apoptotic sign in Movie S2,† bright field image, after one hour). This is indeed not surprising since, as already reported, long exposure to UV light can harm the cell, break cell membrane, damage DNA and other cellular organelles and later induce cell death.53 In fact, this specific uptake phenomenon has been observed and well studied especially in the development of dead cell labelling molecules.
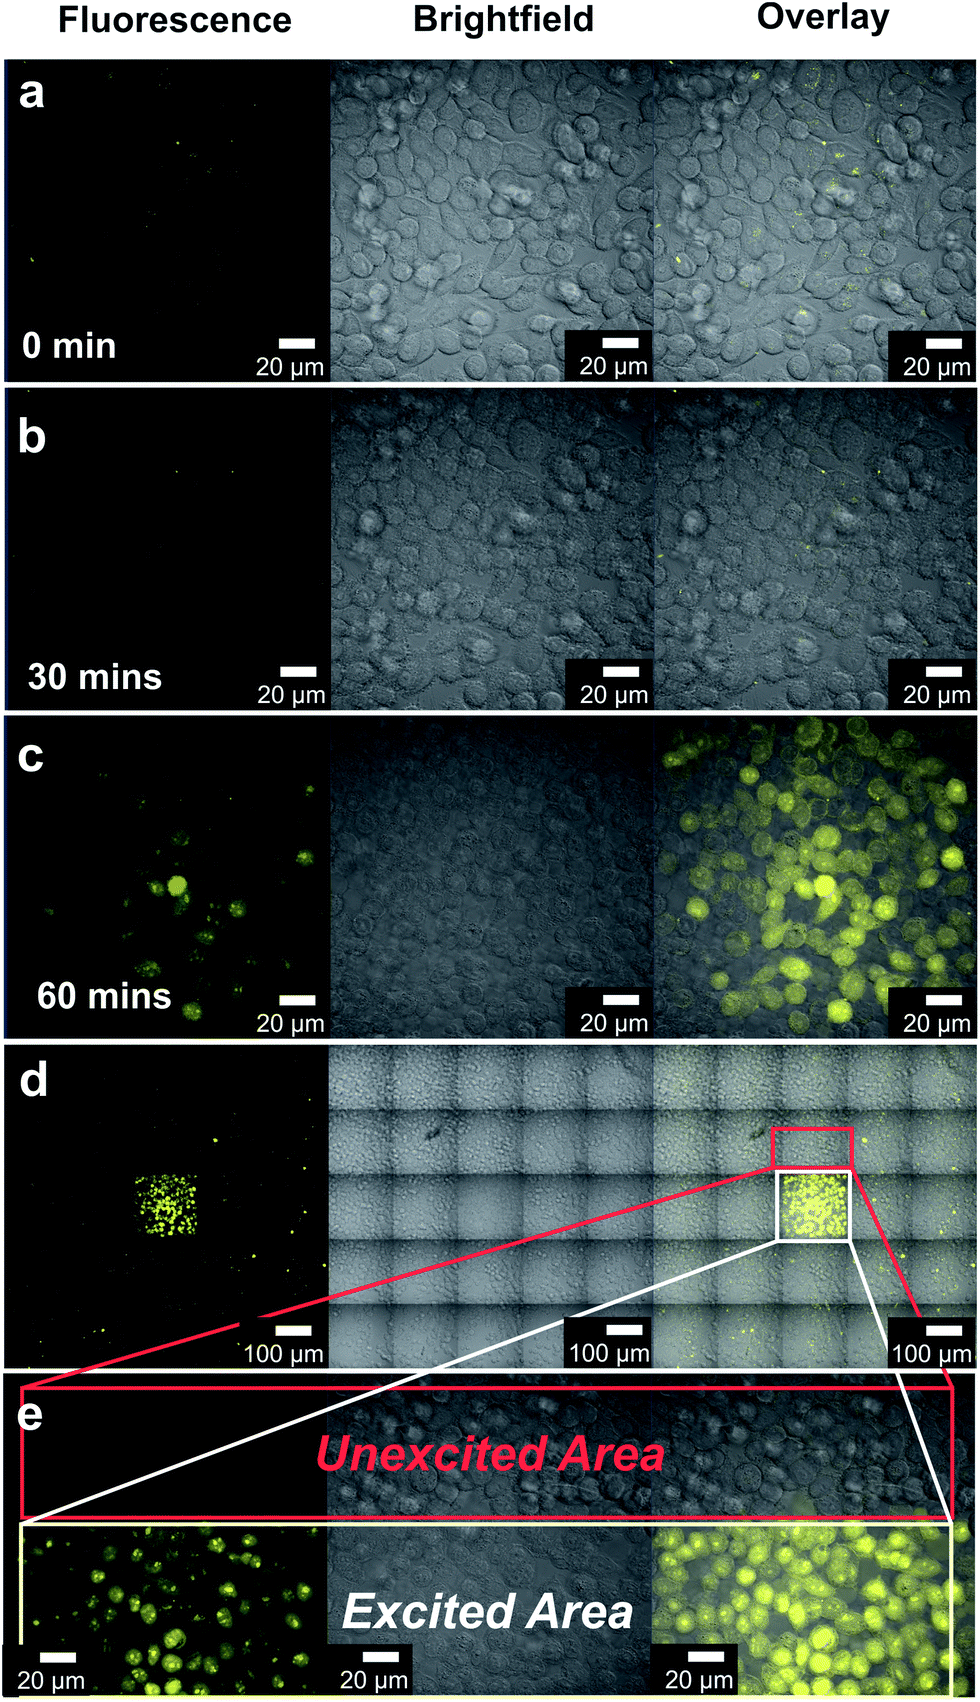 | ||
| Fig. 7 Time-lapse images showing the light-induced internalization of CF3-Pt-4OHpy in culture media after different irradiation times: (a) 0 minute, (b) 30 minutes, and (c) 60 minutes. (d) zoom-out view; (e) zoom-in view showing the unexcited region and the area exposed to the 405 nm laser irradiation. | ||
As shown Fig. 7d and e, this finding is also strongly supported by the fact that only area irradiated with UV light show cellular uptake of the complex while cells in the surrounding do not exhibit any internalization since they have not been damaged. A control experiment to prove that the platinum complex is not responsible for the cell damage, due to the formation of singlet oxygen or other reactive species, was performed by irradiating the system, in the same conditions, at 455 and 488 nm, where the platinum complexes absorb light.
4. Conclusion
We have demonstrated the use of metal complexes and in particular of luminescent Pt(II) systems for bioimaging. Their square planar geometry can induce self-assembly resulting in supramolecular architectures possessing interesting photophysical properties together with an enhanced stability. Such aggregates can be indeed considered a new class of dynamic probes, since the emission can be easily modulated and their long-lived emission easily detected. Also by designing the coordinating ligands it is possible to internalize and localize the complexes in specific parts of the cells.The investigated complexes show efficient uptake when specific incubation conditions e.g. PBS was used and, interestingly, the presence of proteins or other biomolecules can inhibit or even sequester the platinum complexes forcing expulsion from cells after their internalization. Irradiation of the cells with 405 nm light causes fast uptake of the compounds due to cell damage.
Acknowledgements
The authors kindly acknowledge University of Strasbourg, CNRS and ERC grant n. 2009-247365 for financial support. L.D.C. is grateful to the Région Alsace and the Communauté Urbaine de Strasbourg for the award of a Gutenberg Excellence Chair (2011–2012) and to AXA Research funds. The authors gratefully acknowledge the International Center for Frontier Research in Chemistry (icFRC), the Région Alsace, the Communauté Urbaine de Strasbourg, the Département du Bas-Rhin, and the LabEx Chimie des Systèmes Complexes for funding the purchase of the Zeiss LSM 710 confocal microscope. The authors kindly acknowledge Dr C. Bailly and Dr L. Brelot, University of Strasbourg, for single crystal X-ray diffractometric determination.Notes and references
- N. Darmawan, C.-H. Yang, M. Mauro, M. Raynal, S. Heun, J. Pan, H. Buchholz, P. Braunstein and L. De Cola, Inorg. Chem., 2013, 52, 10756–10765 CrossRef CAS PubMed.
- M. S. Lowry and S. Bernhard, Chem.–Eur. J., 2006, 12, 7970–7977 CrossRef CAS PubMed; Y. You and S. Y. Park, Dalton Trans., 2009, 1267–1282 RSC.
- Y. Kawamura, K. Goushi, J. Brooks, J. J. Brown, H. Sasabe and C. Adachi, Appl. Phys. Lett., 2005, 86, 071104–071107 CrossRef PubMed.
- X.-C. Hang, T. Fleetham, E. Turner, J. Brooks and J. Li, Angew. Chem., Int. Ed., 2013, 52, 6753–6756 CrossRef CAS PubMed.
- Highly Efficient OLEDs with Phosphorescent Materials, ed. H. Yersin, Wiley-VCH, Weinheim, Germany, 2008 Search PubMed.
- M. E. Thompson, P. E. Djurovich, S. Barlow and S. Marder, Organometallic Complexes for Optoelectronic Applications, in Comprehensive Organometallic Chemistry III, ed. R. H. Crabtree and D. M. P. Mingos, Elsevier, Oxford, UK, 2006 Search PubMed.
- H. Xu, R. Chen, Q. Sun, W. Lai, Q. Su, W. Huang and X. Liu, Chem. Soc. Rev., 2014, 43, 3259–3302 RSC.
- R. D. Costa, E. Ortí, H. J. Bolink, F. Monti, G. Accorsi and N. Armaroli, Angew. Chem., Int. Ed., 2012, 51, 8178–8211 CrossRef CAS PubMed.
- T. Hu, L. He, L. Duan and Y. Qiu, J. Mater. Chem., 2012, 22, 4206–4215 RSC.
- S. C. F. Kui, F.-F. Hung, S.-L. Lai, M.-Y. Yuen, C.-C. Kwok, K.-H. Low, S. S.-Y. Chui and C.-M. Che, Chem.–Eur. J., 2012, 18, 96–109 CrossRef CAS PubMed.
- P.-T. Chou and Y. Chi, Chem.–Eur. J., 2007, 13, 380–395 CrossRef CAS PubMed; Y. You and S. Y. Park, Dalton Trans., 2009, 1267–1282 RSC.
- M. Panigati, M. Mauro, D. Donghi, P. Mercandelli, P. Mussini, L. De Cola and G. D'Alfonso, Coord. Chem. Rev., 2012, 256, 1621–1643 CrossRef CAS PubMed.
- Y. Yang, Q. Zhao, W. Feng and F. Li, Chem. Rev., 2013, 113, 192–270 CrossRef CAS PubMed.
- X. Chen, T. Pradhan, F. Wang, J. S. Kim and J. Yoon, Chem. Rev., 2012, 112, 1910–1956 CrossRef CAS PubMed.
- C. Y.-S. Chung, K. H.-Y. Chan and V. W.-W. Yam, Chem. Commun., 2011, 47, 2000–2002 RSC.
- P. Wu, E. L.-M. Wong, D.-L. Ma, G. S.-M. Tong, K.-M. Ng and C.-M. Che, Chem.–Eur. J., 2009, 15, 3652–3656 CrossRef CAS PubMed.
- A. Ruggi, F. W. B. van Leeuwen and A. H. Velders, Coord. Chem. Rev., 2011, 255, 2542–2554 CrossRef CAS PubMed.
- V. Fernández-Moreira, F. L. Thorp-Greenwood and M. P. Coogan, Chem. Commun., 2010, 46, 186–202 RSC.
- E. Baggaley, J. A. Weinstein and J. A. G. Williams, Coord. Chem. Rev., 2012, 256, 1762–1785 CrossRef CAS PubMed.
- Q. Zhao, C. Huang and F. Li, Chem. Soc. Rev., 2011, 40, 2508–2524 RSC.
- K. K.-W. Lo, A. W.-T. Choi and W. H.-T. Law, Dalton Trans., 2012, 41, 6021–6047 RSC.
- M. Mauro, A. Aliprandi, D. Septiadi, N. S. Kehr and L. De Cola, Chem. Soc. Rev., 2014, 43, 4144–4166 RSC.
- R. Y. Tsien, Angew. Chem., Int. Ed., 2009, 48, 5612–5626 CrossRef CAS PubMed.
- R. D. Moriarty, A. Martin, K. Adamson, E. O'Reilly, P. Mollard, R. J. Forster and T. E. Keyes, J. Microsc., 2014, 253, 204–218 CrossRef CAS PubMed.
- Z. Guo, S. Park, J. Yoon and I. Shin, Chem. Soc. Rev., 2014, 43, 16–29 RSC.
- H. Andersson, T. Baechi, M. Hoechl and C. Richter, J. Microsc., 1998, 191, 1–7 CrossRef CAS.
- J. E. Aubin, J. Histochem. Cytochem., 1979, 27, 36–43 CrossRef CAS PubMed.
- S. W. Botchway, M. Charnley, J. W. Haycock, A. W. Parker, D. L. Rochester, J. A. Weinstein and J. A. G. Williams, Proc. Natl. Acad. Sci. U. S. A., 2008, 105, 16071–16076 CrossRef CAS PubMed.
- V. Balzani, G. Bergamini and P. Ceroni, Adv. Inorg. Chem., 2011, 63, 105–135 CrossRef CAS.
- V. Balzani, G. Bergamini, P. Ceroni and F. Vögtle, Coord. Chem. Rev., 2007, 251, 525–535 CrossRef CAS PubMed.
- T. Qin, J. Ding, L. Wang, M. Baumgarten, G. Zhou and K. Müllen, J. Am. Chem. Soc., 2009, 131, 14329–14336 CrossRef CAS PubMed.
- S.-C. Lo, G. J. Richards, P. J. J. Markham, E. B. Namdas, S. Sharma, P. L. Burn and D. W. I. Samuel, Adv. Funct. Mater., 2005, 15, 1451–1458 CrossRef CAS.
- M. Mauro, G. De Paoli, M. Otter, D. Donghi, G. D'Alfonso and L. De Cola, Dalton Trans., 2011, 40, 12106–12116 RSC.
- E. Baggaley, S. W. Botchway, J. W. Haycock, H. Morris, I. V. Sazanovich, J. A. G. Williams and J. A. Weinstein, Chem. Sci., 2014, 5, 879–886 RSC.
- J. M. Baumes, J. J. Gassensmith, J. Giblin, J.-J. Lee, A. G. White, W. J. Culligan, W. M. Leevy, M. Kuno and B. D. Smith, Nat. Chem., 2010, 2, 1025–1030 CrossRef CAS PubMed.
- J. O. Escobedo, O. Rusin, S. Lim and R. M. Strongin, Curr. Opin. Chem. Biol., 2010, 14, 64–70 CrossRef CAS PubMed.
- S. A. Hilderbrand and R. Weissleder, Curr. Opin. Chem. Biol., 2010, 14, 71–79 CrossRef CAS PubMed.
- M. Mauro, A. Aliprandi, C. Cebrián, D. Wang, C. Kübel and L. De Cola, Chem. Commun., 2014 10.1039/c4cc01045k.
- C. A. Strassert, C.-H. Chien, M. D. Galvez Lopez, D. Kourkoulos, D. Hertel, K. Meerholz and L. De Cola, Angew. Chem., Int. Ed., 2011, 50, 946–950 CrossRef CAS PubMed.
- N. Komiya, N. Itami and T. Naota, Chem.–Eur. J., 2013, 19, 9497–9505 CrossRef CAS PubMed.
- R. Romeo and L. M. Scolaro, Inorg. Synth., 1998, 32, 149–153 CrossRef.
- M. Mydlak, M. Mauro, F. Polo, M. Felicetti, J. Leonhardt, G. Diener, L. De Cola and C. A. Strassert, Chem. Mater., 2011, 23, 3659–3667 CrossRef CAS.
- Kappa CCD Operation Manual, ed. B. V. Nonius, Delft, The Netherlands, 1997 Search PubMed.
- G. M. Sheldrick, Acta Crystallogr., Sect. A: Found. Crystallogr., 1990, 46, 467–473 CrossRef.
- G. Sheldrick, SHELXL-97, Universität Göttingen, Göttingen, Germany, 1999 Search PubMed.
- A. L. Spek, J. Appl. Crystallogr., 2003, 36, 7–13 CrossRef CAS.
- K. Funabiki, N. Noma, G. Kuzuya, M. Matsui and K. Shibata, J. Chem. Res., Synop., 1999, 300–301 RSC.
- C. Cebrián, M. Mauro, D. Kourkoulos, P. Mercandelli, D. Hertel, K. Meerholz, C. A. Strassert and L. De Cola, Adv. Mater., 2013, 25, 437–442 CrossRef PubMed.
- A. I. Matesanz and P. Souza, J. Inorg. Biochem., 2007, 101, 245–253 CrossRef CAS PubMed.
- H.-Y. Hsieh, C.-H. Lin, G.-M. Tu, Y. Chi and G.-H. Lee, Inorg. Chim. Acta, 2009, 362, 4734–4739 CrossRef CAS PubMed.
- H. L. Yale, J. Med. Chem., 1958, 1, 121–133 CrossRef.
- S. Purser, P. R. Moore, S. Swallow and V. Gouverneur, Chem. Soc. Rev., 2008, 37, 320–330 RSC.
- K. V. Bogdanov, A. B. Chukhlovin, A. Y. Zaritskey, O. I. Frolova and B. V. Afanasiev, Br. J. Haematol., 1997, 98, 869–872 CrossRef CAS.
Footnote |
| † Electronic supplementary information (ESI) available: Synthetic scheme, photophysical, bio-imaging and crystallographic data can be found as ESI. CCDC 988918. For ESI and crystallographic data in CIF or other electronic format see DOI: 10.1039/c4ra02351j |
| This journal is © The Royal Society of Chemistry 2014 |