 Open Access Article
Creative Commons Attribution 3.0 Unported Licence
Photophysics of 7-(diethylamino)coumarin-3-carboxylic acid in cationic micelles: effect of chain length and head group of the surfactants and urea†
Aninda
Chatterjee
,
Banibrata
Maity
and
Debabrata
Seth
*
Department of Chemistry, Indian Institute of Technology, Patna 800013, Bihar, India. E-mail: debabrata@iitp.ac.in; Fax: +91-612-2277383
First published on 17th July 2014
Abstract
In this work, we have studied the effects of chain length and the head group of different cationic surfactants on the photophysics of an anionic dye, 7-(diethylamino)coumarin-3-carboxylic acid (7-DCCA), using steady state absorption and fluorescence emission spectroscopy, and time resolved emission spectroscopy. We have observed pronounced effects on the photophysics of 7-DCCA, by varying the chain length and the head group of the surfactants. The fluorescence quantum yield, decay time, solvent relaxation time, and rotational relaxation time changes with chain length and the head group of the surfactants. We have studied the effect of urea on the photophysics of 7-DCCA bound to the micellar media and found that urea causes increases in the fluorescence quantum yield, fluorescence decay time, and solvent relaxation time. These aspects clearly demonstrate that the addition of urea does not cause the removal of the dye from the micellar surface.
1. Introduction
Substituted aminocoumarins are very popular, and are used as fluorescence probe molecules. These molecules show significant changes in their spectral properties depending on the nature of the surrounding environment. By absorbing the radiation, these aminocoumarins exhibit charge transfer in the excited state and form a more polar intramolecular charge transfer (ICT) state. Sometimes by structural deformation, a twisted intramolecular charge transfer (TICT) state is formed, and amino groups are then twisted with respect to the plane of rest of the molecule.1–3 These ICT and TICT state formations are dependent upon the nature of the surrounding medium. Photophysical studies on different coumarin molecules were performed to reveal the photophysics of these molecules.1–9Micelles are generally spherical or nearly spherical aggregates formed by surfactant molecules when the concentration of the surfactants reaches above the critical micellar concentration (CMC). Micelles are important biomimic systems. The probe molecule in micelles can reside in three different locations: in bulk water, in the dry hydrophobic core of the micelle, and in the Stern layer.10 When the molecules reside at the interface, a significant difference of solvation dynamics is observed compared to that in neat water. Sarkar et al. studied the solvation dynamics in neutral, cationic and anionic micelles in water using Coumarin 480.11 They concluded that the solvent relaxations of water molecules at the micelle interfaces are much slower than in the neat water.11 In different organised media, the solvation dynamics of water becomes much slower compared to bulk water.12 Nandi and Bagchi proposed the concept of dynamic exchange between the two kinds of water molecules in a biological system, e.g., free and bound water, and established that a dynamic equilibrium existed between them.13 Free water molecules are free to rotate, and participate significantly in the dielectric relaxation process. The bound water molecules form bonds with the biomolecules by hydrogen bonding interactions, and motions of these water molecules are thus highly restricted. This model depicts that the slow relaxation process is mainly dependent upon the strength of the hydrogen bond. Bhattacharya et al. studied the solvation dynamics in neutral, anionic and cationic micelles by using 4-aminophthalimide (4-AP) as probe molecules.14 They concluded that the solvation dynamics in micelles are independent of the probe molecules. Similarly, several groups have studied the solvation dynamics in micelles by using different probes.15–24 Besides these experimental studies, several groups have also studied the nature of the solvation dynamics of water in micelles by computer simulation.25–29
7-(Diethylamino)coumarin-3-carboxylic acid (7-DCCA) is a non-rigid analogue of Coumarin 343 (C-343). Very few studies are reported in the literature on the photophysics of 7-DCCA molecules.3,30–34 It is known that this molecule generally does not show any emission band related to TICT. TICT processes are non-emissive in nature for 7-DCCA. However, in the presence of TiO2 nanoparticles, electron injection occurs more efficiently from the TICT state, and a new emission band has been observed.30 This is due to the electron injection from the TICT state to the conduction band of the TiO2 nanoparticles.30 We have studied the photophysical properties of 7-DCCA in cyclodextrins, reverse micelles, and in different solvents.3,33,34 It was observed that the photophysical properties of 7-DCCA are highly dependent on the structure of the media and on the specific solute-solvent interactions.34
In this work we have studied the photophysics of 7-DCCA in different micelles. This study will be helpful to know the effects of surfactant chain lengths and head groups of different cationic surfactants on the binding of an anionic coumarin dye (7-DCCA) with micelles. For instance it will address how the spectral properties of 7-DCCA are affected when interacting with different cationic micelles. This article will be helpful for understanding the effects of chain length and the head group of different cationic surfactants on the solvent and rotational relaxation of an anionic molecule. We used 7-DCCA, since it is acidic in nature; and as it has hydrogen bond formation ability due to the presence of a hydrophilic group, compared to Coumarin-153 and Coumarin-480. Moreover, it presents a strong propensity to form the TICT state, which is absent in the popularly used dyes (e.g., Coumarin-480 and Coumarin-153), but which is useful for studying the solvation dynamics in micelles. We have demonstrated the effect of urea on the photophysics of 7-DCCA in micelles. This article will highlight the action of urea (direct or indirect) on the photophysics of an anionic molecule in micelles.
2. Materials and methods
2.1 Materials
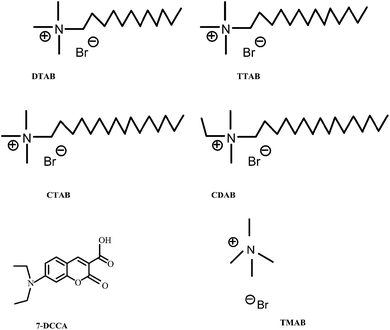
7-DCCA was purchased from Sigma-Aldrich and used as received. All the used surfactants dodecyltrimethylammonium bromide (DTAB), cetyltrimethylammonium bromide (CTAB), tetradecyltrimethylammonium bromide (TTAB), and ethylhexadecyldimethylammonium bromide (CDAB), tetramethylammonium bromide (TMAB) were purchased from Sigma-Aldrich, and used as received. The structures of all the surfactants and the fluorescent dye 7-DCCA are shown in Scheme 1. Millipore water was used for all solution preparations. Urea (molecular biology grade) was purchased from CDH Ltd., India.2.2 Methods
The ground state absorption measurements were performed by using UV-Vis spectrophotometer (model: UV-2550, Shimadzu). The steady-state fluorescence emission measurements were performed using a Fluoromax-4P spectrofluorometer (Horiba Jobin Yvon). For absorption and fluorescence measurements, the path length of the used quartz cuvette is 1 cm. The fluorescence quantum yields of 7-DCCA in different micellar media were measured using the fluorescence quantum yield of Coumarin 480 in water solution (ϕr = 0.66)35 as the reference and by using the eqn (1): | (1) |
The fluorescence time resolved decays were collected by using a picosecond time-correlated single-photon counting (TCSPC) technique. We used a time-resolved fluorescence spectrophotometer from Edinburgh Instruments (model: LifeSpec-II, U.K.). We used a picosecond diode laser at 405 nm as the excitation source. The full width at half maximum (FWHM) of our system is ∼90 ps. The fluorescence transients were detected at a magic angle (54.7°) polarization by using a Hamamatsu MCP PMT (3809U) as the detector. The decays were analysed using F-900 decay analysis software. In the time resolved measurements, the temperature was kept constant at 298 K by using Peltier-controlled cuvette holders from the Quantum Northwest (model: TLC-50). For steady state measurements, the temperature was kept constant at 298 K, by using a Jeiotech refrigerated bath circulator (model: RW0525G).
The fluorescence anisotropy decay [r(t)] was measured by using the same instrument. The eqn (2) was used to obtain r(t).
 | (2) |
 | (3) |
| 〈τrot〉 = βτslow + (1 − β)τfast | (4) |
3. Results
3.1 Steady state absorption and emission spectral studies
The 7-DCCA molecule remains in the aqueous solution as an anion.34 The absorption maximum of 7-DCCA in water was found to appear at 409 nm. The pKa value of 7-DCCA is 4.34 The absorption maximum of the dye underwent a blue shift with the addition of surfactants in the aqueous solution of 7-DCCA. The absorption maxima of 7-DCCA in DTAB and TTAB micelles was blue shifted to 395 nm, as shown in Table 1 and Fig. 1. The absorption maximum of 7-DCCA in CTAB and CDAB micelles was blue shifted to 393 nm (Table 1 and Fig. 1). The absorption maximum of 7-DCCA remained almost unaffected in DTAB and TTAB micellar solution with the addition of urea, and in the case of CTAB and CDAB micelles, we observed a small red shift.| Sr. no. | System | λ max (abs) (nm) | λ max (emi) (nm) | ϕ f | k r (s−1) | k nr (s−1) | Binding constant (M−1) |
|---|---|---|---|---|---|---|---|
| 1 | 7-DCCA in water | 409 | 470 | 0.03 | 2.11 × 10⁸ | 6.83 × 10⁹ | — |
| 2 | 7-DCCA + DTAB | 395 | 456 | 0.20 | 2.60 × 10⁸ | 1.04 × 10⁹ | 5.3 × 10³ (±1.1 × 10³) |
| 3 | 7-DCCA + DTAB + 7 (M) urea | 395 | 456 | 0.21 | 2.33 × 10⁸ | 8.76 × 10⁸ | — |
| 4 | 7-DCCA + TTAB | 395 | 456 | 0.20 | 2.36 × 10⁸ | 9.46 × 10⁸ | 2.5 × 10⁵ (±1.5 × 10⁵) |
| 5 | 7-DCCA + TTAB + 7 (M) urea | 395 | 456 | 0.23 | 2.32 × 10⁸ | 7.76 × 10⁸ | — |
| 6 | 7-DCCA in CTAB | 393 | 455 | 0.27 | 2.88 × 10⁸ | 7.80 × 10⁸ | 2.0 × 10⁶ (±1.1 × 10⁶) |
| 7 | 7-DCCA in CTAB + 7 (M) urea | 396 | 456 | 0.26 | 2.40 × 10⁸ | 6.82 × 10⁸ | — |
| 8 | 7-DCCA in CDAB | 393 | 455 | 0.26 | 2.87 × 10⁸ | 8.17 × 10⁸ | 7.8 × 10⁵ (±1.5 × 10⁵) |
| 9 | 7-DCCA in CDAB + 7 (M) urea | 396 | 456 | 0.25 | 2.36 × 10⁸ | 7.08 × 10⁸ | — |
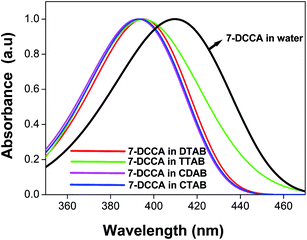 | ||
| Fig. 1 The absorption spectra of 7-DCCA in neat water and in micellar media. The concentration of surfactants in all cases is 20 times that of their CMC. | ||
We studied the steady state fluorescence emission properties of 7-DCCA in all micelles. We found that 7-DCCA showed an emission maximum at 470 nm in water, and with the addition of surfactant, the emission maxima underwent a blue shift. The fluorescence emission maxima appeared at ∼455 nm, when the concentration of surfactants reached 20 times the critical micellar concentration (CMC). This blue shift is accompanied by an increase in the fluorescence intensity and quantum yield, as shown in Table 1 and Fig. 2. The addition of 7 (M) urea in the micellar solution of DTAB and TTAB caused a slight increase in the fluorescence quantum yield. The variations in fluorescence intensity with the concentration of surfactants are shown in Fig. 3.
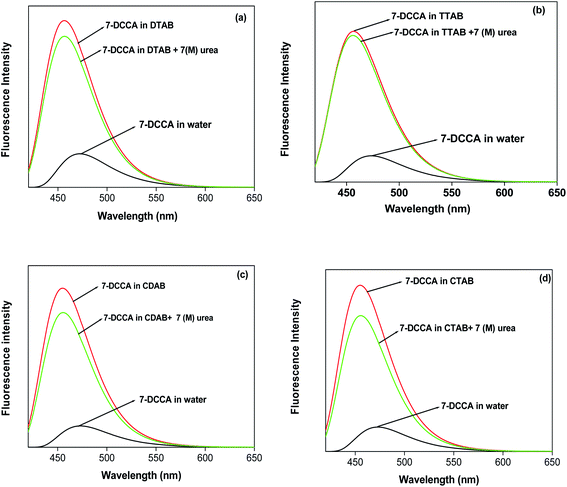 | ||
| Fig. 2 The steady state emission spectra of 7-DCCA in different micellar media. The concentration of surfactants in all cases is 20 times that of their CMC. | ||
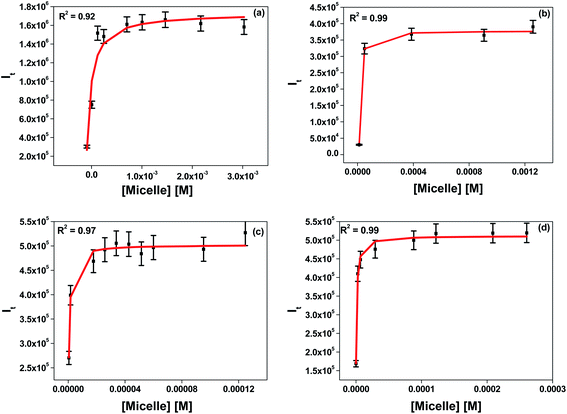 | ||
| Fig. 3 Determination of the binding constants of 7-DCCA with (a) DTAB micelles, (b) TTAB micelles, (c) CTAB micelles, and (d) CDAB micelles. | ||
3.2 Binding study of 7-DCCA with the micellar system
We determined the binding interaction of 7-DCCA with all micelles. The detailed procedure to calculate the binding constant is described in the ESI.† In the case of DTAB, TTAB, and CTAB, the chain length increases and head groups remain the same. The binding constant value increased from 5.3 × 10³ (±1.1 × 10³) M−1 in DTAB to 2.0 × 10⁶ (±1.1 × 10⁶) M−1 in CTAB, as shown in Table 1 and Fig. 3. Therefore, with increasing the four methylene groups in the alkyl chain of the surfactant, the binding constant value increased ∼380 times. When the chain length remained the same and the head group was varied, the binding interaction was also affected. Replacing one methyl group of the CTAB by ethyl caused a decrease in the binding constant from 2.0 × 10⁶ (±1.1 × 10⁶) M−1 in CTAB to 7.8 × 10⁵ (±1.5 × 10⁵) M−1 in CDAB.3.3 Time resolved fluorescence emission measurements
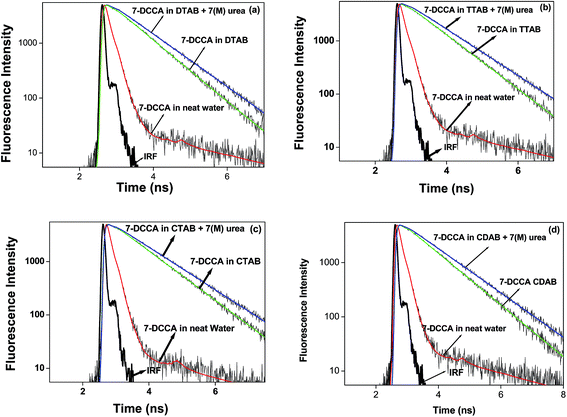
Time resolved fluorescence emission measurements were used to understand the dye micelle interaction, and the effect of urea. The average fluorescence decay time of 7-DCCA in water is 145 ps. 7-DCCA exhibits a fast component of 130 ps with a population of 99.5%, and a slow component of 2.759 ns with a population of 0.5% in neat water. With the addition of DTAB (20 times of CMC), the fluorescence decay time increased to 770 ps. It further increased to 902 ps after the addition of 7 (M) urea. Similar trends were also observed in the case of other micelles. It was observed that in TTAB, CTAB, and CDAB micelles the fluorescence decay times are 845, 935, and 905 ps, respectively. The addition of urea in the micellar solution of 7-DCCA cause's a further increase in the fluorescence decay time (Fig. 4 and Table 2). It is observed that, with a gradual increase in the alkyl chain length of surfactants, the fluorescence decay time gradually increases in a regular way, as shown in Fig. 5. The residual of the fitted curves are shown in Fig. S1 and S2.†| Sr. no. | System | τ 1 | a 1 | τ 2 | a 2 | 〈τf 〉a (ns) | χ 2 |
|---|---|---|---|---|---|---|---|
| a 〈τf〉 = a1τ1 + a2τ2. | |||||||
| 1 | 7-DCCA in water | 0.130 | 0.995 | 2.759 | 0.005 | 0.145 | 1.093 |
| 2 | 7-DCCA + DTAB | 0.770 | 1 | — | — | 0.770 | 0.978 |
| 3 | 7-DCCA + DTAB + 7 (M) urea | 0.900 | 1 | — | — | 0.900 | 0.937 |
| 4 | 7-DCCA + TTAB | 0.845 | 1 | — | — | 0.845 | 1.079 |
| 5 | 7-DCCA + TTAB + 7 (M) urea | 0.990 | 1 | — | — | 0.990 | 1.072 |
| 6 | 7-DCCA + CTAB | 0.935 | 1 | — | — | 0.935 | 1.029 |
| 7 | 7-DCCA + CTAB + 7 (M) urea | 1.085 | 1 | — | — | 1.085 | 1.113 |
| 8 | 7-DCCA + CDAB | 0.905 | 1 | — | — | 0.905 | 1.064 |
| 9 | 7-DCCA + CDAB + 7 (M) urea | 1.060 | 1 | — | — | 1.060 | 1.201 |
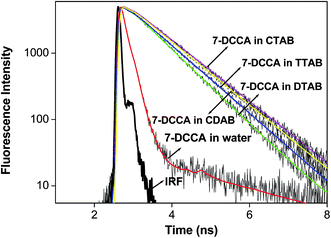 | ||
| Fig. 5 Comparisons of the fluorescence emission decays of 7-DCCA in water, DTAB, TTAB, CDAB, and CTAB micellar media. The concentration of surfactants in all cases is 20 times that of their CMC. | ||
For the 7-DCCA molecule, the TICT state formation is the main nonradiative decay pathway and goes through the ICT state formation.30 To calculate the radiative and nonradiative decay rate constants, the following equations are used:
 | (5) |
 | (6) |
3.4 Solvation dynamics of 7-DCCA in micellar media
We studied the solvation dynamics in micellar media, using 7-DCCA as a probe molecule. The detailed procedure to calculate the solvation time is described in the ESI.† In order to understand the solvent relaxation dynamics, we collected the time resolved fluorescence emission decays at different emission wavelengths, from the blue end to the red end of the steady state emission maxima of 7-DCCA in micelles. At the red end, emission decays are slow and show the presence of a rising component, whereas those at the blue end show very quick decay. The fluorescence decay profiles at different emission wavelengths in DTAB and CTAB micellar media are shown in Fig. 6.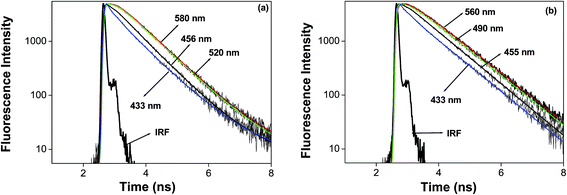 | ||
| Fig. 6 The fluorescence emission decays of 7-DCCA at different wavelengths in (a) DTAB and (b) CTAB micellar media. | ||
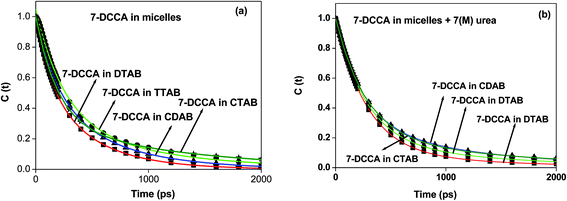
In all systems, the decays of C(t) were fitted by a biexponential function (Table 3 and Fig. 7). In our case, we found that for all the micelles, the solvent relaxation time consisted of two components. One is a faster component ranging from 170–260 ps, and the other is a slower component ranging from 500–1300 ps. The addition of 7 (M) urea in micellar solution causes a change in the solvation time for all micelles. In the presence of urea, the solvation times have two components: slow and fast components. Even under such conditions and with the gradual increase in surfactant chain length, the solvation time gradually increases from 383 ps in DTAB to 542 ps in CTAB. The time resolved emission spectra (TRES) of 7-DCCA in DTAB, TTAB, CTAB, and CDAB micellar systems are shown in Fig. S3.†
| Sr. no. | System | b 1 | τ 1 (ps) | b 2 | τ 2 (ps) | 〈τ〉sol (ps) | Stokes shift (cm−1) |
|---|---|---|---|---|---|---|---|
| 1 | 7-DCCA in water | — | — | — | — | — | 3263 |
| 2 | 7-DCCA + DTAB | 0.57 | 174 | 0.43 | 545 | 333 | 3263 |
| 3 | 7-DCCA + TTAB | 0.70 | 250 | 0.30 | 950 | 460 | 3386 |
| 4 | 7-DCCA + CTAB | 0.70 | 193 | 0.30 | 1278 | 519 | 3467 |
| 5 | 7-DCCA + CDAB | 0.51 | 197 | 0.49 | 620 | 404 | 3386 |
| 6 | 7-DCCA + DTAB + 7 (M) urea | 0.90 | 279 | 0.10 | 1316 | 383 | 3467 |
| 7 | 7-DCCA + TTAB + 7 (M) urea | 0.82 | 270 | 0.18 | 1322 | 460 | 3386 |
| 8 | 7-DCCA + CTAB + 7 (M) urea | 0.79 | 274 | 0.21 | 1552 | 542 | 3322 |
| 9 | 7-DCCA + CDAB + 7 (M) urea | 0.71 | 245 | 0.29 | 1200 | 522 | 3386 |
3.5 Time resolved rotational relaxation studies
We studied the time resolved fluorescence anisotropy in order to understand the location of the dye 7-DCCA with the micelles. In water, the rotational relaxation time of 7-DCCA is ∼90 ps, and is fitted by a single exponential function. In the micellar medium, the rotational relaxation time consists of two components. The average rotational relaxation time of 7-DCCA in micelles and the change occurs after the addition of urea, as tabulated in Table 4. The change in the average rotational relaxation time of 7-DCCA in micellar media is shown in Table 4 and Fig. 8. The residual of the fitted curves are shown in Fig. S4.† The addition of 7 (M) urea to the DTAB micellar system causes an increase in the average rotational relaxation time of 7-DCCA to 0.815 ns. In the case of the CDAB micellar system, the addition of 7 (M) urea causes an increase in the rotational relaxation time to 1.360 ns. In the case of CTAB micelles, after the addition of 7 (M) urea, the rotational relaxation time increased to 0.970 ns. We discussed this in the latter sections.| Sr. no. | System | r 0 | a 1 | τ 1 (ns) | a 2 | τ 2 (ns) | 〈τrot〉 (ns) | χ 2 |
|---|---|---|---|---|---|---|---|---|
| 1 | 7-DCCA in DTAB | 0.375 | 0.30 | 0.170 | 0.70 | 0.890 | 0.675 | 1.109 |
| 2 | 7-DCCA in TTAB | 0.304 | 0.24 | 0.240 | 0.76 | 1.122 | 0.910 | 1.156 |
| 3 | 7-DCCA in CTAB | 0.340 | 0.29 | 0.240 | 0.71 | 1.219 | 0.940 | 1.024 |
| 4 | 7-DCCA in CDAB | 0.350 | 0.32 | 0.260 | 0.68 | 1.240 | 0.925 | 1.161 |
| 5 | 7-DCCA in DTAB + urea | 0.345 | 0.26 | 0.220 | 0.74 | 1.025 | 0.815 | 1.191 |
| 6 | 7-DCCA in TTAB + urea | 0.310 | 0.29 | 0.320 | 0.71 | 1.462 | 1.135 | 0.996 |
| 7 | 7-DCCA in CTAB + urea | 0.360 | 0.26 | 0.220 | 0.74 | 1.233 | 0.970 | 1.000 |
| 8 | 7-DCCA in CDAB + urea | 0.334 | 0.40 | 0.410 | 0.60 | 1.990 | 1.360 | 1.140 |
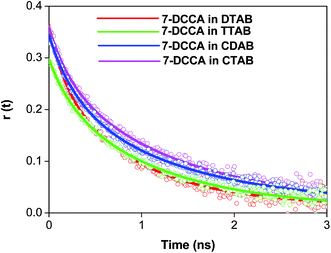 | ||
| Fig. 8 The overlay of time resolved anisotropy decays of 7-DCCA in micellar media. The concentration of surfactants in all cases is 20 times that of their CMC. | ||
4. Discussion
From the steady state absorption spectra, it appears that the strong electrostatic interaction between the dye molecule and the positively charged Stern layer of the micelles are mainly responsible for the blue shift of the absorption maxima. Beside this, the less polar environment of the micellar interface plays a role in the blue shifting of the absorption maxima. Chakrabarty et al. observed that the absorption spectra of Coumarin-480 was red shifted with the addition of the same surfactants in an aqueous solution of the dye.22 Coumarin-480 is comparatively more hydrophobic in nature than 7-DCCA. Moreover, the strong hydrogen bonding interaction in between the water molecule present at the Stern layer and the 7-DCCA dye is responsible for the blue shift of the absorption maxima. We have previously reported that the hydrogen bonding interaction between 7-DCCA with the medium causes the blue shift of the absorption spectra.34For 7-DCCA, the ICT state is the main emissive species and the TICT state is non-emissive in nature.30 When micelles are formed, the dye molecules attach to the positively charged Stern layer by forming strong hydrogen bonds with the water molecules. Due to this reason, we observe a blue shift in the absorption and emission maxima of 7-DCCA compared to that in neat water. A strong electrostatic interaction between the negatively charged dye molecule and the positively charged Stern layer also operates. The local polarity of the micellar surface is always lower than the bulk water.37–41 Therefore, the TICT state formation of the 7-DCCA molecule is inhibited. So, the fluorescence intensity and the fluorescence quantum yield increases in micelles, together with the blue shift of the emission spectra. The same explanation holds good for describing the increase in the fluorescence quantum yield and intensity for all micellar media. We have seen that compared to DTAB and TTAB, the fluorescence quantum yield of 7-DCCA is higher in CDAB and CTAB micelles. The polarity of the micellar interface or Stern layer decreases with the gradual increase in the chain length of the surfactant. These decreases of polarity are responsible for the increase in the fluorescence quantum yield. With the gradual increase in micellar size, the hydration of the micelle decreases and water penetration inside the micellar medium occurs.37 Therefore, the electrostatic interaction of 7-DCCA with the positively charged Stern layer increases. This causes an increase in the fluorescence quantum yield with the gradual increase in the chain length of the surfactant. The fluorescence emission maximum and quantum yield remain almost same in all micellar systems after the addition of 7 (M) urea. A slight increase of the fluorescence quantum yield occurs after the addition of 7 (M) urea in the micellar solution of DTAB and TTAB. Since the addition of urea decreases the polarity and increases the viscosity of the micellar interfaces.42 The emission maximum of 7-DCCA in isooctane appears at ∼420 nm. As isooctane is a nonpolar solvent, so in isooctane the emission maximum is expected to be the same, if 7-DCCA resides at the hydrophobic core of the micelle. However, it is observed that the fluorescence emission intensity of 7-DCCA in all micellar media at 420 nm is very much less compared to that at 456 nm (I456![[thin space (1/6-em)]](https://www.rsc.org/images/entities/char_2009.gif) :
:![[thin space (1/6-em)]](https://www.rsc.org/images/entities/char_2009.gif) I420 = 7
I420 = 7![[thin space (1/6-em)]](https://www.rsc.org/images/entities/char_2009.gif) :
:![[thin space (1/6-em)]](https://www.rsc.org/images/entities/char_2009.gif) 1). This indicates that most of the dye molecules reside at the surface of the micelles.
1). This indicates that most of the dye molecules reside at the surface of the micelles.
7-DCCA exhibits a fast component of 130 ps with a population of 99.5%, and a slow component of 2.759 ns with a population of 0.5% in neat water. The origin of these components has been described in our previous study.34 The most interesting part is that Coumarin 343, the rigid analogue of 7-DCCA, shows only one component in water. This is contrary to the biexponential decay of 7-DCCA in neat water.43 However, nonrigid Coumarin dyes such as C-481 (ref. 44) and C1 (ref. 45) show multiexponential decays; whereas, a rigid dye such as C-102 shows a single exponential decay in water.45 Therefore, for the nonrigid Coumarin dye 7-DCCA, this biexponential decay in water is a common phenomenon. With the gradual addition of surfactant, only one component survives and the other component is wiped out. 7-DCCA is a hydrophilic molecule; it shows little probability to reside inside the hydrophobic micellar core. Therefore, the fluorescence emission decay was well fitted by the single exponential function in the micellar solution. In a micellar medium, the single exponential decay characteristic is not an unusual behaviour. Previously, Kumbhakar et al. have studied the photophysical behavior of C-153 in TX-100 micellar medium, and found a single exponential decay in the micellar medium. They interpreted this on the basis of solubilisation of the dye at similar sites of different micelles.46 Several reports are available in the literature where a single exponential decay of Coumarin dyes in the micellar media have been observed.47,48 The time resolved emission study indicates that with the gradual increase in the alkyl chain length of the surfactant, the fluorescence decay time increases. We know that water molecules can penetrate up to a certain distance in micelles.49,50 The greater the compactness of the micellar head group, the smaller will be the probability of the water penetration inside the micelle. So, with the gradual increase in alkyl chain length, hydration of the micelle decreases.48 Therefore, the binding interaction also increases. Probe penetration inside the micelle is unlikely to take place, since the dye remains in water solution in the anionic form, therefore, preventing the penetration of 7-DCCA inside the hydrophobic environment of micelles. So unlike other cases, probe penetration deep inside of the micelle is prevented. Therefore, the increase in the binding constant value is not due to the probe penetration mechanism. Moreover, with the gradual increase in surfactant chain length, the compactness of the micelle increases. This prevents incorporation of the probe inside the micelle core. The change of micelle head group in CDAB causes a certain decrease of compactness of the micelle. It is found that, in case of the CDAB micelle, the binding constant value is higher than DTAB and TTAB micelles.
One question to ask is “are the changes in spectral properties due to the effect of micellisation or due to the interaction of negatively charged dye with ions?” To know this we have studied the absorption, steady state and time resolved emission properties of 7-DCCA in the presence of tetramethylammonium bromide. The spectral properties of 7-DCCA remained unchanged. These result reject the possibility of the spectral changes of 7-DCCA being due to the interaction with ions without forming micelles. It is observed that the addition of 7 (M) urea to the aqueous micellar solution of 7-DCCA causes an increase in the fluorescence decay time. Chakrabarty et al. reported that the addition of urea could be able to eradicate norharmane (NHM) from the surface of micelles.51 Our study does not provide the same result. In our case, we have observed that the addition of 7 (M) urea causes the increase in fluorescence decay lifetimes (Table 2). This indicates that the addition of urea does not cause the eradication of the 7-DCCA molecule from the micelle surface to the bulk water. If the eradication of the dye in the bulk medium would have taken place, then the fluorescence emission quantum yield and decay time should have decreased. It is probably due to the fact that the addition of urea causes the driving out of the water molecule from the surface of micelles. Baglioni et al. studied the effect of urea on sodium dodecyl sulfate and dodecyltrimethylammoium bromide micellar solutions by using electron spin resonance spectroscopy.42 They reported that the addition of urea causes the displacement of water molecules, which then solvate the hydrophobic chain and polar head group of the micelles. We can expect similar effects to be operative here. So the removal of water with the addition of urea from the micellar surface opens up the naked charged surface of the micelle. These further strengthen the interaction between the dye and the micelles. So, dye faces more restricted environment, causing the increase of fluorescence decay time. One more aspect to be noted here is that the addition of urea causes the increase of microviscosity at the micellar interface.42,52–54 Urea increases the viscosity of the micellar interface from 20% to 100%, depending upon the nature of the surfactant.52 This increase in viscosity at the micellar surface may be another reason for the increase of fluorescence decay lifetime. Our result is different from the results obtained in several previous studies. Banerjee et al.55 studied the photophysical properties of 5-((3aS,7aR)-1-(4-bromophenyl)-3a,4,5,6,7,7a-hexahydro-1H-4,7-methano-indazol-3-yl)-3-methyl-1-phenyl-1H-pyrazole-4-carbonitrile in anionic (SDS), cationic (CTAB), and neutral (TX-100) micelles. They studied the effects of urea on the steady state fluorescence spectra and relaxation dynamics of the dye bound to the micelles. They reported that the addition of urea caused the destabilisation of the micellar environment, de-solvation, and the repulsion of the dye from the micellar surface to the bulk water phase. They showed that in the presence of urea, the fluorescence lifetime decreased from that in a micellar environment.55 Hierrezuelo et al. also reported similar effects with urea.56 These results are completely opposite to our observation.
It is widely accepted that urea may act on micelles by two different mechanisms. One of which is the indirect mechanism. Here, urea changes the structure of interfacial water and consequently facilitates the solvation of the hydrocarbon alkyl chain of the surfactant.57,58 Another mechanism is the direct mechanism. Here, urea itself participates in the solvation process by replacing some water molecules, which then solvates both the hydrophobic alkyl chain and also the polar head group of the surfactant molecules.59–61 In our study, the gradual addition of urea causes an increase in the fluorescence lifetime. Therefore, the first mechanism is unlikely to play any role, because the increase in hydration of the alkyl chains of the surfactant causes a decrease in the hydrophobic nature of the micellar phase, and therefore, an increase in the local polarity of the micellar medium. Here we found a decrease in the fluorescence intensity of 7-DCCA with the addition of urea in the micellar solution. This implies that the addition of urea causes eradication of 7-DCCA molecules from the micellar surfaces. The increase of fluorescence decay time after the addition of urea reflects a different mechanism. The addition of 7 (M) urea increases the solution volume, which causes the dilution of the medium, causing a decrease in the fluorescence intensity. The absorption and emission spectral maxima positions remain almost the same after the addition of urea. These observations reflect that the addition of urea does not cause the eradication of dye from the micellar surface. The addition of urea mainly causes the driving out of some water molecules from the micellar surface, and this driving out causes the opening of the polar head group to be available for direct interaction between the dye and the surfactant head group, and also causes the increase in the microviscosity42,53,54 of the micellar interface. Previously, Ruiz et al. demonstrated that the addition of urea increases the microviscosity of the CTAB micellar medium53 and SDS micellar medium.54 A similar increase of microviscosity is found to be operative after the addition of 7 (M) urea. Moreover, Ruiz demonstrated that the gradual addition of urea caused an increase in the degree of counterion dissociation in the case of CTAB micelle.53 The same is expected to be operative for the other micelles, also causing the strengthening of the interactions between the dye and micelle. This imposes a greater restriction on the dye, thereby causing the increase in the fluorescence lifetime, and decreases in the nonradiative decay rate constant in micellar solutions.
Telgmann and Kaatze extensively studied the structure and dynamics of micelles by using ultrasonic absorption and found three relaxation time scales in the long (μs), intermediate (10 ns), and fast (0.1–0.3 ns) ranges.62 They dedicated the fastest component to the rotation of alkyl chains of the surfactant molecules in the core of the micelles. The slowest component is associated with the exchange of surfactant monomer between micelles and bulk medium.62 However; they did not assign the intermediate relaxation time to any particular motion. We have previously mentioned that the dye 7-DCCA molecule resides in the Stern layer of the micelles. So the main participants that encourage the solvation are the ionic head groups of the surfactants, the counter ions, and water molecules.63 The dynamics of the alkyl chains of the surfactants are found to take place in a 100 ns timescale, as obtained from ESR studies.64,65 Bagchi et al. developed a model using large-scale atomistic molecular dynamics simulations. They classified the interfacial water molecule into two broad categories, one of which is free and another one is bound. They further classified the micellar surface bound water into two categories. The first category includes interfacial water molecules, which form one hydrogen bond to one polar head group of the surfactant. The other category includes interfacial water molecules, which form two hydrogen bonds with two different polar head groups.66 This is also reflected in our study, where the fast component of the solvation time does not change in a regular way with increasing the length of the alkyl chain, as shown in the Table 3. However, the slow component gradually increases with the gradual increase in chain length. This shows that with the gradual increase in the polar head-group density, as well as the charge density in the Stern layer, the slow component gets slower. The slow component of solvation time in the case of CDAB micelle is 620 ps. This is ∼2 times faster than the slow component of solvation in CTAB micelles, whereas the fast component remains the same. On going from the DTAB to the CTAB micelle, the weight percentage of the slow component decreases from 43% to 30%, and the time constant of the slow component increases. In the CDAB micelle, the solvent relaxation time is smaller than in the CTAB micelle. In CDAB, the surfactant head group is bulkier than that of CTAB. This causes comparatively less compact micelles to be formed by CDAB compared to CTAB. So the charge density at the Stern layer is less for the CDAB micelle compared to CTAB. The gradual increase in alkyl chain length causes an increase in charge density. This causes a decrease in the mobilisation of the interfacial water molecules, and hence, the solvent relaxation gradually gets slower with the gradual increase of alkyl chain length. Our proposition has support from the work of Shirota et al.67 They showed that this immobilisation of water causes the increase of viscosity at the micellar surface with the gradual increase of the alkyl chain length. Zana et al.,68 reported that the increase in the alkyl chain length causes the increase of the microviscosity. This is the probable reason for the decrease of weight percentage of the slow component and the increase of the time constant of the slow component with the increase in the alkyl chain length. Due to the presence of bulkier head groups, the CDAB micelles are less compact than CTAB, thus allowing more water penetration inside the micelle, and thereby causing the increase of the weight percentage of the slow component, and the decrease in its timescale value. After the addition of urea, both the slow and fast components are slower for all the micelles. After the addition of urea, the weight percentage of the slow component of the solvation time decreases compared to that in the micellar system. The weight percentage of the fast component increases with respect to that in micellar media. The increase in the timescale values for both the fast and slow components indicates that both kinds of water molecules are present at the micellar interface, and experience a more restricted environment. The decrease of weight percentage of the slow component, together with the increase in its timescale value, proves our previous assumption, that urea drives out some bound water molecules from the interface, leaving a naked polar head group to interact with the anionic dye molecule. The increase in timescale of the bound water molecule is mainly due to the increase in viscosity at the interface imposed by the urea. A similar explanation holds good for the increase in the timescale value of the fast components. Therefore, the increase in viscosity due to the addition of urea on the micellar interface plays a prominent role in changing the solvent relaxation at the micellar interface.
Due to the limited time resolution of our instrument, we are missing the initial part of the rotational relaxation dynamics. So the anisotropy data starts from less than 0.4 (Table 4). The biexponential anisotropy decays of 7-DCCA in these micellar media is mainly due to several motions. To explain the biexponential nature of the anisotropy decay of 7-DCCA in these micellar media, a two-step model and a wobbling-in-cone model were used.69–73 The detailed procedure and equations involved in these model is described in the ESI.† It is observed that in the case of the DTAB micelle, the τL value is 1 ns, and it increases to 1.224 ns in the case of the TTAB micelle. In the case of the CTAB micelle, this value rises to 1.290 ns. For the CDAB micelle, the τL value is almost the same compared to the CTAB micelle. This indicates that the change of head group does not affect the lateral diffusion along the micellar surface. From the DTAB to the CTAB micelle, the time for the lateral diffusion over the curved micellar surface increases. This implies that with increasing the chain length, more restriction is imposed on the dye. In the micellar media, the value of S is ∼0.8. This indicates a highly restricted environment faced by the dye molecule at the micellar interface. We have calculated the time constant for the wobbling motion of the dye inside an imaginary cone of a semi-cone angle θ°. We observed that for the TTAB, CTAB, and CDAB micellar systems, the time constants of the wobbling-in-cone motion are higher than DTAB, although the change of time constants (τw) with chain length of the alkyl chain is irregular. These values are tabulated in Table S1.† The values of the semi-cone angle θ° and the wobbling diffusion coefficient Dw are also tabulated in Table S1.† In all the micelles, the increase of rotational relaxation time after the addition of 7 (M) urea is mainly due to the increase in the microviscosity at the micellar interface. These increases of rotational relaxation time upon the addition of urea have been previously reported in literature, although in that case the fluorescence decay time decreased with the addition of urea.74 The addition of urea changes the size of the micelles and increases the bulk viscosity of the media. For all micelles studied, we have observed that τslow ≪ τM. Thus for these systems, the rotational relaxation time of the entire micelles make very little contribution to the overall anisotropy decay, or indeed, almost no contribution. Thus, in this case, the τslow is mainly guided by the value of τL. The increase in rotational relaxation time is due to the fact that the addition of urea does not cause the eradication of the dye from the micellar surface, and provides confirmation of the direct mechanism of the interaction of urea with micelles.
5. Conclusion
The photophysical properties of 7-DCCA in different micellar media have been studied in this article. We have shown that increasing the chain length of the surfactant causes increases in the fluorescence quantum yield, fluorescence decay time, solvent relaxation time, and the rotational relaxation time. The increase in chain length causes an increase in the binding interaction between the dye 7-DCCA with the micellar media. We hypothesize that increasing the chain length imposes more restriction on the dye attached to the Stern layer of the micelles by means of hydrogen bonding with water and by electrostatic interaction. The addition of urea imposes more restriction over the dye bound to the micellar surface, causing a further increase of the fluorescence decay time, solvent relaxation time, and rotational relaxation time. Therefore, the addition of urea does not cause the removal of the dye from the micellar surface to the bulk water. These results support the hypothesis that a direct mechanism of urea action is operating.Acknowledgements
D.S is thankful to IIT Patna, India for research facilities. A. C. is thankful to CSIR, New Delhi, for research fellowship. B. M is thankful to IIT Patna, for research fellowship.References
- P. Hazra, D. Chakrabarty and N. Sarkar, Langmuir, 2002, 18, 7872 CrossRef CAS.
- M. Cigáň, J. Donovalová, V. Szöcs, J. Gašpar, K. Jakusová and A. Gáplovský, J. Phys. Chem. A, 2013, 117, 4870 CrossRef PubMed.
- A. Chatterjee, B. Maity and D. Seth, Phys. Chem. Chem. Phys., 2013, 15, 1894 RSC.
- P. S. Song and W. H. Gordon, J. Phys. Chem., 1970, 74, 4234 CrossRef CAS.
- J. S. de Melo and P. F. Fernandes, J. Mol. Struct., 2001, 565–566, 69 CrossRef.
- C. Vijila, A. Ramalingam, P. K. Palanisamy and V. Masilamani, Spectrochim. Acta, Part A, 2001, 57, 491 CrossRef CAS.
- S. Kumar, R. Giri, S. C. Mishra and M. K. Machwe, Spectrochim. Acta, Part A, 1995, 51, 1459 CrossRef.
- A. Ramalingam, B. M. Sivaram, P. K. Palanisamy and V. Masilamani, Spectrochim. Acta, Part A, 2000, 56, 1205 CrossRef CAS.
- W. Jarzqba, G. C. Walker, A. E. Johnson, M. A. Kahlow and P. F. Barbara, J. Phys. Chem., 1988, 92, 7039 CrossRef.
- K. Bhattacharyya, Proc. Indian Natl. Sci. Acad., 2000, 66, 199 CAS.
- N. Sarkar, A. Datta, S. Das and K. Bhattacharyya, J. Phys. Chem., 1996, 100, 15483 CrossRef CAS.
- K. Bhattacharyya, Acc. Chem. Res., 2003, 36, 95 CrossRef CAS PubMed.
- N. Nandi and B. Bagchi, J. Phys. Chem. B, 1997, 101, 10954 CrossRef CAS.
- A. Datta, D. Mandal, S. K. Pal, S. Das and K. Bhattacharyya, J. Mol. Liq., 1998, 77, 121 CrossRef CAS.
- D. Mandal, S. Sen, K. Bhattacharyya and T. Tahara, Chem. Phys. Lett., 2002, 359, 77 CrossRef CAS.
- H. Shirota, Y. Tamoto and H. Segawa, J. Phys. Chem. A, 2004, 108, 3244 CrossRef CAS.
- K. Hara, H. Kuwabara and O. Kajimoto, J. Phys. Chem. A, 2001, 105, 7174 CrossRef CAS.
- P. Sen, S. Mukherjee, A. Halder and K. Bhattacharyya, Chem. Phys. Lett., 2004, 385, 357 CrossRef CAS PubMed.
- D. Chakrabarty, P. Hazra and N. Sarkar, J. Phys. Chem. A, 2003, 107, 5887 CrossRef CAS.
- J. Humpolíčková, M. Sÿtěpánek, K. Procházka and M. Hof, J. Phys. Chem. A, 2005, 109, 10803 CrossRef PubMed.
- R. Sarkar, M. Ghosh and S. K. Pal, J. Photochem. Photobiol., B, 2005, 78, 93 CrossRef CAS PubMed.
- D. Chakrabarty, A. Chakraborty, D. Seth, P. Hazra and N. Sarkar, J. Chem. Phys., 2005, 122, 184516 CrossRef PubMed.
- A. Maciejewski, J. Kubicki and K. Dobek, J. Phys. Chem. B, 2003, 107, 13986 CrossRef CAS.
- D. Seth, S. Sarkar and N. Sarkar, Langmuir, 2008, 24, 7085 CrossRef CAS PubMed.
- C. D. Bruce, S. Senapati, M. L. Berkowitz, L. Perera and M. D. E. Forbes, J. Phys. Chem. B, 2002, 106, 10902 CrossRef CAS.
- S. Balasubramanian and B. Bagchi, J. Phys. Chem. B, 2001, 105, 12529 CrossRef CAS.
- S. Balasubramanian and B. Bagchi, J. Phys. Chem. B, 2002, 106, 3668 CrossRef CAS.
- S. G. Dastidar and C. Mukhopadhyay, Phys. Rev. E: Stat., Nonlinear, Soft Matter Phys., 2004, 70, 061901 CrossRef.
- S. Pal, B. Bagchi and S. Balasubramanian, J. Phys. Chem. B, 2005, 109, 12879 CrossRef CAS PubMed.
- G. Ramakrishna and H. N. Ghosh, J. Phys. Chem. A, 2002, 106, 2545 CrossRef CAS.
- H. Zhang, T. Yu, Y. Zhao, D. Fan, L. Chen, Y. Qiu, L. Qian, K. Zhang and C. Yang, Spectrochim. Acta, Part A, 2008, 69, 1136 CrossRef PubMed.
- C. Tablet, I. Matei, E. Pincu, V. Meltzer and M. Hillebrand, J. Mol. Liq., 2012, 168, 47 CrossRef CAS PubMed.
- A. Chatterjee, B. Maity and D. Seth, RSC Adv., 2014, 4, 13989 RSC.
- A. Chatterjee and D. Seth, Photochem. Photobiol., 2013, 89, 280 CrossRef CAS PubMed.
- G. Jones II, W. R. Jackson, C. Y. Choi and W. R. Bergmark, J. Phys. Chem., 1985, 89, 294 CrossRef.
- G. B. Dutt, J. Phys. Chem. B, 2004, 108, 805 CrossRef CAS.
- R. Das, G. Duportail, L. Richert, A. Klymchenko and Y. Mély, Langmuir, 2012, 28, 7147 CrossRef CAS PubMed.
- C. A. Bunton, N. D. Gillitt, M. M. Mhala and J. R. Moffatt, Croat. Chem. Acta, 2001, 74, 559 CAS.
- K. A. Zachariasse and B. Kozankiewicz, J. Phys. Chem., 1981, 85, 2676 CrossRef CAS.
- C. Ramachandran, R. A. Pyter and P. Mukerjee, J. Phys. Chem., 1982, 86, 3198 CrossRef CAS.
- L. P. Novaki and O. A. El Seoud, Langmuir, 2000, 16, 35 CrossRef CAS.
- P. Baglioni, E. R. Minten, L. Dei and E. Ferronis, J. Phys. Chem., 1990, 94, 8218 CrossRef CAS.
- H. N. Ghosh, J. Phys. Chem. B, 1999, 103, 10382 CrossRef CAS.
- P. Verma and H. Pal, J. Phys. Chem. A, 2012, 116, 4473 CrossRef CAS PubMed.
- R. W. Yip, Y. X. Wen and A. G. Szabo, J. Phys. Chem., 1993, 97, 10458 CrossRef CAS.
- M. Kumbhakar, T. Goel, T. Mukherjee and H. Pal, J. Phys. Chem. B, 2005, 109, 18528 CrossRef CAS PubMed.
- M. Kumbhakar, T. Goel, T. Mukherjee and H. Pal, J. Phys. Chem. B, 2005, 109, 14168 CrossRef CAS PubMed.
- M. Kumbhakar, S. Nath, H. Pal, A. V. Sapre and T. Mukherjee, J. Chem. Phys., 2003, 119, 388 CrossRef CAS PubMed.
- N. Muller, in Reaction Kinetics in Micelles, ed. E. A. Cordes, Plenum Press, New York, 1973 Search PubMed.
- S. Ben, R. R. M. Jones and J. S. Johnson, Jr, J. Phys. Chem., 1992, 96, 5611 CrossRef.
- A. Chakrabarty, P. Das, A. Mallick and N. Chattopadhyay, J. Phys. Chem. B, 2008, 112, 3684 CrossRef CAS PubMed.
- P. Baglioni, E. Ferroni and L. Kevan, J. Phys. Chem., 1990, 94, 4296 CrossRef CAS.
- C. C. Ruiz, Mol. Phys., 1995, 86, 535 CrossRef.
- C. C. Ruiz, Colloids Surf., A, 1999, 147, 349 CrossRef CAS.
- P. Banerjee, S. Pramanik, A. Sarkar and S. C. Bhattacharya, J. Phys. Chem. B, 2008, 112, 7211 CrossRef CAS PubMed.
- J. M. Hierrezuelo, J. A. Molina-Bolívar and C. C. Ruiz, J. Phys. Chem. B, 2009, 113, 7178 CrossRef CAS PubMed.
- H. S. Frank and F. Franks, J. Chem. Phys., 1968, 48, 4746 CrossRef CAS PubMed.
- O. D. Bonner, J. M. Bednarek and R. K. Arisman, J. Am. Chem. Soc., 1977, 99, 2898 CrossRef CAS.
- Y. Nozaki and C. Tanford, J. Biol. Chem., 1963, 238, 4074 CAS.
- O. Enea and C. Jolicoeur, J. Phys. Chem., 1982, 86, 3870 CrossRef CAS.
- M. Roseman and W. P. Jencks, J. Am. Chem. Soc., 1975, 97, 631 CrossRef CAS.
- T. Telgmann and U. Kaatze, J. Phys. Chem. A, 2000, 104, 1085 CrossRef CAS.
- K. Bhattacharyya and B. Bagchi, J. Phys. Chem. A, 2000, 104, 10603 CrossRef CAS.
- R. Cassol, M. T. Ge, A. Ferrarini and J. H. Freed, J. Phys. Chem. B, 1997, 101, 8782 CrossRef CAS.
- H. M. S. Suh and L. Kevan, J. Phys. Chem. A, 1997, 101, 1414 CrossRef.
- S. Pal, S. Balasubramanian and B. Bagchi, J. Phys. Chem. B, 2003, 107, 5194 CrossRef CAS.
- Y. Tamoto, H. Segawa and H. Shirota, Langmuir, 2005, 21, 3757 CrossRef CAS PubMed.
- R. Zana, J. Phys. Chem. B, 1999, 103, 9117 CrossRef CAS.
- E. L. Quitevis, A. H. Marcus and M. D. Fayer, J. Phys. Chem., 1993, 97, 5762 CrossRef CAS.
- G. Lipari and A. Szabo, Biophys. J., 1980, 30, 489 CrossRef CAS.
- G. Lipari and A. Szabo, J. Chem. Phys., 1981, 75, 2971 CrossRef CAS PubMed.
- G. Lipari and A. Szabo, J. Am. Chem. Soc., 1982, 104, 4546 CrossRef CAS.
- K. Kinosita, S. Kawato and A. Ikegami, Biophys. J., 1977, 20, 289 CrossRef CAS.
- H. Raghuraman, S. K. Pradhan and A. Chattopadhyay, J. Phys. Chem. B, 2004, 108, 2489 CrossRef CAS.
Footnote |
| † Electronic supplementary information (ESI) available. See DOI: 10.1039/c4ra02532f |
| This journal is © The Royal Society of Chemistry 2014 |

