Fabrication of multi-functional PVDF/RGO composites via a simple thermal reduction process and their enhanced electromagnetic wave absorption and dielectric properties

Xiao-Juan Zhanga, Guang-Sheng Wang*a, Wen-Qiang Caob, Yun-Zhao Weia, Mao-Sheng Caob and Lin Guo*a
aKey Laboratory of Bio-Inspired Smart Interfacial Science and Technology of Ministry of Education, School of Chemistry and Environment, Beihang University, Beijing 100191, PR China. E-mail: wanggsh@buaa.edu.cn; guolin@buaa.edu.cn
bSchool of Materials Science and Engineering, Beijing Institute of Technology, Beijing 100081, China

Received 9th March 2014 , Accepted 15th April 2014

First published on 16th April 2014


Abstract

Polymer-composites of polyvinylidene fluoride (PVDF) and reduced graphene oxide (RGO) have been prepared from PVDF/GO membrane by a simple hot-molding technique. The specific interaction between oxygen-containing functional groups in the GO surface and fluorine groups in PVDF allows the GO to disperse into PVDF homogeneously and it can be thermally reduced into RGO after a hot-press process. Several characterizations such as AFM, XRD, FT-IR and Raman have been employed to confirm the thermally reduced process from GO to RGO in the composite. The enhanced absorption and dielectric properties were investigated; the results indicated that for the composites with a low filler loading of 3 wt%, the maximum reflection loss of the PVDF/RGO composite can reach −25.6 dB at 10.8 GHz, and the frequency bandwidth less than −10 dB is from 8.48 to 12.80 GHz, while, when the filler is 3 wt%, the dielectric constant can reach 3801 (103 Hz). The enhanced mechanism has been also explained in detail.

Introduction

Since its discovery in 2004,1 graphene has received considerable attention and research interest due to its its excellent electrical and thermal conductivity, superior mechanical properties, as well as large surface area.2,3 In addition, there is increasing interest in the research on its related materials, such as graphene oxide (GO) and reduced graphene oxide (RGO).4 GO is the exfoliated product of graphite oxide, which is prepared by a modified Hummers method from graphite power. Then GO can be transformed into RGO by chemical,5,6 thermal,7,8 and electrochemical9 reductions. However, one major challenge in the preparation of graphene is to overcome its easily irreversible agglomeration or even restacking as results of strong van der Waals interaction and the out-of-plane π bond between the individual graphene nanosheet. While for GO, after the oxidation reaction, oxygen-containing functional groups like epoxy, hydroxyl, carboxy and carbonyl groups are located either on the basal plane or on the edge of the single atom-thin sheet. The presence of these functional groups makes graphene oxide sheets be strongly hydrophilic, which allows graphite oxide to swell and disperse in various polar solvent readily.10

Recently, with the increasing usage of electromagnetic wave devices such as wireless communication tools, local area networks, personal digital assistants and other communication equipment, there are some serious electromagnetic interference (EMI) and electromagnetic compatibility (EMC) problems have emerged.11,12 Thus, to decrease electromagnetic radiation, the electromagnetic wave absorbing material has attracted much attention. This absorber can attenuate the electromagnetic energy through its dielectric loss or magnetic loss, and the most recent research is focused on the electromagnetic properties in the range of 2–18 GHz. Many microwave absorbing materials have been reported, such as Shimba et al.13 fabricated polymer composites containing amorphous Fe–B submicrometer particles and Ni–Zn ferrite nanoparticles. This composite exhibited good microwave absorption properties (RL < −20 dB) in the frequency range of 0.65–1.12 GHz for absorber thickness of 2.38–4.06 mm. In addition, there are many nanostructures, such as CeO2,14 ZnO nanostructures,15 β-MnO2 nanorods,16 3D α-MnO2,17 CuS nanostructures18–20 and SiC fibers21 have been reported as microwave absorption materials. To date, much attention is being paid to carbon-based materials in electromagnetic wave absorption field, especially for carbon nanosheets and graphene nanocomposites. For example, Fan et al.22 reported that the reflection loss (RL) peak value of flaky graphite was −25.5 dB at about 14.4 GHz. Li et al.23 investigated the electromagnetic (EM) wave absorption properties of La-doped BaTiO3/MWCNT nanocomposites in the 7.5–18 GHz frequency range for an absorber thickness of 1 mm. When this nanocomposite doped with 1.5 at.% La3+, an RL exceeding −5 dB for this sample was obtained in the frequencies ranging from 9.6 to 16.3 GHz, with the optimal RL of −17.4 dB at 10.9 GHz. Cao et al.24 studied the microwave absorption property of Ni–C monolith composite at various loadings of nickel (10–30 wt%). Among these, the composite with an 18.2 wt% loading of Ni had a strong absorption peak at 13.7 GHz and achieved a maximum absorption value of −23.6 dB. Singh et al.25 synthesized reduced graphene oxide (RGO)/nitrile butadiene rubber (NBR) composite with 10 wt% of the resultant graphene which had an effective absorption (>10 dB) over a wide frequency range between 7.5 and 12 GHz and the maximum loss was −57 dB at 9.6 GHz when the thickness was 3 mm. Apart from these, Wang et al.26 made a conclusion that the chemically reduced graphene oxide have showed enhanced microwave absorption compared with graphite and carbon nanotubes, and could be expected to display better absorption than high quality graphene. Moreover, in the previous report, most scientific researchers use paraffin as matrix when they do such EM absorption measurement. This will restrict the practical application of materials immensely. In order to solve this problem, our group selected PVDF, which possessed certain flexibility as matrix. And based on our previous research,18–20,27 we found a synergic effect between nanomaterials and PVDF in microwave absorption area. Meanwhile, the functional groups on the surface of GO could promote GO combined with PVDF better, forming polarized interface that would enhance the EM wave absorption ability and dielectric properties.

On the other hand, in the dielectric materials field at the frequency from 102 to 106 Hz, graphene-based nanocomposites have been confirmed that it can enhance the dielectric properties due to the percolation theory,28,29 and it is a promising way to improve the dielectric constant of the polymers. For the composites, the effective dielectric constant of polymer composites can be improved dramatically as the concentration of filler approaches the percolation threshold. Based on percolation theory, Wang et al.30 fabricated the reduced graphene oxide/polypropylene (RGO/PP) composites. With an ultralow percolation threshold as low as 0.033 vol%, the dielectric permittivity of the composite was 160 and 40 at 102 Hz and 103 Hz, respectively. For poly(arylene ether nitriles) (PEN)/graphene nanosheets (GNs) composites with 5 wt% GNs, the dielectric constant increased to 9.0 compared with that of neat PEN (3.1) and dielectric losses of all nanocomposites were in the range of 0.019–0.023 at 103 Hz.31 He et al.32 prepared graphene nanosheet–Fe3O4 (GNS–Fe3O4)/syndiotactic polystyrene (sPS) composites and investigated their dielectric properties. The composite showed a high dielectric permittivity of 123 (dielectric loss 0.75) at 103 Hz, which was 42 times higher than that of pure sPS in the neighborhood of the percolation threshold with 9.59 vol% GNS–Fe3O4. Dielectric constants as high as 230 and 100 at 102 Hz were observed in poly(vinyl alcohol)-modified RGO (RGO-PVA)/poly(vinylidene fluoride) (PVDF) and reduced graphene oxide (RGO)/poly(vinylidene fluoride) (PVDF) nanocomposites, when the RGO-PVA and RGO were in the percolation thresholds of 2.24 vol% for RGO-PVA/PVDF composites and 0.61 vol% for RGO/PVDF composites, respectively.33 In addition, Cui et al.34 have reported that the composite materials with graphene as conductive filler exhibited a low value of the percolation threshold (4.08 vol%). And the maximum dielectric permittivity of the composite film with 12.5 vol% of graphene fillers achieved 2080 at 102 Hz.

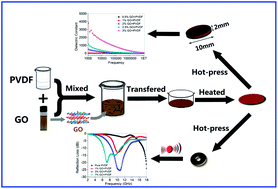
In this paper, we firstly prepared the PVDF/GO solution by a simple blending method. Because of the existence of oxygen-containing groups in GO platelet, they would disperse in PVDF solution homogeneously and could not agglomerate together, and the GO can be translated to RGO by thermal reduction during the hot-molding process. The enhanced absorption and dielectric property of PVDF/RGO composites were also investigated.

Experimental

Graphite power (300 mesh, 99.9999%) was purchased from Alfa Aesar. All other chemicals are of analytical grade and used without further purification.

Preparation of graphene oxide (GO) solution

To prepare graphene oxide, we first need to produce graphite oxide. Graphite oxide was prepared using a modified Hummers method35 from graphite power. Then the product was dispersed in N,N-dimethylformamide (DMF) and sonicated for 2 h under ambient conditions. The dispersion was then centrifuged at 4000 rpm for 30 min. The homogeneous yellow suspension was obtained (shown in Fig. S1).

Preparation of PVDF/GO film

PVDF/GO nanocomposite films were obtained by dissolving PVDF in DMF under magnetic stirring at room temperature and then adding the desired amount of suspended graphene oxide nanosheets in DMF. The mixture was then stirred for 30 min and poured them into glassy petridishes. After that, it was dried in an oven at 90 °C. PVDF/GO films with various GO contents were prepared.

Preparation of PVDF/RGO nanocomposites

To obtain PVDF/RGO composites, the dried PVDF/GO membrane were compressed into specified wafers for wave absorption testing and dielectric measurement by hot-pressing at 200 °C under 6 MPa (pre-pressed for 5 min at the same temperature, released the press for a while, and then repressed for 10 min, followed by cooling to room temperature under the same pressure). The GO can be thermal reduced to RGO through the hot-press process.

Characterization

Atomic force microscopy (AFM) images of GO were taken in the tapping mode by carrying out on DIMENSION icon with ScanAsyst. The sample was prepared by spin-coating sample solutions onto freshly exfoliated mica substrate. XRD analyses were carried out on an X-ray diffractometer (D/MAX-1200, Rigaku Denki Co. Ltd., Japan). The XRD patterns with Cu Ka radiation (λ = 1.5406 Å) at 40 kV and 40 mA were recorded in the range of 2θ = 5–90°. The XRD specimens were prepared by means of flattening the powder on the small slides. FTIR spectra were recorded on FTIR spectrometer-733 (iN10MX). Raman spectra were recorded from 1000 cm−1 to 2000 cm−1 on a LabRAM HR800 Laser Raman spectroscopy (HORIBA Jobin Yvon Co. Ltd., France) by using a 647 nm argon ion laser. The dielectric properties were measured by HP 4294A Impedance meter in the frequency range of 102 to 107 Hz at room temperature. The specimen for dielectric properties measurement were pressed into a cycloidal shaped compact (Φ = 10 mm, d = 2 mm).

EM absorption measurement

The composites used for EM absorption measurement were prepared by mixing the GO with PVDF in different mass percentages. The mixtures were then pressed into cylindrical-shaped samples (Φout = 7.00 mm and Φin = 3.04 mm). The complex permittivity and permeability values were measured in the 2–18 GHz range with coaxial wire method by an Anritsu 37269D network analyzer.

Results and discussion

AFM is a useful tool to determine the thickness of sample. Fig. 1 shows the typical AFM height image of GO with the height profile. GO nanosheets are flat and its average thickness is about 0.8707 nm, indicating that GO nanosheets exist in DMF solution with exfoliated structure.
image file: c4ra02040e-f1.tif
Fig. 1 AFM image and section analysis of GO nanosheets.

The distance between two layers is an important parameter to evaluate the structural information of samples. As shown in Fig. 2, compared with the XRD patterns of graphite and GO, the d-spacing of the GO is about 0.89 nm (2θ ≈ 9.92°), which is significantly larger than the d(002) value of graphite (d ≈ 0.34 nm, 2θ ≈ 26.48°). The change of d-spacing between graphite and GO is due to the existence of oxygen-containing functional groups which are located either on the basal plane or on the edge of the single atom-thin graphene oxide sheet, indicating the graphite has been oxidized and exfoliated effectively. On the other hand, to demonstrate whether the GO can be reduced to RGO effectively during hot-molding process, the XRD pattern of PVDF/RGO has been shown in Fig. S2. The absence of X-ray diffraction peak for PVDF/RGO around 10° indicate that GO has been reduced to RGO.


image file: c4ra02040e-f2.tif
Fig. 2 X-Ray diffraction pattern of graphite and GO.

Fig. 3 shows the FT-IR spectra of GO, the PVDF membrane and the PVDF/RGO wafer with 3 wt% GO. The broad band of GO spectrum in a range from 3000 to 3600 cm−1 is due to O–H stretching vibrations of carboxyl groups and the absorbed water molecules. For O–H of carboxylic groups, the flexural vibration shows at 1420 cm−1. The peak at 1220 cm−1 can be assigned to the epoxy C–O–C stretching vibration. The characteristic peak for C[double bond, length as m-dash]O stretching vibration appears at 1730 cm−1. The C[double bond, length as m-dash]C skeletal stretching vibration appears at 1622 cm−1. Fig. 3b shows the FT-IR spectrum of the PVDF membrane. The peaks at 2978, 1400 and 1169 cm−1 can be attributed to the stretching and deformation vibrations of C–H and the C–F stretching vibration, respectively. From the spectrum of PVDF/RGO wafer, except for the stretching and deformation vibrations peaks of C–H and C–F in PVDF, only the peaks of C[double bond, length as m-dash]O stretching vibration and C[double bond, length as m-dash]C skeletal stretching vibration are exist. Moreover, the peaks resulted from O–H stretching vibration and flexural vibration disappear. This is due to the hydrogen bonding interactions between the fluorine of PVDF and the carboxylic groups of GO. And it also confirms that the GO can be reduced effectively.4,36–38


image file: c4ra02040e-f3.tif
Fig. 3 FT-IR spectra of (a) GO, (b) PVDF membrane, (c) PVDF/RGO wafer.

The Raman spectra can reflect some significant structural changes of the carbon framework. As shown in Fig. 4, it is seen that GO exhibits a D band at 1345 cm−1 and a G band at 1602 cm−1, while the corresponding bands of PVDF/RGO wafer are 1332 cm−1 and 1583 cm−1, respectively. As a comparison, the pure PVDF has no Raman signal in the range of 1000–2000 cm−1. The Raman peak (G band) of GO at 1602 cm−1 is mainly assigned to the in-plane displacement of carbon atoms in hexagonal carbon sheets while the peak (D band) at 1345 cm−1 is assigned to disorder in the graphitic structure. The D band of PVDF/RGO wafer at 1332 cm−1 arises from a breathing mode of κ-point photons of A1g symmetry and the G band at 1583 cm−1 arises from the first order scattering of the E2g phonon of sp2 carbon atoms. In addition, the G band of PVDF/RGO wafer red-shifted from 1602 to 1583 cm−1 is due to the recovery of the hexagonal network of carbon atom. And the PVDF/GO wafer shows relatively higher intensity of D to G band (1.05) than that of GO (0.97). This can further confirm that the GO is reduced through the hot-press process.39,40


image file: c4ra02040e-f4.tif
Fig. 4 Raman spectra of (a) PVDF, (b) GO, (c) PVDF/RGO wafer (3 wt%).

The XPS measurements have further indicated the reduction effects from GO to RGO. As shown in Fig. 5a, the main contributions to the spectrum are the C1s, F1s and O1s transitions. In addition, there are O KLL and F KLL Auger electron emissions. Fig. 5b shows the C1s spectra acquired from PVDF, GO and PVDF/RGO samples, respectively. A wide peak centered at 286.3 eV in the binding energy scale (B.E.) and a peak centered at 290.8 eV are associated with –CF2-bonds in PVDF. Also the corresponding peak at 284.6 eV is generally associated with C[double bond, length as m-dash]C bonds. In the XPS spectra of GO, there are two typical peaks at 286.7 eV (C–O) and 284.8 eV (C[double bond, length as m-dash]C). Besides, a small peak appears at 288.5 eV in C1s spectra of PVDF/RGO is attributed to –COOH. And the peak intensities and atomic ratios (O1s/C1s) of PVDF/RGO in the C1s peaks decrease significantly in comparison with those of GO.41–43


image file: c4ra02040e-f5.tif
Fig. 5 XPS spectra of PVDF, GO and PVDF/RGO: (a) survey scan; (b) C1s.

To measure the electromagnetic wave absorption properties of PVDF/RGO composite, various contents of GO were mixed with PVDF to form composites, and pressing the mixture into a cylindrical shaped compact (Φout = 7.00 mm and Φin = 3.04 mm) by a simple hot press method. Because of the GO has no magnetism and PVDF is a typical dielectric material, so the main microwave absorbing mechanism of PVDF/RGO composite is dielectric loss. Fig. 6a and b show the frequency dependence of the real part (ε′) and imaginary part (ε′′) of relative complex permittivity (εr = ε′ − ′′) for the PVDF/RGO composites with 0, 1 wt%, 3 wt% and 7 wt% GO. The real permittivity and the imaginary permittivity of the PVDF/RGO have a slight decrease with the increasing frequency and increase with filler loading, which are higher than that of the pure PVDF. The dielectric loss, a ratio of the imaginary permittivity to real permittivity, is plotted in Fig. 6c. From 2–12 GHz the dielectric loss is above 0.40, and also exhibits a strong peak at about 10.8 GHz and 8.72 GHz with a corresponding peak value of 0.58 and 0.76 for 3 wt% PVDF/RGO and 7 wt% PVDF/RGO composites, respectively. The dielectric loss mechanism of the GO is mainly attributed to the relaxation process. And interfacial polarization is one of the most important relaxation process. In general, interface polarization arises when the neighboring phases differ from each other in a dielectric constant, conductivity, or both, at testing frequencies.44 Although there are many functional groups on the surface of GO, which can easily form hydrogen bond with fluorine atoms of PVDF, the interface between GO and PVDF still exists. Therefore, it is the interfacial polarization that causes the difference of polarization process.


image file: c4ra02040e-f6.tif
Fig. 6 Frequency dependence on real part (a); imaginary part (b) and dielectric loss (c) of the permittivity of samples.

It is well known that PVDF is a strong dipole material due to the existence of electrophilic fluorine in its molecular structure. So it may cause electronic dipole polarization. In addition, the dangling band atoms and unsaturated coordination on the surface of PVDF/RGO composite can result in orientational polarization, which is beneficial to dielectric loss.

Because the PVDF/RGO composite is a kind of dielectric loss material, the Debye dipolar relaxation is another important mechanism for the dielectric loss material to absorb microwaves. According to its expression, the relative complex permittivity can be expressed by the following equation,

 
image file: c4ra02040e-t1.tif(1)
where f, εs, ε, and τ are frequency, static permittivity, relative dielectric permittivity at the high-frequency limit, and polarization relaxation time, respectively. Thus, ε′ and ε′′ can be described by
 
image file: c4ra02040e-t2.tif(2)
 
image file: c4ra02040e-t3.tif(3)

According to eqn (2) and (3), the relationship between ε′ and ε′′ can be deduced,

 
image file: c4ra02040e-t4.tif(4)

Thus, the plot of εversus ε′′ would be a single semicircle, which can be defined as the Cole–Cole semicircle. Each semicircle corresponds to one Debye relaxation process. Fig. S3 shows the ε′ − ε′′ curve of the pure PVDF and PVDF/RGO composites (1 wt%, 3 wt% and 7 wt%). One obvious Cole–Cole semicircle was found in the ε′ − ε′′ curve of pure PVDF and several smaller semicircles in PVDF/RGO composites, indicating the existence of Debye relaxation process. The sole relaxation process of PVDF may arise as following: under the alternating electromagnetic field, the lag of induced charges which counters the external applied field results in the relaxation and transfers the electromagnetic energy to heat energy by the motion of electrons, so the microwave can be attenuated.45,46 The obvious dielectric relaxation process of PVDF is due to numerous delocalized electrons. Hence, the dielectric relaxation is the main reason for PVDF to absorb microwave. And for RGO, there are residual defects and groups exist, the sp2-bonded carbon network is partly reconstructed,47 so its conductivity will decrease significantly. Then the dielectric relaxation process that caused by the lag of induced charges becomes not as obvious as that in PVDF. Therefore, the corresponding Cole–Cole semicircle becomes smaller.26

The existed defects and functional groups in RGO are additional two relaxation processes. First, defects can act as polarization centers, which would generate polarization relaxation under the altering electromagnetic field and attenuate electromagnetic wave, resulting in a profound effect on the loss of microwave.48 Second, there are oxygen containing chemical bonds such as C[double bond, length as m-dash]O in the RGO.47 The different abilities to catch electrons between carbon atom and oxygen atom result in electronic dipole polarization, while this kind of dipole polarization is absent for PVDF. Therefore, through the synergic effect, the PVDF/RGO composite will have better microwave absorbing ability.

To study the microwave absorption property, the reflection loss (RLs) of the electromagnetic radiation under the normal incidence of the electromagnetic field was calculated. The normalized input impedance (Zin) is given by:49

 
image file: c4ra02040e-t5.tif(5)
where, εr and μr (for PVDF/RGO, μr is thought as 1), are the complex permittivity and permeability of the composite absorber, respectively; ƒ is the frequency; d is the thickness of the absorber, and c is the velocity of light in free space. The reflection loss (R) is related to Zin as:16
 
image file: c4ra02040e-t6.tif(6)

Thus, the theoretical reflection loss (RLs) of the PVDF and PVDF/RGO composites with filler loading of 1 wt%, 3 wt% and 7 wt% at a thickness of 4.0 mm can be obtained through eqn (5) and (6) (shown in Fig. 7a). It can be seen that the minimum RL decreases and shifts to a lower frequency with increasing filler loading. This is mainly due to the increase of interface between PVDF and RGO. More interfaces will produce more interfacial polarization. And the interfacial polarization can be more easily induced at lower frequency.50 The minimum RL can also be tuned by altering the concentration of the GO. The maximum reflection loss of PVDF/RGO composite reaches 25.6 dB at 10.8 GHz with a loading of 3 wt% when the thickness is 4.0 mm, which is obviously stronger than the reported RGO.26 In the mean time, the composites with a loading of 1 wt% and 7 wt% have a lowest peak at a frequency of 10.08 GHz (−13.1 dB) and 7.2 GHz (−19.9 dB) when the thickness is 4.0 mm, respectively, while all the composites are still as flexible as the pure PVDF and can be cut into different morphologies as you want (Fig. S4).


image file: c4ra02040e-f7.tif
Fig. 7 (a) Microwave RL curves of the composites with a thickness of 4.0 mm in the frequency range of 2–18 GHz. Three-dimensional representations of the RL of (b) PVDF/RGO composites with a loading of 1 wt%; (c) PVDF/RGO composites with a loading of 3 wt%; and (d) PVDF/RGO composites with a loading of 7 wt%.

Fig. 7b–d show the three-dimensional presentations of calculated theoretical RLs of the PVDF/RGO composites with different thickness (2–5 mm) in the range of 2–18 GHz with the loading of 1 wt%, 3 wt% and 7 wt%, respectively. This indicates the microwave absorbing ability of PVDF/RGO composite at different frequency can be tuned by controlling the thickness of the absorbers.

The dielectric properties of PVDF/RGO composites with various GO contents were measured at room temperature (Fig. 8a), the dielectric constant increases with increasing the content of GO. At critical volume concentration fRGO = 3 wt%, the dielectric constant can reach above 280 at a high frequency as 106 Hz even though the dielectric constant decreases with increasing frequency from 103 Hz to 106 Hz. The change of dielectric constant with filled content of GO at 103, 104, 105 and 106 Hz was presented in the Fig. 8b. The curves clearly reveal the percolation threshold of the composite at a critical volume concentration fRGO = 0.03, where the dielectric constant abruptly increases. The dielectric constant of the composites with fRGO = 3 wt% reaches 3801 at 103 Hz, which is 600 times higher than that of the pure PVDF (Fig. S5a). The dielectric loss is about 40, which is much higher than that of the pure PVDF (Fig. S5b). Usually, the introduction of inorganic fillers to a polymer matrix would enhance the dielectric loss values of the composites as reported previously in the case of ZnO.16,51–53 For RGO, residual oxygen-containing functional groups like C[double bond, length as m-dash]O are located either on the basal plane or on the edge of the single atom-thin sheet can increase interface polarization which can also increase the dielectric loss (Fig. S6).


image file: c4ra02040e-f8.tif
Fig. 8 (a) Dielectric constants measured at different frequencies for the PVDF/RGO composites with a fill loading of 0.5 wt%, 1.0 wt%, 2.0 wt%, 2.5 wt% and 3.0 wt% at room temperature; (b) the variation in dielectric constant of different filler contents (wt%) of GO at frequencies of 103, 104, 105 and 106 Hz, respectively.

The enhanced mechanism in dielectric constant of PVDF/RGO nanocomposites can be mainly attributed to the homogenous dispersion of GO in the PVDF polymer matrix. And all the dielectric constants decrease with the increase of frequency. At low frequency, Maxwell–Wagner–Sillars (MWS) polarization for heterogeneous systems plays a very important role in improving the dielectric constant; a lot of charges are blocked at the interfaces between the filler and polymer matrix, owing to the MWS effect, which makes a remarkable contribution to the increment of the dielectric constant. With increasing the frequency from 103 Hz to 106 Hz, the dielectric constants decrease. When the frequency is over 105 Hz, the dielectric constant of the composites is dominated by the microcapacitance–structure model (frequency-independent), the composite with fRGO (0.03) is maintained at a stable value of about 280, which is still much larger than that of pure PVDF.

Conclusion

The multi-functional PVDF/RGO composites have been prepared from PVDF/GO membrane, which is synthesized by PVDF/GO solution instead of suspension in order to avoid agglomeration, by a simple hot-press technique. For the composites with filler loading of 3 wt%, the maximum reflection loss of PVDF/RGO composite can reach −25.6 dB at 10.8 GHz; and the stronger peak can be tuned by the thickness. The main microwave absorbing mechanism of PVDF/RGO composite is dielectric loss caused by relaxation process that includes interfacial polarization, the Debye dipolar relaxation, electronic dipole polarization and orientational polarization. The dielectric constant of the composites with fRGO = 3 wt% can reach 3801 at 103 Hz, which is 600 times higher than that of the pure PVDF, while all the composites are still as flexible as the pure PVDF and can be cut into different morphologies as you want. As a result, the PVDF/RGO composites show enhanced microwave absorption and dielectric properties, which would become a very promising multi-functional composite.

Acknowledgements

This project was financially supported by the National Basic Research Program of China (2010CB934700) and the National Natural Science Foundation of China (no. 51102223, 50725208 and 51132002).

Notes and references

  1. K. S. Novoselov, Science, 2004, 306, 666–669 CrossRef CAS PubMed .
  2. D. Chen, H. Feng and J. Li, Chem. Rev., 2012, 112, 6027–6053 CrossRef CAS PubMed .
  3. X. Huang, Z. Yin, S. Wu, X. Qi, Q. He, Q. Zhang, Q. Yan, F. Boey and H. Zhang, Small, 2011, 7, 1876–1902 CrossRef CAS PubMed .
  4. D. Fan, C. Zhang, J. He, R. Hua, Y. Zhang and Y. Yang, J. Mater. Chem., 2012, 22, 18564–18571 RSC .
  5. D. R. Dreyer, S. Park, C. W. Bielawski and R. S. Ruoff, Chem. Soc. Rev., 2010, 39, 228–240 RSC .
  6. H. Bai, C. Li and G. Shi, Adv. Mater., 2011, 23, 1089–1115 CrossRef CAS PubMed .
  7. R. Larciprete, S. Fabris, T. Sun, P. Lacovig, A. Baraldi and S. Lizzit, J. Am. Chem. Soc., 2011, 133, 17315–17321 CrossRef CAS PubMed .
  8. Q. W. Yuxi Xu, Y. Sun, H. Bai and G. Shi, ACS Nano, 2010, 4, 7358–7362 CrossRef PubMed .
  9. M. U. Okan Oner Ekiz, H. Guner, A. Koray Mizrak and A. Dana, ACS Nano, 2011, 5, 2475–2482 CrossRef PubMed .
  10. S. Stankovich, D. A. Dikin, G. H. B. Dommett, K. M. Kohlhaas, E. J. Zimney, E. A. Stach, R. D. Piner, S. T. Nguyen and R. S. Ruoff, Nature, 2006, 442, 282–286 CrossRef CAS PubMed .
  11. W. Zhu, L. Wang, R. Zhao, J. Ren, G. Lu and Y. Wang, Nanoscale, 2011, 3, 2862 RSC .
  12. H. B. Zhang, Q. Yan, W. G. Zheng, Z. He and Z. Z. Yu, ACS Appl. Mater. Interfaces, 2011, 3, 918–924 CAS .
  13. K. Shimba, N. Tezuka and S. Sugimoto, Mater. Sci. Eng., B, 2012, 177, 251–256 CrossRef CAS PubMed .
  14. H. Wu, L. Wang, Y. Wang and S. Guo, Appl. Surf. Sci., 2012, 258, 10047–10052 CrossRef CAS PubMed .
  15. R. F. Zhuo, H. T. Feng, J. T. Chen, D. Yan, J. J. Feng, H. J. Li, B. S. Geng, S. Cheng, X. Y. Xu and P. X. Yan, J. Phys. Chem. C, 2008, 112, 11767–11775 CAS .
  16. G. S. Wang, L. Z. Nie and S. H. Yu, RSC Adv., 2012, 2, 6216–6221 RSC .
  17. G. S. Wang, S. He, X. Luo, B. Wen, M. M. Lu, L. Guo and M. S. Cao, RSC Adv., 2013, 3, 18009–18015 RSC .
  18. S. He, G. S. Wang, C. Lu, J. Liu, B. Wen, H. Liu, L. Guo and M. S. Cao, J. Mater. Chem. A, 2013, 1, 4685–4692 CAS .
  19. S. He, G. S. Wang, C. Lu, X. Luo, B. Wen, L. Guo and M. S. Cao, ChemPlusChem, 2013, 78, 250–258 CrossRef CAS .
  20. X. J. Zhang, G. S. Wang, Y. Z. Wei, L. Guo and M. S. Cao, J. Mater. Chem. A, 2013, 1, 12115–12122 CAS .
  21. D. Ding, W. Zhou, B. Zhang, F. Luo and D. Zhu, J. Mater. Sci., 2010, 46, 2709–2714 CrossRef .
  22. Y. Fan, H. Yang, M. Li and G. Zou, Mater. Chem. Phys., 2009, 115, 696–698 CrossRef CAS PubMed .
  23. C. Bi, M. Zhu, Q. Zhang, Y. Li and H. Wang, Mater. Chem. Phys., 2011, 126, 596–601 CrossRef CAS PubMed .
  24. N. Li, M. Cao and C. Hu, J. Mater. Chem., 2012, 22, 18426–18432 RSC .
  25. V. K. Singh, A. Shukla, M. K. Patra, L. Saini, R. K. Jani, S. R. Vadera and N. Kumar, Carbon, 2012, 50, 2202–2208 CrossRef CAS PubMed .
  26. C. Wang, X. Han, P. Xu, X. Zhang, Y. Du, S. Hu, J. Wang and X. Wang, Appl. Phys. Lett., 2011, 98, 072906 CrossRef PubMed .
  27. G. S. Wang, X. J. Zhang, Y. Z. Wei, S. He, L. Guo and M. S. Cao, J. Mater. Chem. A, 2013, 1, 7031–7036 CAS .
  28. L. Seveyrat, A. Chalkha, D. Guyomar and L. Lebrun, J. Appl. Phys., 2012, 111, 104904 CrossRef PubMed .
  29. Z. Wang, J. K. Nelson, H. Hillborg, S. Zhao and L. S. Schadler, Adv. Mater., 2012, 24, 3134–3137 CrossRef CAS PubMed .
  30. D. Wang, X. Zhang, J. W. Zha, J. Zhao, Z. M. Dang and G. H. Hu, Polymer, 2013, 54, 1916–1922 CrossRef CAS PubMed .
  31. X. Yang, Y. Zhan, R. Zhao and X. Liu, J. Appl. Polym. Sci., 2012, 124, 1723–1730 CrossRef CAS .
  32. F. He, K. Lam, D. Ma, J. Fan, L. H. Chan and L. Zhang, Carbon, 2013, 58, 175–184 CrossRef CAS PubMed .
  33. D. Wang, Y. Bao, J. W. Zha, J. Zhao, Z. M. Dang and G. H. Hu, ACS Appl. Mater. Interfaces, 2012, 4, 6273–6279 CAS .
  34. L. Cui, X. Lu, D. Chao, H. Liu, Y. Li and C. Wang, Phys. Status Solidi A, 2011, 208, 459–461 CrossRef CAS .
  35. J. W. S. Hummers and R. E. Offeman, J. Am. Chem. Soc., 1958, 80, 1339 CrossRef .
  36. G. He, H. Chen, J. Zhu, F. Bei, X. Sun and X. Wang, J. Mater. Chem., 2011, 21, 14631–14638 RSC .
  37. Z. Wang, H. Yu, J. Xia, F. Zhang, F. Li, Y. Xia and Y. Li, Desalination, 2012, 299, 50–54 CrossRef CAS PubMed .
  38. J. Shang, Y. Zhang, L. Yu, B. Shen, F. Lv and P. K. Chu, Mater. Chem. Phys., 2012, 134, 867–874 CrossRef CAS PubMed .
  39. X. Sun, J. He, G. Li, J. Tang, T. Wang, Y. Guo and H. Xue, J. Mater. Chem. C, 2013, 1, 765–777 RSC .
  40. Y. Zhang, J. Tian, H. Li, L. Wang, X. Qin, A. M. Asiri, A. O. Al Youbi and X. Sun, Langmuir, 2012, 28, 12893–12900 CrossRef CAS PubMed .
  41. E. Adem, F. F. Castillón, G. Burillo, J. Rickards, E. Muñoz and L. Cota, Polym. Bull., 2004, 52, 163–170 CrossRef CAS .
  42. I. K. Moon, J. Lee, R. S. Ruoff and H. Lee, Nat. Commun., 2010, 1, 1–6 CrossRef PubMed .
  43. E. Paparazzo, Carbon, 2013, 63, 578–581 CrossRef CAS PubMed .
  44. T. Liu, P. H. Zhou, J. L. Xie and L. J. Deng, J. Appl. Phys., 2011, 110, 033918 CrossRef PubMed .
  45. C. A. D. T. J. Imholt, B. Hasslacher, D. W. P. J. M. Perez, J. A. Roberts, A. W. J. B. Scott, Z. Ye and J. M. Tour, Chem. Mater., 2003, 15, 3969–3970 CrossRef .
  46. M. Prato and E. Vazquez, ACS Nano, 2009, 3, 3819–3824 CrossRef PubMed .
  47. S. Villar-Rodil, J. I. Paredes, A. Martínez Alonso and J. M. D. Tascon, Langmuir, 2008, 24, 10560–10564 CrossRef PubMed .
  48. N. Z. Shihai Zhang, C. Huang, K. Ren and Q. Zhang, Adv. Mater., 2005, 17, 1897–1901 CrossRef .
  49. M. S. Cao, X. L. Shi, X. Y. Fang, H. B. Jin, Z. L. Hou, W. Zhou and Y. J. Chen, Appl. Phys. Lett., 2007, 91, 203110 CrossRef PubMed .
  50. Y. Qing, W. Zhou, F. Luo and D. Zhu, Carbon, 2010, 48, 4074–4080 CrossRef CAS PubMed .
  51. G. S. Wang, Y. Deng, Y. Xiang and L. Guo, Adv. Funct. Mater., 2008, 18, 2584–2592 CrossRef CAS .
  52. G. S. Wang, Y. Deng and L. Guo, Chem.–Eur. J., 2010, 16, 10220–10225 CrossRef CAS PubMed .
  53. G. S. Wang, ACS Appl. Mater. Interfaces, 2010, 2, 1290–1293 CAS .

Footnote

Electronic supplementary information (ESI) available. See DOI: 10.1039/c4ra02040e

This journal is © The Royal Society of Chemistry 2014
Click here to see how this site uses Cookies. View our privacy policy here.