 Open Access Article
Creative Commons Attribution 3.0 Unported Licence
Analysis of photocurrent and capacitance of TiO2 nanotube–polyaniline hybrid composites synthesized through electroreduction of an aryldiazonium salt
Simonetta Palmas*a,
Michele Masciaa,
Annalisa Vaccaa,
Javier Llanosb and
Esperanza Menab
aDipartimento di Ingegneria Meccanica Chimica e dei Materiali, Università degli Studi di Cagliari, Via Marengo 2, 09123 Cagliari, Italy. E-mail: simonetta.palmas@dimcm.unica.it
bChemical Engineering Department, University of Castilla-La Mancha, Edificio Enrique Costa Novella, Campus Universitario s/n, 13005 Ciudad Real, Spain
First published on 15th April 2014
Abstract
TiO2 nanotube–polyaniline hybrid composites were synthesized by a multi-step electrochemical procedure as follows: (1) electrochemical oxidation of Ti foil to obtain TiO2 ordered nanotubular electrodes, (2) functionalization of TiO2 by electroreduction of 4-nitrobenzendiazonium salt, (3) electrochemical reduction of the nitro group to amine, (4) galvanostatic electropolymerization of aniline onto the surface of the aminophenyl-modified TiO2 electrode. Samples were also prepared by direct electropolymerization of PANI on TiO2 nanostructures without the deposition of 4-nitrobenzendiazonium as under-layer. Different times for the electropolymerization step were applied. The composite materials were morphologically and electrochemically characterized by scanning electron microscopy, cyclic voltammetry and electrochemical impedance analysis. The improvement of the most relevant properties of the PANI–TiO2 composites for their application as photocatalysts and as supercapacitors was checked.
1. Introduction
TiO2 is an n-type semiconducting material with very interesting properties which is used in many different applications. Among these properties, its chemical stability, high photocatalytic activity, nontoxicity, low cost, availability, good mechanical flexibility and conductivity should be noted.1 It has potential applications in many fields, such as lightweight battery electrodes, electromagnetic shielding devices, anticorrosion coatings and sensors.2,3 In recent years, its application in photocatalytic treatments and as supercapacitors has also been proposed.4–7 However, several drawbacks can limit its use for these emerging applications. In the first place, the wide band gap energy of TiO2 (Eg = 3.2 eV) limits it to absorb visible light (λ > 380 nm). In the second place, the reported specific capacitances of TiO2 are significantly smaller than those obtained from other metal oxides, such as MnO2 and RuO2, generally used as supercapacitors: values of 100–911 μF cm−2 were obtained for TiO2 nanotube arrays.4–7 The relatively small specific capacitance was attributed to the poor electrochemical activity and poor electrical conductivity of TiO2.8,9Conducting polymers, such as polyaniline, polypyrrole, polythiophene and their derivatives have often been proposed as suitable materials to enhance the performance of electrode materials.10–12 Higher conductivity, fast electrochemical switching and high specific capacitance values as well as environmental stability may be conferred to the final structure by the presence of the polymer.13 A very recent work, on the use of polypyrrole, reported that its nanostructure may greatly influence the properties and overall functionality for its possible application.14
In the same way, the use of PANI as a conducting polymer for electrodes and supercapacitors is very attractive because of its good characteristics such as low cost, simple synthesis, high environmental stability, good electrical conductivity, good electronic and optical properties and reversible control of conductivity by charge-transfer doping and protonation.15–18 Due to its delocalized conjugated structure in electron-transfer processes, PANI can be used as a photosensitizer of TiO2 to remarkably improve the efficiency of its photocatalytic activity under visible light.1,19 The redox reversible processes associated with doping and undoping of counterions accompany charge storage in PANI giving rise to a pseudocapacitance; this contribution has to be added to a double-layer capacitance due to the separation of charges which takes place at PANI–electrolyte interface.20 The theoretical specific capacitance of PANI, which is a combination of pseudocapacitance and electrical double-layer capacitance, has been estimated as 2.0 103 F g−1.21
However, when electropolymerization is used for coating of surfaces, weak adhesion between the organic layer and a substrate of different nature can occur: as was reported in the literature, the lack of strong interfacial bonding may result in the collapse of the hybrid nanostructures.22 Other authors reported that, despite the very high capacitance (3407 F g−1) measured at ordered PANI nanorods on an ITO substrate, low stability was obtained during repeated cycles, due to poor electrical connectivity between the nanorods and the smooth surface of the ITO substrate.23 This poor cyclability has become a major obstacle for PANI to be used in supercapacitors.
In this context, the present work considers the synthesis of hybrid TiO2 electrodes and investigates the possibility to stabilize PANI deposition on them, by means of a preliminary surface functionalization through the electrochemical reduction of 4-nitrobenzendiazonium salt. Actually, the electrochemical reduction of diazonium derivatives is an elegant and versatile technique for surface functionalization, which was first reported in 1992 by Delamar et al.24 The mechanism of attachment was described as the generation of aryl radicals and subsequent formation of covalent bonds between the surface and the aryl groups.25,26 This approach has several advantages including ease of surface modification, wide potential window for subsequent electrochemistry and high stability under long term storage in air.27–29 By tuning the experimental conditions, it is possible to control the surface coverage and the density of the resulting film, yielding submonolayer to multilayer films.26–30 The electrodeposition of PANI using an under-layer obtained by electroreduction of aryl diazonium has been proposed in the literature to modify carbon nanotubes,31 glassy carbon electrodes,32 and gold:33 the PANI composites obtained with this technique showed higher chemical stability, a more uniform layer and high values of capacitance.
In the present work, the electrodeposition of PANI using aminophenyl moieties as an under-layer is proposed to modify TiO2 nanotubular structured electrodes obtained by electrochemical anodization of Ti foil. A first layer of nitrophenyl moieties was grafted on titania nanotubes by the electrochemical reduction of 4-nitrobenzendiazonium salts; nitro-groups were then electroreduced to amino-groups. Finally, PANI was electropolymerised at the modified electrodes. As a comparison, PANI was also electropolymerized on bare TiO2 nanotubes. The electrodes were characterized by scanning electronic microscopy, cyclic voltammetry, electrochemical impedance spectroscopy and charge–discharge tests to evaluate their performance with particular regard to the enhancement in photocurrent and capacitance.
2. Experimental
2.1 Chemicals
Ammonium fluoride was purchased from Fluka; 4-nitrobenzenediazonium tetrafluoroborate and tetrabutylammonium hexafluorophosfate (TBAPF6) were purchased from Sigma-Aldrich. Aniline was freshly distilled and stored in the dark. Alcohols and the other solvents were purchased in refined grade from Carlo Erba or Sigma Aldrich and used without further purification. The aqueous solutions were prepared with double-distilled water (18 MΩ cm).2.2 Apparatus
All electrochemical experiments were performed at room temperature using an AMEL Potentiostat, controlled with the Junior Assist software, coupled with an AMEL Frequency Response Analyzer, controlled with the Zassist software. Irradiation of the samples was performed by means of a 300 W Xe lamp (LOT-Quantum Design Europe) equipped with suitable filters to select different wavelengths.A conventional three-electrode cell was generally used in which the investigated samples worked as anodes; a Pt grid was used as counter electrode while a saturated calomel electrode (SCE) was the reference. All the potential values given in the text refer to SCE. The exposed geometrical area of the working electrodes was 1 cm2. A two electrode configuration was adopted for the synthesis of nanotubular structures: also in this case a grid of Pt was used as counter electrode.
2.3 Synthesis of the anodic materials
Titanium foil (Sigma-Aldrich®, 0.25 mm thickness 99.7% metal basis) was firstly degreased by sonication in acetone, then in isopropanol and in methanol (10 min each), and finally rinsed with deionized water. The pretreated foil was then submitted to electrochemical anodization. Oxidation was performed in glycerol–water (75![[thin space (1/6-em)]](https://www.rsc.org/images/entities/char_2009.gif) :
:![[thin space (1/6-em)]](https://www.rsc.org/images/entities/char_2009.gif) 25 vol%) solutions containing 0.14 M NH4F: a potential ramp was applied from open-circuit voltage (OCV) to a fixed potential (20 V) with a scan rate of 50 mV s−1; then, the applied potential was maintained at this fixed value for two hours. After oxidation, the electrodes were rinsed in deionized water and dried in a nitrogen stream. A subsequent annealing treatment was needed in order to transform the amorphous phase into a crystalline structure. Thermal treatment was performed in air atmosphere for 1 h at 400 °C.
25 vol%) solutions containing 0.14 M NH4F: a potential ramp was applied from open-circuit voltage (OCV) to a fixed potential (20 V) with a scan rate of 50 mV s−1; then, the applied potential was maintained at this fixed value for two hours. After oxidation, the electrodes were rinsed in deionized water and dried in a nitrogen stream. A subsequent annealing treatment was needed in order to transform the amorphous phase into a crystalline structure. Thermal treatment was performed in air atmosphere for 1 h at 400 °C.
After anodization a functionalization of the electrode surface with 4-nitrobenzenediazonium was performed by cyclic voltammetric runs at 100 mV s−1 in the range of potential 0.4 to −0.7 V in acetonitrile + 0.1 M (TBAPF6) solution containing 2 mM of 4-nitrobenzenediazonium tetrafluoroborate. Electrochemical reduction of nitro group to amino group was performed by cyclic voltammetry in water–ethanol solutions (90![[thin space (1/6-em)]](https://www.rsc.org/images/entities/char_2009.gif) :
:![[thin space (1/6-em)]](https://www.rsc.org/images/entities/char_2009.gif) 10 vol%) containing 0.1 M KCl; the potential was varied from the open circuit potential to −1.2 V and back to 0.2 V. The scan rate was 100 mV s−1.
10 vol%) containing 0.1 M KCl; the potential was varied from the open circuit potential to −1.2 V and back to 0.2 V. The scan rate was 100 mV s−1.
Finally, PANI polymerization was carried out on either bare TiO2 or phenylamine modified TiO2 electrodes. To this aim galvanostatic runs were performed at a constant current density of 20 μA cm−2 from aqueous solutions containing aniline (0.1 M) and HNO3 (1 M). Different electropolymerization steps (30, 60 and 120 minutes) were applied in order to obtain PANI films with different thicknesses. A minimum of 30 minutes of electropolymerization was needed to obtain a measurable coverage of the polymer. According to the Faraday law, if a unit current yield is supposed, the related load of PANI may be evaluated as 69.5, 139 and 278 μg cm−2 respectively for the three indicated steps, when 0.5 electrons per mole aniline are considered to be involved in the process.34
To simplify the discussion, hereafter NT will be used to indicate a bare nanotubular structure, while modified samples will be identified with NT–PANIx, NT–DZ–PANIx, when PANI is directly linked on nanotubes, or by means a preliminary phenylamine underlayer, respectively. The PANI load of the different samples will be indicated by the subscript number x which represents the time (minutes) of duration of the electropolymerization step.
2.4. Characterization of the electrodes
Scanning electron microscopy (SEM) was used to study the morphology of the assembled electrodes prepared by the different approaches (NOVA 600, Nanolab dual beam). Focused ion beam (FIB) was also used to obtain very precise cross sections of samples for subsequent imaging via SEM.In order to evaluate the performance of the samples, the trend of photocurrent with the potential was preliminarily investigated. Depending on the sample different polarization trends were obtained and the plateau of photocurrent saturation was achieved at a different potential from the OCV value (data not shown). Thus, the value of 1 V above the OCV was selected to measure photocurrent in order to have a reference value at which all the samples were under saturation conditions.
Most of the measurements were done in the UV range (λ = 365 nm); the performances were also evaluated using the lamp without filter, to better simulate solar radiation (white light). The value of photocurrent was taken as the difference between light and dark currents. Electrochemical impedance spectroscopy (EIS) measurements were carried out in the dark, at the OCV and in a frequency range from 100 kHz down to 0.1 Hz. The complex capacitance values were derived from the impedance data evaluated at each frequency. Values of global capacitance were also derived for comparison, from typical charge–discharge tests:
| C = i/(ΔV/Δt) | (1) |
According to eqn (1) the capacitance was calculated from the slope ΔV/Δt of the discharge curve obtained at a constant current density i. Typical experiments were performed in a potential range of 1.5 V with a discharge current of 0.1 mA.
3. Results and discussion
Fig. 1 shows an example of the final raw NT structure obtained after two hours of oxidation of Ti foils. As it can be observed, a regular structure of NTs was obtained, with an average tube diameter of about 90 nm, and a mean length of about 1 μm.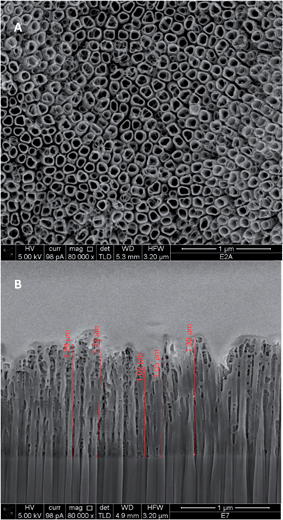 | ||
| Fig. 1 SEM images of surface (A) and of FIB cross section (B) of TiO2 nanotubes synthesized in glycerol solutions. | ||
The NT TiO2 electrodes were then processed to obtain the under-layer of phenylamine, suitable for anchoring the PANI, with a procedure which has been indicated as a simple way to achieve a regular distribution of the subsequent layer, with a high stability.31,33
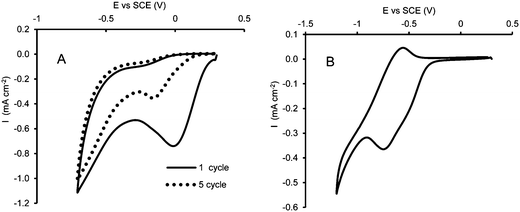
Fig. 2A shows an example of the CV obtained after two consecutive cycles of functionalization. In the first cycle, a cathodic peak is observed at about 0 V which can be related to the reduction of the diazonium group. Further cycles exhibit a displacement of the cathodic peak towards more negative potentials, as well as a decrease of the recorded current indicating the progressive blocking of the electroactive surface due to the formation of the organic film.25,26
A further process was performed cycling the potential from 0.2 to −1.2 V in water–ethanol solution containing 0.1 M KCl to transform the NO2 termination into NH2 termination, to activate the aromatic ring for the subsequent electrophilic attack.
As it is generally reported in the literature35,36 this process occurs through an intermediate reversible step which involves the nitrous–hydroxylamine (NO–NHOH) redox couple, followed by the irreversible amination of the hydroxylamine group. According to this mechanism, data presented in Fig. 2B show the anodic peak related to the intermediate process at about −0.52 V: just a knee is observable in the direct scan of the CV, assessing the corresponding reduction, at about the same potential, due to its partial overlapping with the irreversible reduction wave, which has its maximum at around −0.8 V.
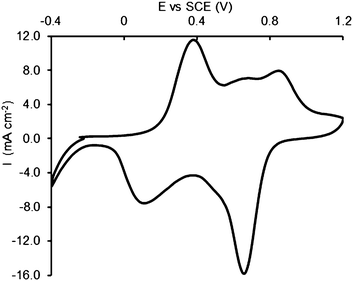
The functionalized samples were then submitted to aniline electropolymerization. The process was carried out by galvanostatic electrolysis at 20 μA for different intervals of time. For comparison purposes, the electropolymerization was carried out also at bare NTs, with the same procedure adopted for the functionalised electrodes. The final coverage of the surface by the polymer was checked by cyclic voltammetry and SEM analyses. Fig. 3 shows an example of the trend of voltammetric runs performed in H2SO4 0.1 M at an NT–DZ–PANI electrode which assesses the successful link of the polymer to the surface.
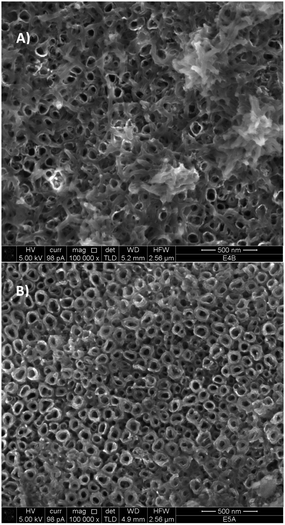
Fig. 4 shows the comparison between the SEM images of NT–PANI (Fig. 4A) and NT–DZ–PANI (Fig. 4B) obtained after 60 minutes of electropolymerization: when bare NT electrodes are coated, PANI tends to deposit irregularly inside the tubes and on their top mouth: a partial plugging of the tubes can be also observed, which may compromise further access of the electrolyte to the tubes. A different aspect of the final surfaces is observable for the NT–DZ–PANI samples, with a more regular distribution of the polymer. Moreover, the regular deposit does not seem to block the entrance on the NTs, while a thickening of the walls and a decrease in the diameter of the NTs is observed, indicating that the polymerization mainly occurs at the NT walls.
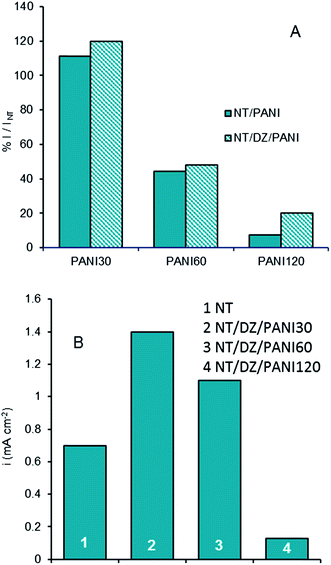
The photocurrents of the prepared samples were evaluated in aqueous Na2SO4 solution, under 1 V of overpotential from the OCV, at which saturation current conditions were guaranteed for all the samples. Fig. 5A shows the results obtained at λ = 365 nm for different PANI loads with and without under-layer. In particular, the comparison is done in terms of the ratio between the photocurrent measured at the different samples and that measured at a bare NT electrode. Fig. 5B shows data of photocurrent density obtained for NT–DZ–PANI samples irradiated with white light.
Data shown in Fig. 5 indicate a positive effect only at low loading of PANI: only the performances of the PANI30 samples are larger than those of NT under UV light; the situation is slightly better under white light, under which also the sample with 60 min loading performs well. Nevertheless, in any case the performances abruptly decrease at samples highly loaded: a negative effect of PANI polymerization was observed at longer deposition times, probably due to the partial plugging of the nanotube structure previously mentioned. As highlighted by different authors37–41 the combination of PANI with TiO2 can improve their performance in relation to UV light and white light because PANI is a conducting polymer and a dye with a forbidden band gap of 2.8 eV,42 making it a good sensitizer of TiO2. Based on the well-established energy band theory of PANI–TiO2 composites, the photocatalytic mechanism under visible irradiation involves the electrons in the π-orbital of PANI which are excited to the π*-orbital by visible light and can readily inject into the CB of TiO2 because the energy level of them matched well for the charge transfer.43 Nevertheless, an excessive PANI load may occupy the active sites of TiO2; moreover, it may cause the recombination of the electrons with PANI+, which competes with the injection into the conduction band of TiO2.43 The maximum of visible photoactivity implies that there is an optimal load for the interfacial electrons transfer from PANI to TiO2.
By comparing the data in Fig. 5, it is worth noting that, PANI deposition time being the same, the gain in efficiency for NT–DZ–PANI with respect to NT samples is higher under white light, probably due to the greater absorption of PANI under visible light. Thus, for the sample with NT–DZ–PANI30, the percentage of current increase with respect NT sample is about 100% (Fig. 5B), whereas the analogous gain is only of 20% at 365 nm (Fig. 5A). In the absence of the under-layer the analogous comparison leads to only 10% of gain (samples NT–PANI30 in Fig. 5A).
The presence of the under-layer also causes a lower decrease at high PANI loads: for NT–DZ–PANI120 the residual activity at 365 nm is about 20% of the initial value, whereas just 6% of the initial activity remained for NT–PANI120. This result can directly be linked to the better distribution of PANI on the surface of the TiO2 nanotubes (checked by SEM analyses) when the polymerization is carried out after the functionalization of the structure with the benzene-diazonium salt.
Electrochemical impedance spectroscopy (EIS) was used to obtain information on the capacitive behavior of the samples. Cyclic voltammetry is often proposed to derive the capacitance: however, due to the large potential perturbation, the CV currents may include contributions from both localized and conduction band charge transfers, thus giving overestimated capacitance values; at the same time charge transfer kinetics could also affect the current, leading to underestimated capacitance at high potential scan rates.44 As a steady state technique with small potential variation, EIS has been suggested as a more reliable method to get capacitance data, with minimized effect from non-capacitive Faradaic contributions.44
In this work all the EIS were performed at the OCV, superimposing a sinusoidal wave of 10 mV.
The effect of the PANI coating on TiO2 is shown in Fig. 6, where the trend of Nyquist plot for bare NTs is compared with those of electrodes with different PANI load (Fig. 6A).
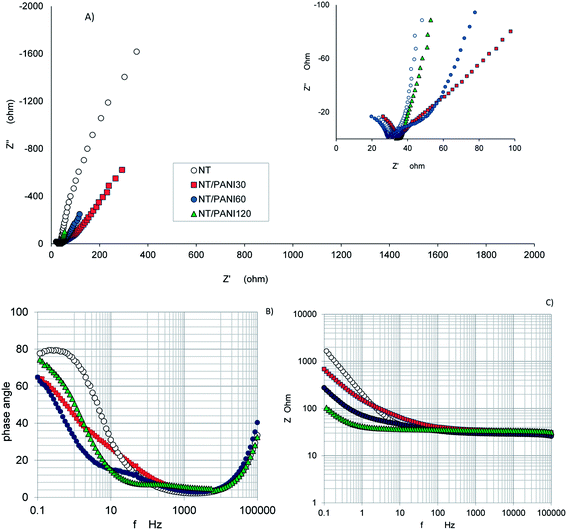 | ||
| Fig. 6 Effect of the PANI load on the impedance measured for different NT–PANI samples (A): Nyquist plots; (B) phase and modulus (C) Bode diagrams. | ||
The general trend of the spectra always involves first a semicircle in the higher frequency range, which may be attributed to the electrode surface properties and the charge transfer resistance. A nearly vertical trend is observed in the lower frequency range which may be connected to a capacitive component or/and mass transfer effects. The shape of the plots and the slope of the straight line depend on the PANI load. A gradual transition from capacitive to Warburg-like behavior was already reported in the literature for PANI based systems in the low frequency range, in aqueous and non-aqueous media and with various substrates.45
In the present case, when a high load of PANI is considered (as in the sample NT–PANI60) the presence of the new interface TiO2–PANI is well highlighted by the appearance of a second circle at the intermediate frequencies (see inset of Fig. 6A).
The effect of PANI is also evident in the Bode modulus and phase angle plots (Fig. 6B and C): due to the conductive character of PANI, a clear decrease in modulus is observed when PANI load increases, and a new peak appears in the phase diagram at intermediate frequency, when PANI load is enough to clearly show its contribution.
In order to better understand these results, the impedance data may be analyzed in terms of complex capacitance.46 Starting from the real and imaginary impedance values, we can express as:
| C(ω) = C′(ω) − jC′′(ω) | (2) |
 | (3) |
 | (4) |
Data in terms of Bode modulus plot are shown in Fig. 7: the inset reports the trend of the relative Nyquist C′′ vs. C′.
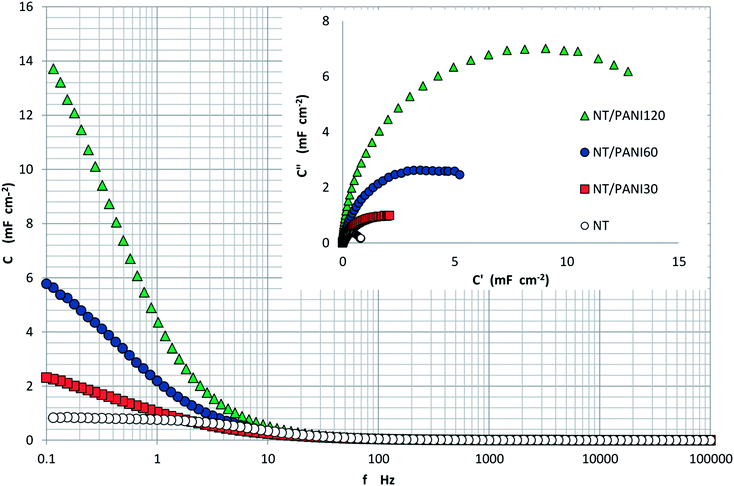 | ||
| Fig. 7 Trend of capacitance modulus vs. frequency measured at NT samples modified with different PANI loads. Inset: Nyquist plot. | ||
Data in Fig. 7 illustrate the gain in capacitance obtained due to the PANI load, with values of C, evaluated at 0.1 Hz, ranging from 813 μF cm−2 for NT to 14 mF cm−2 measured for NT–PANI120.
The effect of the underlayer is illustrated in Table 1, which reports the comparison in terms of ratio between C of the different samples and C of the related bare NT, with and without the under-layer.
| PANI load min | NT–PANI CNT–PANI/C NT | NT–DZ–PANI CNT–DZ–PANI/C NT |
|---|---|---|
| 30 | 2.6 | 3.1 |
| 60 | 7.5 | 12.9 |
| 120 | 15.7 | 16.5 |
The large PANI effect results in values of capacitance up to 15-fold the values of the bare NT. The presence of the under-layer increases this effect especially for the sample with 60 min of PANI load; the effect of the under-layer is less evident at 120 min of PANI loading, probably because of the effect of plugging of pores, previously mentioned.
Capacitance was also measured by charge–discharge tests in order to make a comparison: values of 800 μF cm−2, 1.8 mF cm−2, and 12 mF cm−2 were respectively obtained at NT, NT–DZ–PANI30 NT–DZ–PANI120 which is in good agreement with those obtained from EIS.
As far as comparison with the literature is concerned, the capacitance value measured for NT is in good agreement with the data reported for titania NTs.4–7 However, if TiO2–PANI are considered, the comparison is not so straightforward. Resistance and capacitance of PANI depend on the thickness of the film and on the preparation procedures; moreover, the values of capacity depend on the techniques used for their measurement.44
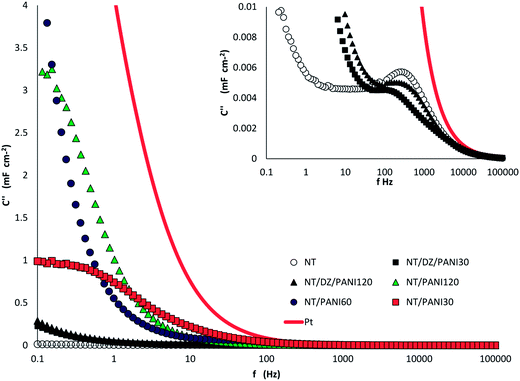
Also of particular concern is the trend of C′′ vs. f plot (Fig. 8), because it allows a direct comparison of the resonant frequency (f0) for the different samples. As is generally obtained for semiconductor materials, the trend of the imaginary capacitance with the frequency passes through a maximum at a value f0, which virtually separates the range of the capacitive (f < f0) and resistive (f > f0) behavior of the sample. Moreover, from the resonant frequency, the value of the relaxation time constant (τ0) can be calculated as:
 | (5) |
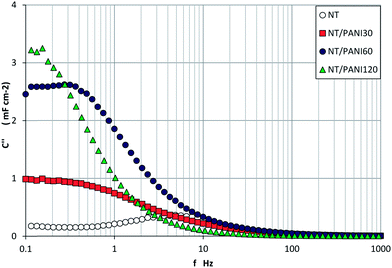 | ||
| Fig. 8 Trend of imaginary capacitance vs. frequency measured for NT samples modified with different PANI loads. | ||
This parameter is another important figure of merit which determines the charge–discharge time of the condenser. Low time constants (of the order of ms) are preferred for electrochemical supercapacitors to ensure fast charge–discharge characteristics.45
Data in Fig. 8 indicate that the PANI layer over the sample surface makes the capacitive behavior active at lower frequency, and samples with higher load have slower charge–discharge process.
In Fig. 9 the C′′ vs. f trends for different samples are compared, in particular, two extreme cases are represented. On the one hand, we observe the trend related to a conducting Pt electrode, which is reported in the same figure as a comparison: a regular increasing trend without any peak is presented by this sample, as we expected due to its completely resistive behavior. On the opposite side, we observe the behavior of NTs bare electrode (see inset) which shows a capacitive behavior at a frequency lower than 310 Hz (f < f0); the abrupt increase on C′′, which is measured at very low frequency, may be due to a faradic capacitance contribution, related to possible charge transfer at the electrode–solution interface.
The trends obtained with the other modified samples differ in terms of displacement of f0 and/or faradic response contribution. The main effect of the PANI is an increase in conductivity of the surface, and after 60 min the semiconductor character of the titania NT is almost completely masked and the trend is very similar to that of Pt.
When the interlayer is interposed in between, the capacitive behavior is maintained: the resonance frequency is shifted to lower values with respect to that of NT bare sample, and the faradic capacitance contribution becomes evident at f lower than 10 Hz. However, the shifting to the right of the curve related to the sample NT–DZ–PANI120 lets us to conclude that also in this case, the prevailing conductive character of the polymer will prevail at high PANI loads.
4. Conclusions
From the results presented in this work, the following conclusions can be drawn:- The morphology of PANI deposited onto the TiO2 NT electrodes is highly improved by the under-layer of phenylamine, with a more regular distribution of the polymer. Moreover, the PANI deposit does not plug the entrance on the NTs because the polymerization mainly occurs at the NTs walls.
- The photocurrent responses indicated that the electropolymerization process should not be too much prolonged. After 30 min, the photocurrent obtained is higher than working with bare NTs, but it worsens when applying a higher duration polymerization process. This negative effect has been attributed to the plugging of the nanotubes.
- When light without any filter is applied, the highest photocurrent values were obtained in the samples with underlayer. This result is due to the greater absorption of PANI in the whole spectrum of visible/UV light.
- The presence of the PANI layer results in characteristic shapes in the Nyquist and Bode diagrams, related to the gain in the capacity. The hybrid composites have a capacitance 15-fold the value of bare NTs, with the highest values obtained working with the samples NT–DZ–PANI.
- Although the deposition of PANI produces an increase in the conductivity of the TiO2, so masking its semiconductor characteristics, with the use of underlayer the capacitive behavior prevails, even at high PANI loads.
Acknowledgements
The authors wish to thank Elodia Musu, from Sardegna Ricerche Laboratory, who made the SEM and FIB measurements, as well as Pablo Ampudia and Francesco Fois for their support in the experimental work. The financial support of the Spanish Ministry of Education, Culture and Sport for the research stays grants of doctoral students and University staff is gratefully acknowledged.References
- S. Deivanayaki, V. Ponnuswamy, S. Ashokan, P. Jayamurugan and R. Mariappan, Mater. Sci. Semicond. Process., 2013, 16, 554–559 CrossRef CAS PubMed.
- J. Huang and R. B. Kaner, J. Am. Chem. Soc., 2004, 126, 851–855 CrossRef CAS PubMed.
- X. Zhang, W. J. Goux and S. K. Manohar, J. Am. Chem. Soc., 2004, 126, 4502–4503 CrossRef CAS PubMed.
- M. Salari, S. H. Aboutalebi, K. Konstantinov and H. K. Liu, Phys. Chem. Chem. Phys., 2011, 13, 5038–5041 RSC.
- Y. Xie and D. Fu, Mater. Res. Bull., 2010, 45, 628–635 CrossRef CAS PubMed.
- M. S. Kim, T. W. Lee and J. H. Park, J. Electrochem. Soc., 2009, 156, A584–A588 CrossRef CAS PubMed.
- M. Salari, K. Konstantinov and H. K. Liu, J. Mater. Chem., 2011, 21, 5128–5133 RSC.
- J. Wang, J. Polleux, J. Lim and B. Dunn, J. Phys. Chem. C, 2007, 111, 14925–14931 CAS.
- F. Fabregat-Santiago, E. M. Barea, J. Bisquert, G. K. Mor, K. Shankar and C. A. Grimes, J. Am. Chem. Soc., 2008, 130, 11312–11316 CrossRef CAS PubMed.
- H. Wang, Q. Hao, X. Yang, L. Lu and X. Wang, ACS Appl. Mater. Interfaces, 2010, 2, 821–828 CAS.
- S. Y. Liew, W. Thielemans and D. A. Walsh, J. Phys. Chem. C, 2010, 114, 17926–17933 CAS.
- R. B. Ambade, S. B. Ambade, N. K. Shrestha, Y. C. Nah, S. H. Han, W. Lee and S. H. Lee, Chem. Commun., 2013, 49, 2308–2310 RSC.
- A. Davies, P. Audette, B. Farrow, F. Hassan, Z. Chen, J. Y. Choi and A. Yu, J. Phys. Chem. C, 2011, 115, 17612–17620 CAS.
- S. S. Shinde, G. S. Gund, D. P. Dubal, S. B. Jambure and C. D. Lokhande, Electrochim. Acta, 2014, 119, 1–10 CrossRef CAS PubMed.
- R. Jamal, F. Xu, W. Shao and T. Abdiryim, Nanoscale Res. Lett., 2013, 8, 1–8 CrossRef PubMed.
- X. Li, Electrochim. Acta, 2009, 54, 5634–5639 CrossRef CAS PubMed.
- G. Inzelt, M. Pineri, J. W. Schultze and M. A. Vorotyntsev, Electrochim. Acta, 2000, 45, 2403–2421 CrossRef CAS.
- G. Li, C. Zhang, Y. Li, H. Peng and K. Chen, Polymer, 2010, 51, 1934–1939 CrossRef CAS PubMed.
- H. Çetin, B. Boyarbay, A. Akkaya, A. Uygun and E. Ayyildiz, Synth. Met., 2011, 161, 2384–2389 CrossRef PubMed.
- F. Gobal and M. Faraji, J. Electroanal. Chem., 2013, 691, 51–56 CrossRef CAS PubMed.
- H. Li, J. Wang, Q. Chu, Z. Wang, F. Zhang and S. Wang, J. Power Sources, 2009, 190, 578–586 CrossRef CAS PubMed.
- S. Wang, Current Applied Physics, 2009, 9, 1146–1150 CrossRef PubMed.
- B. K. Kuila, B. Nandan, M. Böhme, A. Janke and M. Stamm, Chem. Commun., 2009, 5749–5751 RSC.
- M. Delamar, R. Hitmi, J. Pinson and J. M. Savéant, J. Am. Chem. Soc., 1992, 114, 5883–5884 CrossRef CAS.
- P. Allongue, M. Delamar, B. Desbat, O. Fagebaume, R. Hitmi, J. Pinson and J. M. Savéant, J. Am. Chem. Soc., 1997, 119, 201–207 CrossRef CAS.
- J. Pinson and F. Podvorica, Chem. Soc. Rev., 2005, 34, 429–439 RSC.
- A. J. Downard, Electroanalysis, 2000, 12, 1085–1096 CrossRef CAS.
- F. Anariba, S. H. DuVall and R. L. McCreery, Anal. Chem., 2003, 75, 3837–3844 CrossRef CAS.
- G. Liu, T. Böcking and J. J. Gooding, J. Electroanal. Chem., 2007, 600, 335–344 CrossRef CAS PubMed.
- M. Ceccato, A. Bousquet, M. Hinge, S. U. Pedersen and K. Daasbjerg, Chem. Mater., 2011, 23, 1551–1557 CrossRef CAS.
- L. Pilan, M. Raicopol, A. Pruna and V. Branzoi, Surf. Interface Anal., 2012, 44, 1198–1202 CrossRef CAS.
- L. M. Santos, J. Ghilane, C. Fave, P. C. Lacaze, H. Randriamahazaka, L. M. Abrantes and J. C. Lacroix, J. Phys. Chem. C, 2008, 112, 16103–16109 CAS.
- A. Vacca, M. Mascia, S. Rizzardini, S. Palmas and L. Mais, Electrochim. Acta, 2014, 126, 81–89 CrossRef CAS PubMed.
- H. Lu, Y. Zhou, S. Vongehra, K. Hu and X. Meng, Synth. Met., 2011, 161, 1368–1376 CrossRef CAS PubMed.
- W. Richard, D. Evrard and P. Gros, J. Electroanal. Chem., 2012, 685, 109–115 CrossRef CAS PubMed.
- B. Ortiz, C. Saby, G. Y. Champagne and D. Bélanger, J. Electroanal. Chem., 1998, 455, 75–81 CrossRef CAS.
- M. Radoičić, Z. Šaponjić, I. A. Janković, G. Ćirić-Marjanović, S. P. Ahrenkiel and M. I. Čomor, Appl. Catal., B, 2013, 136–137, 133–139 CrossRef PubMed.
- S. Xiong, Q. Wang and H. Xia, Synth. Met., 2004, 146, 37–42 CrossRef CAS PubMed.
- L. Zhang, P. Liu and Z. Su, Polym. Degrad. Stab., 2006, 91, 2213–2219 CrossRef CAS PubMed.
- J. Li, L. Zhu, Y. Wu, Y. Harima, A. Zhang and H. Tang, Polymer, 2006, 47, 7361–7367 CrossRef CAS PubMed.
- F. Wang, S. Min, Y. Han and L. Feng, Superlattices Microstruct., 2010, 48, 170–180 CrossRef CAS PubMed.
- J. Yue, Z. H. Wang, K. B. Cromack, A. J. Epstein and A. G. MacDiarmid, J. Am. Chem. Soc., 1991, 113, 2665–2671 CrossRef CAS.
- L. Gu, J. Wang, R. Qi, X. Wang, P. Xu and X. Han, J. Mol. Catal. A: Chem., 2012, 357, 19–25 CrossRef CAS PubMed.
- C. Peng, J. Jin and G. Z. Chen, Electrochim. Acta, 2007, 53, 525–537 CrossRef CAS PubMed.
- D. Bélanger, X. Ren, J. Davey, F. Uribe and S. Gottesfeld, J. Electrochem. Soc., 2000, 147, 2923–2929 CrossRef PubMed.
- V. Ganesh, S. Pitchumani and V. Lakshminarayanan, J. Power Sources, 2006, 158, 1523–1532 CrossRef CAS PubMed.
- P. L. Taberna, P. Simon and J. F. Fauvarque, J. Electrochem. Soc., 2003, 150, A292–A300 CrossRef CAS PubMed.
| This journal is © The Royal Society of Chemistry 2014 |

