DOI:
10.1039/C4RA01704H
(Paper)
RSC Adv., 2014,
4, 19953-19959
Thermodynamic stability and impedance measurements of perovskite LuRhO3(s) in the Lu–Rh–O system
Received
26th February 2014
, Accepted 7th April 2014
First published on 8th April 2014
Abstract
The Gibbs energy of formation of LuRhO3(s) has been determined using a solid-state electrochemical technique employing an oxide ion conducting electrolyte. The Gibbs energy of formation of LuRhO3(s) from elements in their standard state calculated from the data obtained can be represented by: {ΔfGo(LuRhO3, s)/(kJ mol−1) ± 1.35} = −1164.3 + 0.2685(T/K) (943 ≤ T/K ≤ 1121). The standard enthalpy of formation and entropy of the compound at 298.15 K has been derived following the second law method. The standard molar heat capacity of LuRhO3(s) was determined from 128 K to 846 K using a heat flux type differential scanning calorimeter. Based on the thermodynamic data for the compound, an oxygen potential diagram for the Lu–Rh–O system was computed. Impedance measurements on LuRhO3(s), suggests a semiconductor like behavior with low activation energy.
1. Introduction
Rare earth orthorhodites with distorted perovskite structures were first reported by Wold et al.1 These materials exhibit diverse physical and chemical properties. Rare earth perovskites are electrochemically stable and are resistant to degradation under oxidizing and reducing conditions. Gysling et al.2 have synthesized and studied the catalytic properties of lanthanum orthorhodites for conversion of syngas to linear alcohols. The potentiality of rare-earth orthorhodites as thermoelectric materials has been investigated by many authors.3–8 Jarrett et al.9 have also reported preparation of single crystals of lutetium rhodate by flux technique. Authors have also investigated lutetium orthorhodite as cathode material in the photo decomposition of water using sunlight to produce hydrogen. Zafir et al.10 used polycrystalline lutetium rhodate as photo electrodes for liquid junction solar cells. Crystallographic, magnetic and electric properties of LuRhO3 compound has been explored by Taniguchi et al.11 The semiconducting nature of these compounds has been verified from temperature dependent resistivity measurement results. The detailed electrical properties of LuRhO3 compounds have been studied by Lazarev and Shaplygin.12 Knowledge of thermodynamic stabilities of the compounds play important role in the long term application of a material in reactive environment. Though the structure and physical properties of this oxide has been thoroughly investigated by many researchers, their thermodynamic properties and thermal stability have not been reported. In this study, LuRhO3(s) was synthesized, characterized and Gibbs energy of formation and heat capacity was determined. Other thermodynamic parameters were evaluated from these experimental data. The electrical properties of the oxide were measured by impedance spectroscopy.
2. Materials and method
2.1. Materials
Rh2O3(s), the starting material was synthesized by heating RhCl3(s) (Johnson Matthey, England) in an alumina crucible at 1023 K under flowing oxygen atmosphere. The α-Rh2O3(s) formed by this method was then converted to β-Rh2O3(s) by further heating at 1273 K. The ternary LuRhO3(s) compound was prepared from stoichiometric amounts of Lu2O3(s) (99.99 mass% John Baker, Colorado, U.S.A.) and Rh2O3(s) by the standard solid-state reaction route. The oxides were mixed thoroughly and pressed into pellets and calcined at 1273 K in air. The sample was reground and pelletized again before the final annealing at 1573 K for 12 h. LuRhO3(s) was characterized by Powder X-ray diffraction technique using Cu-Kα radiation.12,13 The cationic ratio of Lu/Rh of the compound LuRhO3(s) was confirmed to be one by energy dispersive X-ray fluorescence (EDXRF). LuRhO3(s) the ternary oxide in the Lu–Rh–O system lies on the tie line between Lu2O3(s) and Rh2O3(s). An isothermal section of the phase diagram for the system Lu–Rh–O at 1200 K is shown in Fig. 1. Preparative studies indicate a possible three phase field involving LuRhO3(s), Rh(s) and Lu2O3(s). The hashed portion indicates the phase field under consideration. Hence a phase mixture of {Lu2O3(s) + LuRhO3(s) + Rh(s)} in the molar ratio of 1![[thin space (1/6-em)]](https://www.rsc.org/images/entities/char_2009.gif) :
:![[thin space (1/6-em)]](https://www.rsc.org/images/entities/char_2009.gif) 1
1![[thin space (1/6-em)]](https://www.rsc.org/images/entities/char_2009.gif) :
:![[thin space (1/6-em)]](https://www.rsc.org/images/entities/char_2009.gif) 2 was made into a pellet of dimension 10 mm diameter and 3 mm thickness using a tungsten carbide die at a pressure of 100 MPa. The pellet was sintered at T = 1000 K for several hours. The sintered pellets were reexamined by X-ray diffraction and the phase compositions were found to be unchanged after sintering. These pellets were then used for e.m.f. measurements.
2 was made into a pellet of dimension 10 mm diameter and 3 mm thickness using a tungsten carbide die at a pressure of 100 MPa. The pellet was sintered at T = 1000 K for several hours. The sintered pellets were reexamined by X-ray diffraction and the phase compositions were found to be unchanged after sintering. These pellets were then used for e.m.f. measurements.
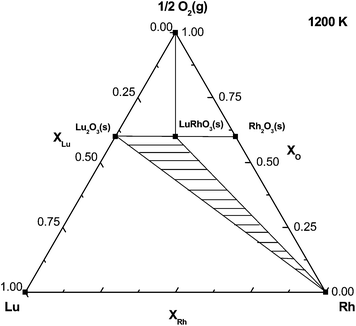 |
| | Fig. 1 Isothermal section of the phase diagram for the system Lu–Rh–O at 1200 K. The hashed portion indicates the phase field under consideration. | |
2.2. The oxide cell assembly
A double compartment cell assembly with 0.15 mole fraction calcia-stabilized-zirconia (CSZ) solid electrolyte tube with one end closed and flat was used to separate the gaseous environments of the two electrodes. A schematic diagram of the in-house fabricated experimental set-up used and experimental details for electrochemical measurements is shown in an earlier publication.14 Alumina sheathed Pt–40%Rh leads were used to measure the e.m.f. The sample pellet was made by compaction and pelletization of a mixture of Lu2O3(s) + LuRhO3(s) + Rh(s) in the ratio of 1![[thin space (1/6-em)]](https://www.rsc.org/images/entities/char_2009.gif) :
:![[thin space (1/6-em)]](https://www.rsc.org/images/entities/char_2009.gif) 1
1![[thin space (1/6-em)]](https://www.rsc.org/images/entities/char_2009.gif) :
:![[thin space (1/6-em)]](https://www.rsc.org/images/entities/char_2009.gif) 2 into pellets of dimension 10 mm diameter and 3 mm thickness at a pressure of 100 MPa. Synthetic dry air from an air generator was used as the reference electrode. The oxygen partial pressure of synthetic air does not depend on humidity or pressure variation. The temperature of the cell was measured by a calibrated chromel–alumel thermocouple located in the vicinity of the pellet. The e.m.f. of the cell was measured when the value of the e.m.f. was steady for 2–3 h using a high impedance Keithley 614 electrometer. Voltages were reproducible in subsequent heating cycles. E.m.f. was measured after initially equilibrating the galvanic cells at 1000 K for at least 24 h. The following cell configuration was employed in the present study:
2 into pellets of dimension 10 mm diameter and 3 mm thickness at a pressure of 100 MPa. Synthetic dry air from an air generator was used as the reference electrode. The oxygen partial pressure of synthetic air does not depend on humidity or pressure variation. The temperature of the cell was measured by a calibrated chromel–alumel thermocouple located in the vicinity of the pellet. The e.m.f. of the cell was measured when the value of the e.m.f. was steady for 2–3 h using a high impedance Keithley 614 electrometer. Voltages were reproducible in subsequent heating cycles. E.m.f. was measured after initially equilibrating the galvanic cells at 1000 K for at least 24 h. The following cell configuration was employed in the present study:
| (−)Pt–Rh/{Lu2O3(s) + LuRhO3(s) + Rh(s)}//CSZ//O2(p(O2) = 21.21 kPa)/Pt–Rh(+). |
The reversibility of the solid-state electrochemical cell was checked by micro-coulometric titration in both directions as described in an earlier publication.14 The range of permissible oxygen partial pressures for purely ionic conduction for CSZ electrolytes is about 10−20 Pa at 1000 K and 10−13 Pa at 1273 K.15 The oxygen partial pressure of the above designed cell falls within this range. The X-ray diffraction pattern of the sample pellet before and after electrochemical measurements did not reveal any change in phase composition.
2.3. Heat capacity of LuRhO3(s)
Heat capacity measurements were carried out using a heat flux type differential scanning calorimeter (Model: DSC-131, Setaram Instrumentation, France), the details of the experimental setup has been described elsewhere.16 The transducer of DSC-131 has been designed using the technology of the plate shaped DSC rods made of chromel–costantan. It is arranged in a small furnace with a metal resistor of low-thermal inertia so as to produce high heating and cooling rates, thereby providing for high speed experiments. The transducer also possesses very good sensitivity over the entire temperature range (100 K to 950 K). The temperature calibration of the calorimeter was carried out in the present study by the phase transition temperature of National Institute of Standards and Technology (NIST) reference materials (mercury: Tfus = 234.316 K; gallium: Tfus = 302.914 K; indium: Tfus = 429.748 K; tin Tfus = 505.078 K; lead: Tfus = 600.600 K) and AR grade samples (n-pentane: Tfus = 140.490; cyclohexane: Tfus = 280.1 K, Ttrs = 190.0 K; deionised water: Tfus = 273.160 K; potassium nitrate: Tfus = 400.850 K; silver sulfate: Tfus = 703.150 K; potassium sulfate: Tfus = 856.150 K). Heat calibration of the calorimeter was carried out from the enthalpies of transition of the reference materials. For the determination of heat capacity, NIST synthetic sapphire (SRM 720) in the powder form was used as the reference material.17 Heat capacity of the oxide was determined in the temperature range from 128 K to 845.
The classical three-step method in the continuous heating mode was followed in this study to measure the specific heat at low temperatures using liquid nitrogen. Heat flow as a function of temperature was measured at a heating rate of 5 K min−1 with high purity helium as a carrier gas with a flow rate of 2 dm3 h−1. In order to determine heat capacity in the step-heating mode in the second temperature range that is from 307 K to 845 K, three sets of experiments were carried out in argon atmosphere at a heating rate of 5 K min−1 and a gas flow rate of 2 dm3 h−1. All three sets of experiment were performed under identical experimental conditions viz. heating rate, carrier gas flow rate, delay time and temperature range. Two empty, flat bottomed cylindrical aluminium crucibles with covering lids (capacity 10−4 dm3) of identical masses were selected for the sample and reference cells. In the first run both the sample and reference cells were loaded with empty aluminum crucibles. The heat flow versus temperature was measured at a heating rate of 5 K min−1. In the second run a known weight of NIST synthetic sapphire (SRM-720) was loaded in the sample cell keeping the crucible in the reference side empty and once again the heat flow versus temperature was measured in the same temperature range and at the same heating rate. In the third run, a known weight of the sample was loaded in the sample cell, reference cell being empty and once again the heat flow as a function of temperature was measured. About 300–350 mg of the sample was used for the heat capacity measurements. In DSC-131, heat capacity of the sample under investigation can be calculated by a simple comparison of the heat flow rates in three runs. For a defined step of temperature, the thermal effect corresponding to the sample heating is integrated. Thermal equilibrium of the sample is reached after each step of temperature. If Ti, represents the initial temperature, the temperature interval step is chosen between Tj and Tj+1, we define: Tj = Ti + ΔT and Tj+1 = Ti + (j + i)ΔT. The expression used for the calculation of heat capacity of the sample is given as:
| |
 | (1) |
where, HF
blank, HF
ref and HF
sample represent heat flow during first, second and third runs respectively.
Cp(
Tj) is the heat capacity of the sample and
Cpref represents the heat capacity of reference material in Joule per Kelvin per gram and mass
sample and mass
ref represent the mass of sample and reference, respectively in grams. The heat capacity thus obtained was then converted to Joule per Kelvin per mole. Accuracy of measurements were checked by measuring the specific heat of Fe
2O
3(s) (mass fraction 0.998) in the temperature range from 307 K to 846 K and the values were found to be within ±2% as compared with the literature values.
18
2.4. Electrical property measurements by impedance analyzer
The electrical properties of LuRhO3(s) were investigated by employing impedance spectroscopic technique. Impedance measurements were performed with a Solartron AC Frequency response Analyzer (Model 1260) in the frequency range from 10 MHz to 1 Hz. The pellets were sintered and the diameter and thickness of the sintered pellet was measured. The pellet was then uniformly coated with a thin layer of platinum paste and annealed for 4 h in air at 673 K to remove organic binders. The platinum paste ensured proper electrical contact with the platinum electrode. The electrical measurements were carried out at room temperature (RT) and in the temperature range from 325 K to 773 K at an interval of 25 K. The temperature was controlled by a microprocessor. The sample temperature was measured by a K-type thermocouple placed very close to the sample with an accuracy of ±1 K. At each temperature the sample was equilibrated for 20 min before recording the spectra.
3. Results and discussion
3.1. Solid-state electrochemical measurements using oxide cell
E.m.f. of the solid state oxide electrochemical cell is related to the partial pressure of oxygen at the two electrodes and is given by the relation:| |
 | (2) |
E, is the measured e.m.f. of the cell in volts, R = 8.3144 J K−1 mol−1 is the universal gas constant, n is the number of electrons participating in the electrode reaction, F = 96![[thin space (1/6-em)]](https://www.rsc.org/images/entities/char_2009.gif) 486.4 C mol−1 is the Faraday constant, T is the absolute temperature, t(O2−) is the effective transference number of O2− ion for the solid electrolyte and p′′(O2) and p′(O2) are the equilibrium oxygen partial pressures at the positive and negative electrodes respectively. The transport number of oxygen ion in the present electrolyte cell arrangement is nearly unity (t(O2−) > 0.99) at the oxygen pressures and temperatures covered in this study. Hence, the e.m.f. of the cell is directly proportional to logarithm of the ratio of partial pressures of oxygen at the electrodes:
486.4 C mol−1 is the Faraday constant, T is the absolute temperature, t(O2−) is the effective transference number of O2− ion for the solid electrolyte and p′′(O2) and p′(O2) are the equilibrium oxygen partial pressures at the positive and negative electrodes respectively. The transport number of oxygen ion in the present electrolyte cell arrangement is nearly unity (t(O2−) > 0.99) at the oxygen pressures and temperatures covered in this study. Hence, the e.m.f. of the cell is directly proportional to logarithm of the ratio of partial pressures of oxygen at the electrodes:| | |
E = (RT/nF)ln{p′′(O2)/p′(O2)}.
| (3) |
Thus,
| |
nFE = RT![[thin space (1/6-em)]](https://www.rsc.org/images/entities/char_2009.gif) ln ln![[thin space (1/6-em)]](https://www.rsc.org/images/entities/char_2009.gif) p′′(O2) − RT p′′(O2) − RT![[thin space (1/6-em)]](https://www.rsc.org/images/entities/char_2009.gif) ln ln![[thin space (1/6-em)]](https://www.rsc.org/images/entities/char_2009.gif) p′(O2), p′(O2),
| (4) |
where,
RT![[thin space (1/6-em)]](https://www.rsc.org/images/entities/char_2009.gif)
ln
![[thin space (1/6-em)]](https://www.rsc.org/images/entities/char_2009.gif) p
p′′(O
2) is the oxygen chemical potential over the positive electrode and
RT![[thin space (1/6-em)]](https://www.rsc.org/images/entities/char_2009.gif)
ln
![[thin space (1/6-em)]](https://www.rsc.org/images/entities/char_2009.gif) p
p′(O
2) is the oxygen chemical potential over the negative electrode.
The reversible e.m.f.s of the cell measured as a function of temperature is shown in Fig. 2. The half-cell reaction at the cathode and the anode for the cell can be given by:
| | |
3/2O2(g) + 6e− = 3O2− (at the cathode)
| (5) |
| | |
Lu2O3(s) + 2Rh(s) + 3O2− = 2LuRhO3(s) + 6e− (at the anode)
| (6) |
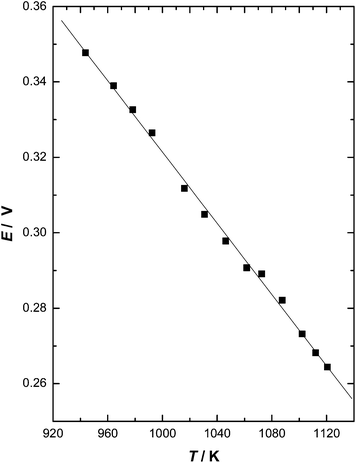 |
| | Fig. 2 Plot of e.m.f. as a function of temperature for the cell: (−)Pt–Rh/{LuRhO3(s) + Lu2O3(s) + Rh(s)}//CSZ//O2(p(O2) = 21.21 kPa)/Pt–Rh(+). | |
The overall cell reaction can be represented by:
| | |
Lu2O3(s) + 2Rh(s) + 3/2O2(g) = 2LuRhO3(s),
| (7) |
The least squared regression analysis of the e.m.f.s gives:
| | |
E/V(±0.00157) = 0.794–4.72 × 10⁻⁴(T/K); (943 ≤ T/K ≤ 1121).
| (8) |
The uncertainties quoted are the standard deviation in e.m.f. The ΔrGo(T) for the reaction given in eqn (7) involves the transfer of six electrons and hence from Nernst equation we get:
From eqn (7)–(9) and the literature value of ΔfGo (Lu2O3, s),19 ΔfGo(LuRhO3, s) has been obtained as:
| | |
{ΔfGo(LuRhO3, s)/(kJ mol−1) ± 1.35} = −1164.3 + 0.2685(T/K)
| (10) |
The error includes the standard deviation in e.m.f. values and the uncertainty in the data taken from the literature. The Gibbs energy of formation is a linear function of temperature within the investigated temperature range under consideration. The slope and intercept corresponds respectively to the average values of standard molar entropy and enthalpy of formation of LuRhO3(s).
3.2. Standard molar heat capacity of LuRhO3(s)
The heat capacity value of LuRhO3(s) was obtained in the temperature range from: 128 K to 845 K. The heat capacity values of LuRhO3(s) obtained for the low temperature range is given in Table 1 and in Table 2 for the high temperature range. The values of heat capacities in the higher temperature range are best fitted into the following polynomial expression by the least squares method.| | |
Cop(LuRhO3, s, T) (J K−1 mol−1) = 118.79 + 16.97 × 10⁻³T(K) − 17.676 × 10⁵/T2(K).
| (11) |
Table 1 Low temperature standard molar heat capacity of LuRhO3(s)
| T (K) |
Cp (J K−1 mol−1) |
T (K) |
Cp (J K−1 mol−1) |
| 128.9 |
41.8 |
215.9 |
67.9 |
| 138.3 |
44.2 |
225.8 |
72.5 |
| 147.8 |
48.2 |
235.7 |
77.8 |
| 157.4 |
51.1 |
245.6 |
82.0 |
| 167.0 |
53.1 |
255.6 |
85.6 |
| 176.7 |
55.8 |
265.5 |
89.0 |
| 186.4 |
58.3 |
275.5 |
92.5 |
| 196.2 |
61.4 |
285.4 |
97.0 |
| 206.1 |
64.5 |
295.4 |
101.4 |
Table 2 High temperature standard molar heat capacity of LuRhO3(s)
| T (K) |
Cp (J K−1 mol−1) |
T (K) |
Cp (J K−1 mol−1) |
| 307.5 |
105.0 |
585.5 |
123.9 |
| 326.9 |
108.5 |
605.5 |
124.6 |
| 346.4 |
110.7 |
625.6 |
125.4 |
| 366.0 |
112.0 |
645.6 |
126.0 |
| 385.7 |
113.2 |
665.7 |
126.6 |
| 405.7 |
114.4 |
685.7 |
127.1 |
| 425.8 |
115.6 |
705.8 |
127.6 |
| 445.9 |
116.8 |
725.8 |
128.1 |
| 465.8 |
118.0 |
745.8 |
128.5 |
| 485.6 |
119.1 |
765.8 |
128.8 |
| 505.5 |
120.2 |
785.9 |
129.1 |
| 525.4 |
121.2 |
805.8 |
129.4 |
| 545.5 |
122.2 |
825.8 |
129.6 |
| 565.5 |
123.1 |
845.8 |
130.0 |
The heat capacity of LuRhO3(s) at 298.15 K from the above equation was calculated to be 103.97 J K−1 mol−1. The heat capacity at 298.15 K was also estimated in the present study by the Neumann Kopp's rule i.e. from the heat capacity data of the constituent binary oxides. Based on the heat capacity data of Rh2O3(s) and Lu2O3(s)20 the estimated heat capacity of LuRhO3(s) at 298.15 K was found to be 106.12 J K−1 mol−1. The heat capacity data for LuRhO3(s) has been reported for the first time.
3.3. Enthalpy and entropy of formation
The enthalpy of formation of LuRhO3(s) at 298.15 K has been calculated by the second law method. Heat capacity data obtained in this study along with transition enthalpies of Rh(s) [20], Lu(s), and O2(g),21 were used to determine the second law value of ΔfHo(LuRhO3,s, 298.15 K) which was found to be −1180.5 kJ mol−1. From the heat capacity measurements and the entropy at the average experimental temperature the standard molar entropy Som{LuRhO3, s, 298.15 K} was calculated as 94.2 J K−1 mol−1. The standard molar entropy So (298.15 K) for this compound was also estimated by the Latimer entropy contribution of individual ions19 which gives So (298.15 K) = 104.7 J K−1 mol−1 for LuRhO3(s). Based on this experimental data and the heat capacity measured the derived thermodynamic functions of LuRhO3(s) were calculated and the resulting values were extrapolated to 1000 K and given in Table 3, where “fef” denotes free energy function.
Table 3 Derived thermodynamic functions of LuRhO3(s)
| T (K) |
HoT − Ho298.15 (J mol−1) |
Cp (J K−1 mol−1) |
So(T) (J K−1 mol−1) |
fefa (J K−1 mol−1) |
| Free energy function (fef) = −{Go(T) − Ho (298.15 K)}/T. |
| 300.0 |
188.7 |
104.3 |
95.4 |
94.8 |
| 350.0 |
5562.5 |
110.3 |
112.0 |
96.1 |
| 400.0 |
11![[thin space (1/6-em)]](https://www.rsc.org/images/entities/char_2009.gif) 189.1 189.1 |
114.5 |
127.0 |
99.0 |
| 450.0 |
16![[thin space (1/6-em)]](https://www.rsc.org/images/entities/char_2009.gif) 998.4 998.4 |
117.7 |
140.7 |
102.9 |
| 500.0 |
22![[thin space (1/6-em)]](https://www.rsc.org/images/entities/char_2009.gif) 948.3 948.3 |
120.2 |
153.2 |
107.3 |
| 550.0 |
29![[thin space (1/6-em)]](https://www.rsc.org/images/entities/char_2009.gif) 011.9 011.9 |
122.3 |
164.8 |
112.0 |
| 600.0 |
35![[thin space (1/6-em)]](https://www.rsc.org/images/entities/char_2009.gif) 171.6 171.6 |
124.1 |
175.5 |
116.9 |
| 650.0 |
41![[thin space (1/6-em)]](https://www.rsc.org/images/entities/char_2009.gif) 414.9 414.9 |
125.6 |
185.5 |
121.8 |
| 700.0 |
47![[thin space (1/6-em)]](https://www.rsc.org/images/entities/char_2009.gif) 732.9 732.9 |
127.1 |
194.9 |
126.7 |
| 750.0 |
54![[thin space (1/6-em)]](https://www.rsc.org/images/entities/char_2009.gif) 119.3 119.3 |
128.4 |
203.7 |
131.5 |
| 800.0 |
60![[thin space (1/6-em)]](https://www.rsc.org/images/entities/char_2009.gif) 569.2 569.2 |
129.6 |
212.0 |
136.3 |
| 850.0 |
67![[thin space (1/6-em)]](https://www.rsc.org/images/entities/char_2009.gif) 078.7 078.7 |
130.8 |
219.9 |
141.0 |
| 900.0 |
73![[thin space (1/6-em)]](https://www.rsc.org/images/entities/char_2009.gif) 645.2 645.2 |
131.9 |
227.4 |
145.6 |
| 950.0 |
80![[thin space (1/6-em)]](https://www.rsc.org/images/entities/char_2009.gif) 266.2 266.2 |
132.9 |
234.6 |
150.1 |
| 1000.0 |
86![[thin space (1/6-em)]](https://www.rsc.org/images/entities/char_2009.gif) 940.0 940.0 |
134.0 |
241.4 |
154.5 |
3.4. Electrical property measurements
Typical comparative Nyquist plots recorded at different temperatures by impedance spectroscopy in which the plot of imaginary impedance (−Z′′) versus real impedance (Z) were obtained by changing frequency from 1 Hz to 10 MHz and is shown in Fig. 3. These plots give a series of semicircles which are attributed to bulk grain conduction (σg). There was no noticeable demarcation between grain and grain boundary. Small inductor effect attributable to electrode polarization, at extremely low frequency appears and is due to extrinsic factors and is ignored. The Nyquist plot shown in Fig. 3 clearly show that the impedance decreases with increasing temperature. The intersection of the arc with the real axis gives the resistance Rdc for the sample which can be related to its conductivity σdc by:
where L is the thickness and S is the area of cross section of the pellet. Fig. 4 shows the plot of log![[thin space (1/6-em)]](https://www.rsc.org/images/entities/char_2009.gif) σT versus reciprocal temperature that is the temperature dependence of the bulk dc conductivity. The activation energy of LuRhO3(s) was deduced from the linear part of the plot of log
σT versus reciprocal temperature that is the temperature dependence of the bulk dc conductivity. The activation energy of LuRhO3(s) was deduced from the linear part of the plot of log![[thin space (1/6-em)]](https://www.rsc.org/images/entities/char_2009.gif) σT versus reciprocal temperature. The activation energy was found to be 0.43 eV. The conductivity increases with increase in temperature and lower values of activation energies suggest semiconducting behavior for LuRhO3(s).
σT versus reciprocal temperature. The activation energy was found to be 0.43 eV. The conductivity increases with increase in temperature and lower values of activation energies suggest semiconducting behavior for LuRhO3(s).
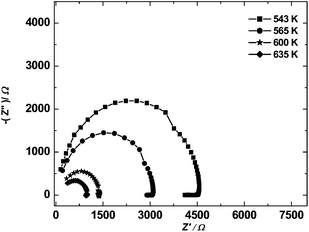 |
| | Fig. 3 Representative Nyquist plot at different temperatures for LuRhO3(s). | |
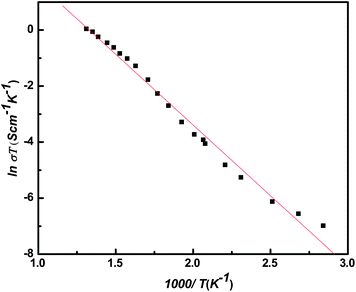 |
| | Fig. 4 Plot of log![[thin space (1/6-em)]](https://www.rsc.org/images/entities/char_2009.gif) σT versus 1000/T for LuRhO3(s). σT versus 1000/T for LuRhO3(s). | |
The variation of imaginary (ε′′) part of LuRhO3(s) with frequency (where ε′′ is the dielectric constant) at selected temperatures are calculated and shown in Fig. 5. It is observed that ε′′ increases with decreasing frequency as commonly observed in normal dielectric materials.22 The high values of imaginary part of LuRhO3(s) observed at lower frequency can be attributed to electrode polarization. However, as the frequency increases this contribution decreases and thus ε′′ gradually decreases at all temperatures studied, that is from room temperature (RT) to 773 K.
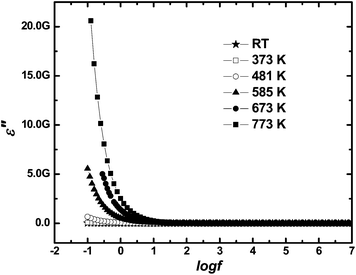 |
| | Fig. 5 Variation of imaginary part of ε′′ of LuRhO3 as a function of frequency at different temperatures. | |
3.5. Oxygen potential diagram
In an isothermal oxygen potential diagram the phase relations are represented as a function of partial pressure of oxygen. The oxygen potential versus composition diagram for the system Lu–Rh–O at T = 1273 K, computed from the results of this study, is shown in Fig. 6. The composition variable is the cationic fraction ηRh/(ηRh + ηLu) where ηRh and ηLu represents moles of component Rh and Lu. Oxygen is not included in the composition parameter. The diagram provides useful information on the oxygen potential range for the stability of various phases. On reducing the oxygen partial pressure at 1273 K, Rh2O3(s) dissociates to Rh(s). On lowering the oxygen pressure further, LuRhO3(s) dissociates to Lu2O3(s). When three condensed phases coexist at equilibrium in a ternary system such as Lu–Rh–O the system is bivariant; at a fixed temperature and total pressure, three condensed phases can co-exist only at a unique partial pressure of oxygen.23 Therefore, horizontal lines on the diagram represent three phase equilibria. The equilibrium at very low oxygen potentials between alloys and Lu2O3(s) are not shown in Fig. 6.
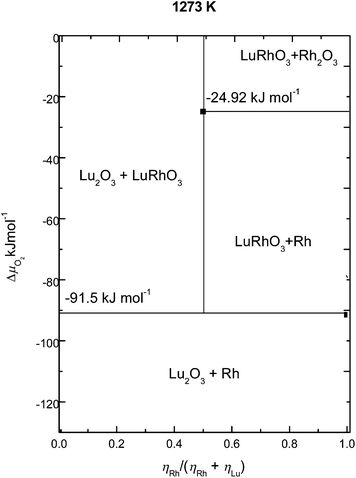 |
| | Fig. 6 Oxygen potential diagram of the Lu–Rh–O system at T = 1273 K. | |
Similar diagram at other temperatures can be readily computed from the thermodynamic data. Phase relations can also be computed as a function of temperature at constant oxygen partial pressures. The computed phase diagram in air (pO2 = 2.12 × 10⁴ Pa) is shown in Fig. 7. The decomposition temperature of LuRhO3(s) calculated in the present study is 1685 K. The decomposition temperature of LuRhO3(s) is higher than that of Rh2O3(s) at all partial pressures of oxygen.
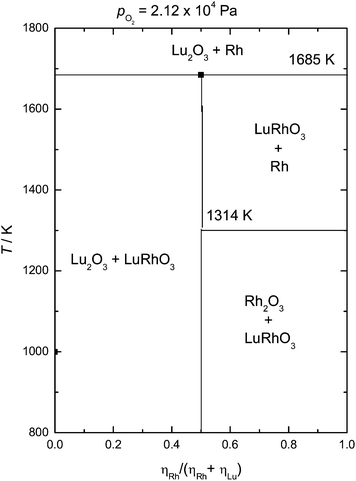 |
| | Fig. 7 Temperature composition diagram of the Lu–Rh–O system at (p(O2) = 21.21 kPa). | |
4. Conclusion
The ternary oxide in the Lu–Rh–O system, LuRhO3(s), was synthesized by the solid-state reaction route and characterized by X-ray diffraction method. The electromotive force was measured as a function of temperature using a solid-state electrochemical oxide cell. The Gibbs free energy of formation of LuRhO3(s) from elements in their standard state can be given by {ΔfGo(LuRhO3, s)/(kJ mol−1) ± 1.35} = −1164.3 + 0.268(T/K).
Standard molar heat capacity of LuRhO3(s) is: Cop(LuRhO3, s, T) (J K−1 mol−1) = 118.79 + 16.97 × 10⁻³T(K) − 17.676 × 10⁵/T2(K). The second law method gave the value of ΔfHo(LuRhO3,s, 298.15 K) and Som{LuRhO3, s, 298.15 K} as −1180.5 kJ mol−1 and 94.2 J K−1 mol−1, respectively. Isothermal oxygen potential diagram was computed for the Lu–Rh–O system at T = 1200 K. The Gibbs free energy of formation and the heat capacity of LuRhO3(s) were calculated and reported for the first time and no other experimental data are available in the literature for comparison. Impedance measurements were carried out and LuRhO3(s) was found to behave like a semiconductor.
Acknowledgements
The authors are grateful to Dr N. D. Dahale Fuel Chemistry Division, for X-ray diffraction analysis and Dr S. K. Deshpande for fruitful discussions. The authors are also thankful to Dr K. L. Ramakumar, Group Director, RC and I Group, for his constant support and encouragement.
References
- A. Wold, B. Post and E. Banks, J. Am. Chem. Soc., 1957, 79, 6365–6367 CrossRef CAS.
- H. J. Gysling, J. R. Monnier and G. Appai, J. Catal., 1987, 103, 407–418 CrossRef CAS.
- K. Kurosaki, H. Muta, M. Uno and S. Yamanaka, J. Alloys Compd., 2001, 315, 234–235 CrossRef CAS.
- H. Kuriyama, M. Nohara, T. Sasagawa, K. Takubo, T. Mizokawa, K. Kimura and H. Takagi, Int. Conf. Thermoelectr., 2006, 25, 97 Search PubMed.
- H. Mizoguchi, W. J. Marshall, A. P. Ramirez, A. W. Sleight and M. A. Subramanian, J. Solid State Chem., 2007, 180, 3463–3468 CrossRef CAS PubMed.
- H. Mizoguchi, A. P. Ramirez, L. N. Zakharov, A. W. Sleight and M. A. Subramanian, J. Solid State Chem., 2008, 181, 56–60 CrossRef CAS PubMed.
- H. Mizoguchi, L. N. Zakharov, A. P. Ramirez, A. W. Sleight and M. A. Subramanian, Inorg. Chem., 2009, 48, 204–208 CrossRef CAS PubMed.
- H. Mizoguchi, L. N. Zakharov, W. J. Marshall, A. W. Sleight and M. A. Subramanian, Chem. Mater., 2009, 21, 994–999 CrossRef CAS.
- H. S. Jarrett, A. W. Sleight, H. H. Kung and J. L. Gilson, J. Appl. Phys., 1980, 51, 3916–3925 CrossRef CAS PubMed.
- M. Zafir, M. Halmann and B. Aurian-Blajeni, Sol. Energy Mater., 1982, 7, 171–173 CrossRef.
- T. Taniguchi, W. Iizuka, Y. Nagata, T. Uchida and H. Samata, J. Alloys Compd., 2003, 350, 24–29 CrossRef CAS.
- I. S. Shaplygin and V. B. Lazarev, Russ. J. Inorg. Chem., 1978, 23, 626 Search PubMed.
- R. Shannon, Acta Crystallogr., Sect. B: Struct. Crystallogr. Cryst. Chem., 1970, 26, 447–449 CrossRef CAS.
- A. Banerjee, Z. Singh and V. Venugopal, Solid State Ionics, 2009, 180, 1337–1341 CrossRef CAS PubMed.
- A. Banerjee, R. Mishra and Z. Singh, Solid State Ionics, 2011, 201, 42–46 CrossRef CAS PubMed.
- J. N. Pratt, Metall. Trans. A, 1990, 21, 1223–1250 CrossRef.
- R. Sabbah, A. Xu-wu, J. S. Chickos, M. L. Planas Leitao, M. V. Roux and L. A. Torres, Thermochim. Acta, 1999, 331, 93–204 CrossRef CAS.
- G. W. H. Hohne, W. F. Hemminger and H. J. Flammershein, Differential Scanning Calorimetry, Springer, Berlin, 2nd edn, 2003 Search PubMed.
- O. Kubachewski, C. B. Alcock and P. J. Spencer, Materials Thermochemistry, Pergamon, Oxford, 6th edn, 1993 Search PubMed.
- G. V. Belov and B. G. Trusov, ASTD, Ver. 2.0, Computer Aided Reference Book in Thermodynamic, Thermochemical and Thermophysical Properties of species, Moscow, 1983–1995 Search PubMed.
- K. Graves, B. Kirby and R. Rardin, FREED Version 2.1, 1991 Search PubMed.
- J. C. Maxwell, Electricity and Magnetism, Oxford Univ. Press, London, 1973 Search PubMed.
- L. B. Pankratz, Thermodynamic Properties of Elements and Oxides, Bull. – U. S., Bur. Mines, 1982, 672 CAS.
|
| This journal is © The Royal Society of Chemistry 2014 |
Click here to see how this site uses Cookies. View our privacy policy here. ![[thin space (1/6-em)]](https://www.rsc.org/images/entities/char_2009.gif) :
:![[thin space (1/6-em)]](https://www.rsc.org/images/entities/char_2009.gif) 1
1![[thin space (1/6-em)]](https://www.rsc.org/images/entities/char_2009.gif) :
:![[thin space (1/6-em)]](https://www.rsc.org/images/entities/char_2009.gif) 2 was made into a pellet of dimension 10 mm diameter and 3 mm thickness using a tungsten carbide die at a pressure of 100 MPa. The pellet was sintered at T = 1000 K for several hours. The sintered pellets were reexamined by X-ray diffraction and the phase compositions were found to be unchanged after sintering. These pellets were then used for e.m.f. measurements.
2 was made into a pellet of dimension 10 mm diameter and 3 mm thickness using a tungsten carbide die at a pressure of 100 MPa. The pellet was sintered at T = 1000 K for several hours. The sintered pellets were reexamined by X-ray diffraction and the phase compositions were found to be unchanged after sintering. These pellets were then used for e.m.f. measurements.

![[thin space (1/6-em)]](https://www.rsc.org/images/entities/char_2009.gif) :
:![[thin space (1/6-em)]](https://www.rsc.org/images/entities/char_2009.gif) 1
1![[thin space (1/6-em)]](https://www.rsc.org/images/entities/char_2009.gif) :
:![[thin space (1/6-em)]](https://www.rsc.org/images/entities/char_2009.gif) 2 into pellets of dimension 10 mm diameter and 3 mm thickness at a pressure of 100 MPa. Synthetic dry air from an air generator was used as the reference electrode. The oxygen partial pressure of synthetic air does not depend on humidity or pressure variation. The temperature of the cell was measured by a calibrated chromel–alumel thermocouple located in the vicinity of the pellet. The e.m.f. of the cell was measured when the value of the e.m.f. was steady for 2–3 h using a high impedance Keithley 614 electrometer. Voltages were reproducible in subsequent heating cycles. E.m.f. was measured after initially equilibrating the galvanic cells at 1000 K for at least 24 h. The following cell configuration was employed in the present study:
2 into pellets of dimension 10 mm diameter and 3 mm thickness at a pressure of 100 MPa. Synthetic dry air from an air generator was used as the reference electrode. The oxygen partial pressure of synthetic air does not depend on humidity or pressure variation. The temperature of the cell was measured by a calibrated chromel–alumel thermocouple located in the vicinity of the pellet. The e.m.f. of the cell was measured when the value of the e.m.f. was steady for 2–3 h using a high impedance Keithley 614 electrometer. Voltages were reproducible in subsequent heating cycles. E.m.f. was measured after initially equilibrating the galvanic cells at 1000 K for at least 24 h. The following cell configuration was employed in the present study:

![[thin space (1/6-em)]](https://www.rsc.org/images/entities/char_2009.gif) 486.4 C mol−1 is the Faraday constant, T is the absolute temperature, t(O2−) is the effective transference number of O2− ion for the solid electrolyte and p′′(O2) and p′(O2) are the equilibrium oxygen partial pressures at the positive and negative electrodes respectively. The transport number of oxygen ion in the present electrolyte cell arrangement is nearly unity (t(O2−) > 0.99) at the oxygen pressures and temperatures covered in this study. Hence, the e.m.f. of the cell is directly proportional to logarithm of the ratio of partial pressures of oxygen at the electrodes:
486.4 C mol−1 is the Faraday constant, T is the absolute temperature, t(O2−) is the effective transference number of O2− ion for the solid electrolyte and p′′(O2) and p′(O2) are the equilibrium oxygen partial pressures at the positive and negative electrodes respectively. The transport number of oxygen ion in the present electrolyte cell arrangement is nearly unity (t(O2−) > 0.99) at the oxygen pressures and temperatures covered in this study. Hence, the e.m.f. of the cell is directly proportional to logarithm of the ratio of partial pressures of oxygen at the electrodes:![[thin space (1/6-em)]](https://www.rsc.org/images/entities/char_2009.gif) ln
ln![[thin space (1/6-em)]](https://www.rsc.org/images/entities/char_2009.gif) p′′(O2) − RT
p′′(O2) − RT![[thin space (1/6-em)]](https://www.rsc.org/images/entities/char_2009.gif) ln
ln![[thin space (1/6-em)]](https://www.rsc.org/images/entities/char_2009.gif) p′(O2),
p′(O2),
![[thin space (1/6-em)]](https://www.rsc.org/images/entities/char_2009.gif) ln
ln![[thin space (1/6-em)]](https://www.rsc.org/images/entities/char_2009.gif) p′′(O2) is the oxygen chemical potential over the positive electrode and RT
p′′(O2) is the oxygen chemical potential over the positive electrode and RT![[thin space (1/6-em)]](https://www.rsc.org/images/entities/char_2009.gif) ln
ln![[thin space (1/6-em)]](https://www.rsc.org/images/entities/char_2009.gif) p′(O2) is the oxygen chemical potential over the negative electrode.
p′(O2) is the oxygen chemical potential over the negative electrode.

![[thin space (1/6-em)]](https://www.rsc.org/images/entities/char_2009.gif) 189.1
189.1![[thin space (1/6-em)]](https://www.rsc.org/images/entities/char_2009.gif) 998.4
998.4![[thin space (1/6-em)]](https://www.rsc.org/images/entities/char_2009.gif) 948.3
948.3![[thin space (1/6-em)]](https://www.rsc.org/images/entities/char_2009.gif) 011.9
011.9![[thin space (1/6-em)]](https://www.rsc.org/images/entities/char_2009.gif) 171.6
171.6![[thin space (1/6-em)]](https://www.rsc.org/images/entities/char_2009.gif) 414.9
414.9![[thin space (1/6-em)]](https://www.rsc.org/images/entities/char_2009.gif) 732.9
732.9![[thin space (1/6-em)]](https://www.rsc.org/images/entities/char_2009.gif) 119.3
119.3![[thin space (1/6-em)]](https://www.rsc.org/images/entities/char_2009.gif) 569.2
569.2![[thin space (1/6-em)]](https://www.rsc.org/images/entities/char_2009.gif) 078.7
078.7![[thin space (1/6-em)]](https://www.rsc.org/images/entities/char_2009.gif) 645.2
645.2![[thin space (1/6-em)]](https://www.rsc.org/images/entities/char_2009.gif) 266.2
266.2![[thin space (1/6-em)]](https://www.rsc.org/images/entities/char_2009.gif) 940.0
940.0![[thin space (1/6-em)]](https://www.rsc.org/images/entities/char_2009.gif) σT versus reciprocal temperature that is the temperature dependence of the bulk dc conductivity. The activation energy of LuRhO3(s) was deduced from the linear part of the plot of log
σT versus reciprocal temperature that is the temperature dependence of the bulk dc conductivity. The activation energy of LuRhO3(s) was deduced from the linear part of the plot of log![[thin space (1/6-em)]](https://www.rsc.org/images/entities/char_2009.gif) σT versus reciprocal temperature. The activation energy was found to be 0.43 eV. The conductivity increases with increase in temperature and lower values of activation energies suggest semiconducting behavior for LuRhO3(s).
σT versus reciprocal temperature. The activation energy was found to be 0.43 eV. The conductivity increases with increase in temperature and lower values of activation energies suggest semiconducting behavior for LuRhO3(s).


